By many measures, volatility has reached historic highs this year. Away from the headlines and daily market fluctuations, our focus is on the underlying economic data. We are especially interested in the health of the consumer given its large influence on GDP. Recently, there has been increased attention given to the distinction between “hard” and “soft” data. For purposes of this paper, we will expand on the differences between these data types while providing context using a couple of examples.
Economic Data – Hard vs. Soft
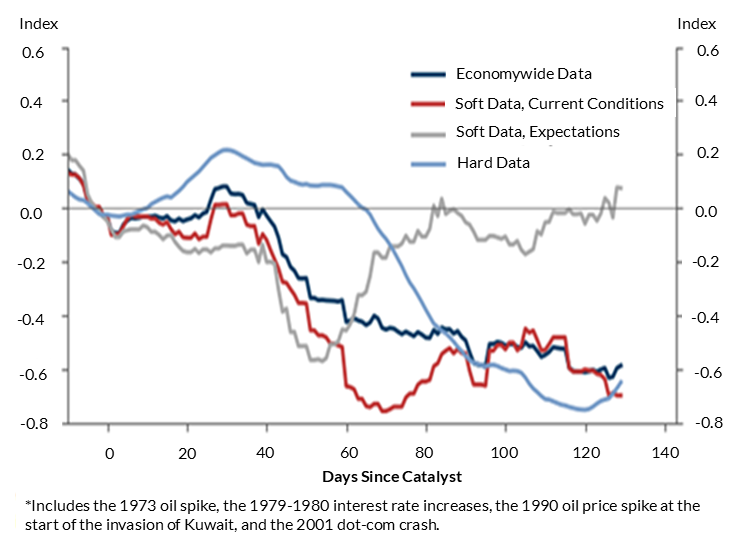
Soft economic data is more of a feel. It tries to capture the emotion of the moment. This is most typically done by way of surveys, interviews, or other qualitative assessments. This type of data can be inconsistent and open to interpretation. Hard data is, just that, real numbers captured by government and other statistical agencies. Hard data is backward looking and oftentimes doesn’t reflect current sentiment. One factor contributing to this issue is the time lag inherent in data reporting, as datasets are often released well after the period in which they were collected. The challenge is, both types of data don’t always agree with each other. In general, over the last couple of months, soft data has been trending weaker while the hard data has come in pretty much as expected. As Exhibit 1 shows, in previous instances where an event drives weakness in soft data, the hard data has weakened in a little over 60 days. This would indicate that we should expect hard data to start to weaken in June or late May at the earliest.
Exhibit 1: Evolution of Economic Data Around Key Catalysts to Previous Event-Driven Recessions*
Example 1: Consumer Retail Spending
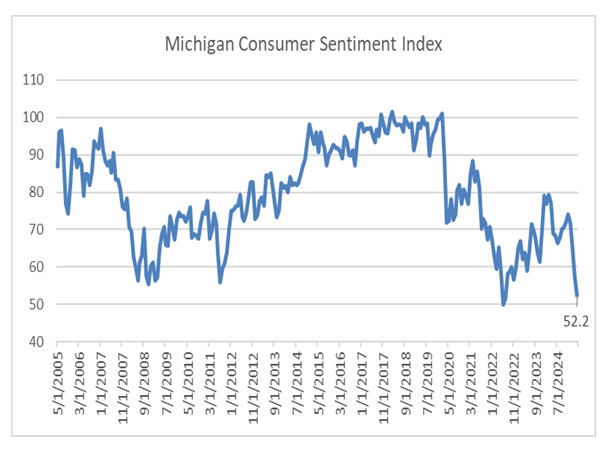
Probably the best example of soft data is the University of Michigan’s Consumer Sentiment Index. This index tries to determine the changes in consumers’ willingness to spend. The most recent result from the University of Michigan Consumer Sentiment Index came in at 52.2. This was the final number for April released on April 25th. As shown in Exhibit 2, this was among the lowest readings in many years. This year’s sharp drop, ending in April, looks similar in severity to other difficult periods of time including Covid and the Great Financial Crisis.
Exhibit 2: Michigan Consumer Sentiment Index
Does this mean we are heading for a recession? Not necessarily. The lag between this survey and the hard data has been measured at around 50-80 days1.
One example of the hard data is Advanced Retail Sales provided by the United States Census Bureau. This is used to help predict Gross Domestic Product2. Exhibit 3 shows the March 2025 Advanced Retail Sales figures. It’s important to point out that March data doesn’t include any reaction from consumers post “Liberation Day” on April 2nd. For Advanced Retail Sales, AAM focuses on the “Control Group” which excludes the more volatile market segments, including motor vehicle and gas station sales.
Exhibit 3: Advanced Retail Sales (control y/y)
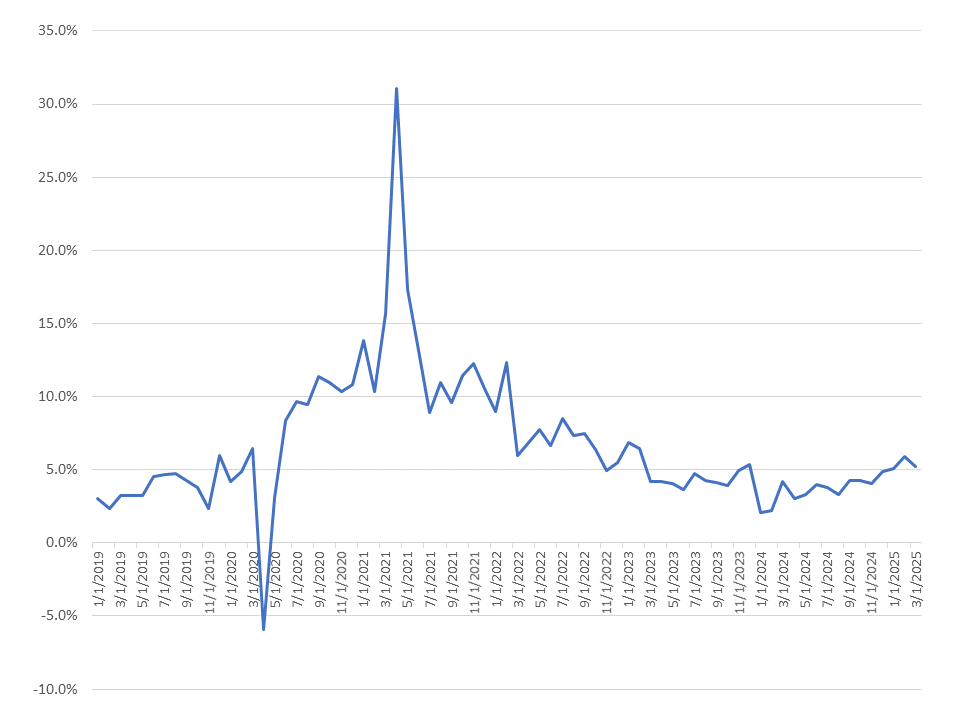
Looking at the recent trend at the end of March, consumer spending looks solid. Year-to-date growth was 5.4%, which compares to the 10-year average of 5.5%. While this data does not include spending in April, it would include spending that was likely in anticipation of impending tariffs given President Trump’s platform and announcements made regarding Canada and Mexico in early March. Hence, we believe it is likely that these numbers include some amount of pull-forward spending, as consumers bought items anticipating higher prices from tariffs. This pull-forward spend could itself result in weaker Retail Sales in the near term regardless of the weaker consumer-related sentiment data.
Example 2 – Employment
Employment is considered one of the most important factors when assessing the strength of the consumer. It’s very simple, if a person is worried about his/her job, he/she spends less. The Institute for Supply Management (ISM) released its Manufacturing and Services report for April in early May. This is a much-anticipated soft data economic release and is a diffusion index, reflecting the direction of trends in manufacturing and services (>50=expansion, <50 contraction). The data is obtained from a survey of executives in various services and manufacturing sectors. This survey data has shown to have good predictive ability for predicting hard data with a lag of 10-120 days for the ISM Services Index and 60-120 days for ISM Manufacturing3. The employment portion of the manufacturing index has been below 50 for the last 3 months in a row ending in April, while the services index was below 50 for the last 2 months4.
Hard data related to this survey would include employment. This data, including the April data from Change in Nonfarm Payrolls (177K), and the Unemployment Rate (4.2%) were solid. These numbers were released on May 2nd. We would expect these indicators to weaken in the coming months as impact from tariffs lower consumer spending and force management to rethink their employment strategy.
Conclusion
The important point from this discussion is that no one data point whether “soft” or “hard” should be analyzed in a vacuum. While soft data has received a lot of attention of late, it may take some time for this sentiment to materialize in the hard data. It may already be reflected in the data, or it may never materialize in the data. That said, uncertainty is elevated and we expect some level of tariffs to remain in place.
Our expectation is that consumer spending will start to slow, which will begin to show in the hard data over the next few months. A continuation of soft economic data would increase our confidence in predicting this slowdown. A major factor in the direction of sentiment is the tariff uncertainty. For example, traction with trade deals before the 90-day tariff pause expiration date of July 8th may help reduce the uncertainty in the business community and for consumers.
1 When will Growth Slow, and When Will we Know? Goldman Sachs, Jan Hatzius 4/22/2025
2 The Bureau of Economic Analysis uses Advanced Retail Sales as to estimate GDP
3 When will Growth Slow, and When Will we Know? Goldman Sachs, Jan Hatzius 4/22/2025
4 Bloomberg
Disclaimer: Asset Allocation & Management Company, LLC (AAM) is an investment adviser registered with the Securities and Exchange Commission, specializing in fixed-income asset management services for insurance companies. Registration does not imply a certain level of skill or training. This information was developed using publicly available information, internally developed data and outside sources believed to be reliable. While all reasonable care has been taken to ensure that the facts stated and the opinions given are accurate, complete and reasonable, liability is expressly disclaimed by AAM and any affiliates (collectively known as “AAM”), and their representative officers and employees. This report has been prepared for informational purposes only and does not purport to represent a complete analysis of any security, company or industry discussed. Any opinions and/or recommendations expressed are subject to change without notice and should be considered only as part of a diversified portfolio. Any opinions and statements contained herein of financial market trends based on market conditions constitute our judgment. This material may contain projections or other forward-looking statements regarding future events, targets or expectations, and is only current as of the date indicated. There is no assurance that such events or targets will be achieved, and may be significantly different than that discussed here. The information presented, including any statements concerning financial market trends, is based on current market conditions, which will fluctuate and may be superseded by subsequent market events or for other reasons. Although the assumptions underlying the forward-looking statements that may be contained herein are believed to be reasonable they can be affected by inaccurate assumptions or by known or unknown risks and uncertainties. AAM assumes no duty to provide updates to any analysis contained herein. A complete list of investment recommendations made during the past year is available upon request. Past performance is not an indication of future returns. This information is distributed to recipients including AAM, any of which may have acted on the basis of the information, or may have an ownership interest in securities to which the information relates. It may also be distributed to clients of AAM, as well as to other recipients with whom no such client relationship exists. Providing this information does not, in and of itself, constitute a recommendation by AAM, nor does it imply that the purchase or sale of any security is suitable for the recipient. Investing in the bond market is subject to certain risks including market, interest-rate, issuer, credit, inflation, liquidity, valuation, volatility, prepayment and extension. No part of this material may be reproduced in any form, or referred to in any other publication, without express written permission.