insight
Railroading Into the Future
May 9, 2012
In 1827, the Baltimore and Ohio (B&O) Rail Road Company, now part of CSX Corporation, was capitalized with just $5 million. The railroad would stretch from the port of Baltimore to the Ohio River in Virginia. The B&O Rail Road moved goods from the Midwest to the East coast, putting it in competition with the transportation of goods to New York by way of the Erie Canal. The first “locomotives” were powered by a horse that walked on a treadmill which drove a series of gears and wheels. In the early 1800’s, this was considered a major advancement in technology. Today, the industry is a lot more complicated and the focus on technology and efficiency has intensified. As the world continues to grow, so will the demand for a better and more cost effective transportation system. We will explore how the North American rails have performed in recent history and will give some examples of how the industry is preparing for the future. If history is any indication of the future, we expect the railroad industry will continue to shape the development of the North American economy.
The freight railroads in North America form an integrated system with over 140,000 miles of track. Rails transport almost everything including the things that we, as consumers, rely on daily including food products that end up on our kitchen tables, coal used to generate electricity, and lumber used to build our homes. The rail system has become one of the most reliable, safest, and productive in the world. As the economy grows and goods in the U.S. become more global, the demand for cost efficient transport will increase. According to the Federal Highway Commission, U.S. freight shipments will increase from 16.9 billion tons in 2010 to 27.1 billion tons in 2040. In order to compete with other modes of transportation, including pipelines and trucks, rails will need to spend a tremendous amount of money on new and existing infrastructure. Over time, these investments have led to improved service levels which is a key ingredient for more favorable pricing.
The rails spend between 17%-20% of their revenues on capital expenditures, which is higher than most other industries. For the six largest rails in North America, this totals to about $14 billion per year. Similar to most other industries, it’s necessary for the rails to always strive to improve their competitive position and look forward to capitalize on budding opportunities. Given the industry’s financial results and other important measures of productivity/efficiency, we believe the large amount of money the industry has invested has been well spent. These business improvements can be accomplished in a number of different ways. We will start off by reviewing some specific measures of productivity and efficiency. Then we will provide some real examples of how dollars are being spent. We believe this will help explain the progress of the industry and why we continue to believe the rail industry will perform well.
Operational Performance
The major railroads report important financial and operational data on a regular basis which makes it easy to track the progress of the industry. We will explore some of this data in the next couple of pages.

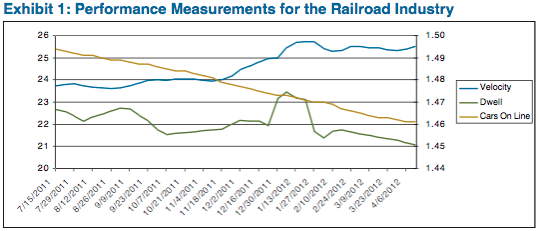
Exhibit 1 shows three measures of performance for the railroad industry. The first is average train velocity (higher velocity is better). The second is dwell time, or time a railcar resides at a terminal (lower is better). The final is the average of the daily online inventory of freight cars (lower is better). As shown in Exhibit 1, for the last 40 weeks you can see that all of these measures have been going in the right direction. Better performance typically results in lower costs and higher profitability.

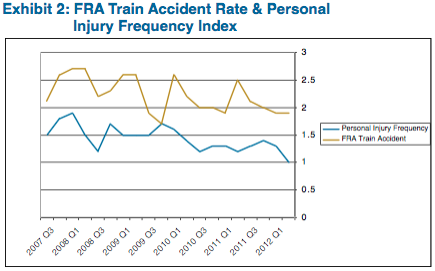
The graph in Exhibit 2 illustrates the industry’s attention to improving safety and minimizing the number of accidents, which is a direct result of enhanced employee training and applied leading edge technology. The personal injury frequency index is the number of reportable injuries per 200,000 man hours and the FRA (Federal Railroad Administration) train accident rate is the number of reportable train accidents per million train miles. A continued focus on safety should result in a more fluid rail network, less personal liability, lower cost structure, and the ability to maintain/enhance a high quality base of employees.

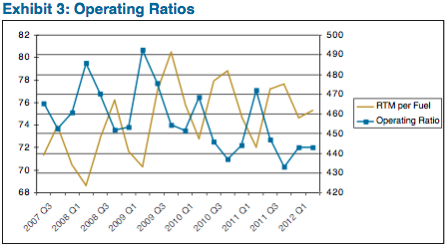
Fuel is a large portion of a railroad’s total costs. The ratio of fuel costs to revenue is about 10%. Over the last five years, the amount of revenue ton miles (RTM) per gallon of fuel consumed has trended up (shown Exhibit 3). One of the ways rails have been able to manage this cost is by investing in new locomotives which are much more energy efficient. In addition, one of the most important financial measures to focus on for the rail industry is the operating ratio (Exhibit 3). That ratio is calculated by taking operating expenses (includes labor, materials, fuel, and equipment) divided by revenues. We want to see this ratio getting smaller, which tells us that revenues are growing more quickly than the expenses.
Advancements in Technology
Now it’s time to give some examples of how the rails have been able to get these impressive results. One would not typically expect an age-old industry like the railroad industry to develop and implement the advanced technology that they use on a day-to-day basis.
One of those technologies is an acoustic detector system. Sensors placed on a railway help detect distinct sounds which might be the result of excess wear and tear on a specific piece of equipment. If that piece of equipment can be taken off-line and repaired before it creates a problem, like a derailment, a lot of time and money can be saved. Union Pacific uses special predictive software which analyzes data from acoustic and visual sensors. This kind of technology gives Union Pacific days or weeks notice before something is expected to go wrong. Major derailments can cost $20 – $40 million.
Another important technology uses ground penetrating radar (GPR) to look below the railway track substructure (rocks). Feedback from the radar and sensors is used to check for conditions which might compromise track stability, including excessive water and deteriorating terrain.
Canadian National Railway recently announced that the company will buy 200 super-insulated EcoTherm containers. These containers are specially insulated and eliminate the need for diesel engine powered heaters, which keep temperature sensitive products at a normal temperature for up to ten days. Goods shipped in one of these containers consume 8-11% less fuel than the traditional choice.
There have also been major developments in the area of locomotives. One technology uses special locomotives called distributed power units. These units operate in the middle and/or at the end of a line. This creates less force on the train which results in less wear and tear and higher fuel efficiency. Another new technology, GenSet locomotives, replace older traditional yard locomotives. GenSet uses several smaller engines as opposed to one large engine. This locomotive only uses the required amount of engines for specific tasks, resulting in better fuel efficiency. In the yard, these GenSet’s are expected to reduce fuel consumption by 37%. Some of these locomotives use remote control technology and have no cab.
These are just a few examples of ways that new technology has improved operational efficiency. Technology to look for in the future includes aerodynamic design improvements, rail lubrication processes, laser-based rail inspection systems, and the use of special metals which better resist wear and tear.
Growth Projects
The rail industry is not only spending a lot of money to modernize and improve its existing structure but it’s also spending billions of dollars a year to grow its current network. Expansion projects and the re-working of existing rail lines are key opportunities for growth and provide operational efficiencies.
One major project is called the Chicago Region Environmental and Transportation Efficiency Program (CREATE). This is a major collaboration between the City of Chicago, the State of Illinois, Metra, Amtrak, the U.S. Department of Transportation, and the major railroads. The project is expected to be completed in 2030 and cost $3 billion. The project will involve the construction of new overpasses/underpasses, upgrades to tracks, switches, signals, and improvements to crossing safety. The main goals are to improve service, reduce congestion, promote economic development, and improve the environment. Chicago handles about one quarter of North America’s freight rail traffic. Chicago has become a major bottleneck as the infrastructure was not built for the kind of volume experienced today. In the next 30 years, freight rail traffic is expected to double. Without this project, $1-$7 billion could be lost in economic production on an annual basis.
The Crescent Corridor project is a partnership between Norfolk Southern and 13 states. It’s a rail infrastructure project stretching from the Gulf Coast to the East Coast, which is expected to be completed by 2020 and cost around $2.5 billion. Norfolk Southern will make changes that will enable the line to add more freight. These enhancements include the building of new track, straightening curves, adding signals, and building and expanding terminals. The project is expected to create 73,000 jobs by 2030, and is expected to save 170 million gallons of fuel while taking 1.3 million trucks off the highways annually.
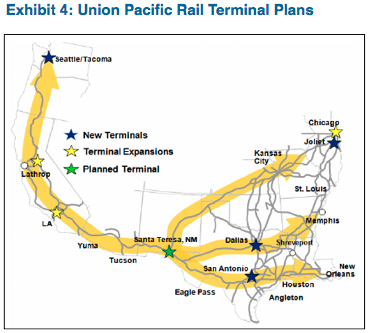
Union Pacific is expected to spend about $400 million on a project to build a new rail facility in Santa Teresa, New Mexico. The project is expected to be completed by 2015. When the project is complete, the facility will include 200 miles of track and 26 buildings for yard operations including intermodal and fueling capabilities. This project should enhance the movement of goods throughout the southwestern United States and position Southern New Mexico as a critical component of the “Sunset Route”, as shown in the map in Exhibit 4 .

Investment in new and existing infrastructure and dedication to innovative technology are some of the most important ways that the railroad industry has been able to improve productivity and enhance profitability. As the economy expands and the demand for the cost efficient transportation of goods increases, we expect the rails to continue to find ways to respond to network demands while joining the vast global transportation network.
Michael J. Ashley
Vice President, Corporate Credit
For more information, contact:
Greg Curran, CFA
Vice President, Business Development
greg.curran@aamcompany.com
1 “An Overview of America’s Freight Railroads”, Association of American Railroads (October 2011):1.
2“An Overview of America’s Freight Railroads”, Association of American Railroads (October 2011): 3.
3 Michael Hickins, “Union Pacific Using Predictive Software to Reduce Train Derailments”, Wall Street Journal, March 30, 2012. Accessed April 17, 2012, https://blogs.wsj.com/cio/2012/03/30/union-pacific-using-predictive-software-to-reduce-train-derailments/
4 Michael Hickins, “Union Pacific Using Predictive Software to Reduce Train Derailments”, Wall Street Journal, March 30, 2012. Accessed April 17, 2012, https://blogs.wsj.com/cio/2012/03/30/union-pacific-using-predictive-software-to-reduce-train-derailments/
5 “CN Buys 200 EcoTherm Containers”, Environmental Leader (October 19, 2011):1, accessed April 27, 2012, https://www.environmentalleader.com/2011/10/19/cn-buys-200-ecotherm-containers/
6 “CN Buys 200 EcoTherm Containers”, Environmental Leader (October 19, 2011):1, accessed April 27, 2012, https://www.environmentalleader.com/2011/10/19/cn-buys-200-ecotherm-containers/
7 “Innovation and Employee Education Save Fuel,” Union Pacific (March 2012): 1
8 “Chicago: America’s Rail Hub,” Chicago Region Environmental and Transportation Efficiency (CREATE) Program, accessed April 17, 2012, https://www.createprogram.org/about.htm#need
9 “Chicago: America’s Rail Hub,” Chicago Region Environmental and Transportation Efficiency (CREATE) Program, accessed April 17, 2012, https://www.createprogram.org/about.htm#need
10 “Chicago: America’s Rail Hub,” Chicago Region Environmental and Transportation Efficiency (CREATE) Program, accessed April 17, 2012, https://www.createprogram.org/benefits.htm
11 “ Railroad Investment Projects Create Jobs, Stimulate Economy,” Freight Rail Works, accessed on April 17, 2012, https://freightrailworks.org/#economy/partners
12 “Union Pacific Railroad Begins Construction of $400 Million Rail Facility in New Mexico,” Union Pacific, accessed April 25, 2012, https://www.uprr.com/newsinfo/releases/capital_investment/2011/0808_santa_teresa.shtml
Disclaimer: Asset Allocation & Management Company, LLC (AAM) is an investment adviser registered with the Securities and Exchange Commission, specializing in fixed-income asset management services for insurance companies. This information was developed using publicly available information, internally developed data and outside sources believed to be reliable. While all reasonable care has been taken to ensure that the facts stated and the opinions given are accurate, complete and reasonable, liability is expressly disclaimed by AAM and any affiliates (collectively known as “AAM”), and their representative officers and employees. This report has been prepared for informational purposes only and does not purport to represent a complete analysis of any security, company or industry discussed. Any opinions and/or recommendations expressed are subject to change without notice and should be considered only as part of a diversified portfolio. A complete list of investment recommendations made during the past year is available upon request. Past performance is not an indication of future returns.
This information is distributed to recipients including AAM, any of which may have acted on the basis of the information, or may have an ownership interest in securities to which the information relates. It may also be distributed to clients of AAM, as well as to other recipients with whom no such client relationship exists. Providing this information does not, in and of itself, constitute a recommendation by AAM, nor does it imply that the purchase or sale of any security is suitable for the recipient. Investing in the bond market is subject to certain risks including market, interest-rate, issuer, credit, inflation, liquidity, valuation, volatility, prepayment and extension. No part of this material may be reproduced in any form, or referred to in any other publication, without express written permission.
Disclaimer: Asset Allocation & Management Company, LLC (AAM) is an investment adviser registered with the Securities and Exchange Commission, specializing in fixed-income asset management services for insurance companies. Registration does not imply a certain level of skill or training. This information was developed using publicly available information, internally developed data and outside sources believed to be reliable. While all reasonable care has been taken to ensure that the facts stated and the opinions given are accurate, complete and reasonable, liability is expressly disclaimed by AAM and any affiliates (collectively known as “AAM”), and their representative officers and employees. This report has been prepared for informational purposes only and does not purport to represent a complete analysis of any security, company or industry discussed. Any opinions and/or recommendations expressed are subject to change without notice and should be considered only as part of a diversified portfolio. Any opinions and statements contained herein of financial market trends based on market conditions constitute our judgment. This material may contain projections or other forward-looking statements regarding future events, targets or expectations, and is only current as of the date indicated. There is no assurance that such events or targets will be achieved, and may be significantly different than that discussed here. The information presented, including any statements concerning financial market trends, is based on current market conditions, which will fluctuate and may be superseded by subsequent market events or for other reasons. Although the assumptions underlying the forward-looking statements that may be contained herein are believed to be reasonable they can be affected by inaccurate assumptions or by known or unknown risks and uncertainties. AAM assumes no duty to provide updates to any analysis contained herein. A complete list of investment recommendations made during the past year is available upon request. Past performance is not an indication of future returns. This information is distributed to recipients including AAM, any of which may have acted on the basis of the information, or may have an ownership interest in securities to which the information relates. It may also be distributed to clients of AAM, as well as to other recipients with whom no such client relationship exists. Providing this information does not, in and of itself, constitute a recommendation by AAM, nor does it imply that the purchase or sale of any security is suitable for the recipient. Investing in the bond market is subject to certain risks including market, interest-rate, issuer, credit, inflation, liquidity, valuation, volatility, prepayment and extension. No part of this material may be reproduced in any form, or referred to in any other publication, without express written permission.