Market summary and outlook
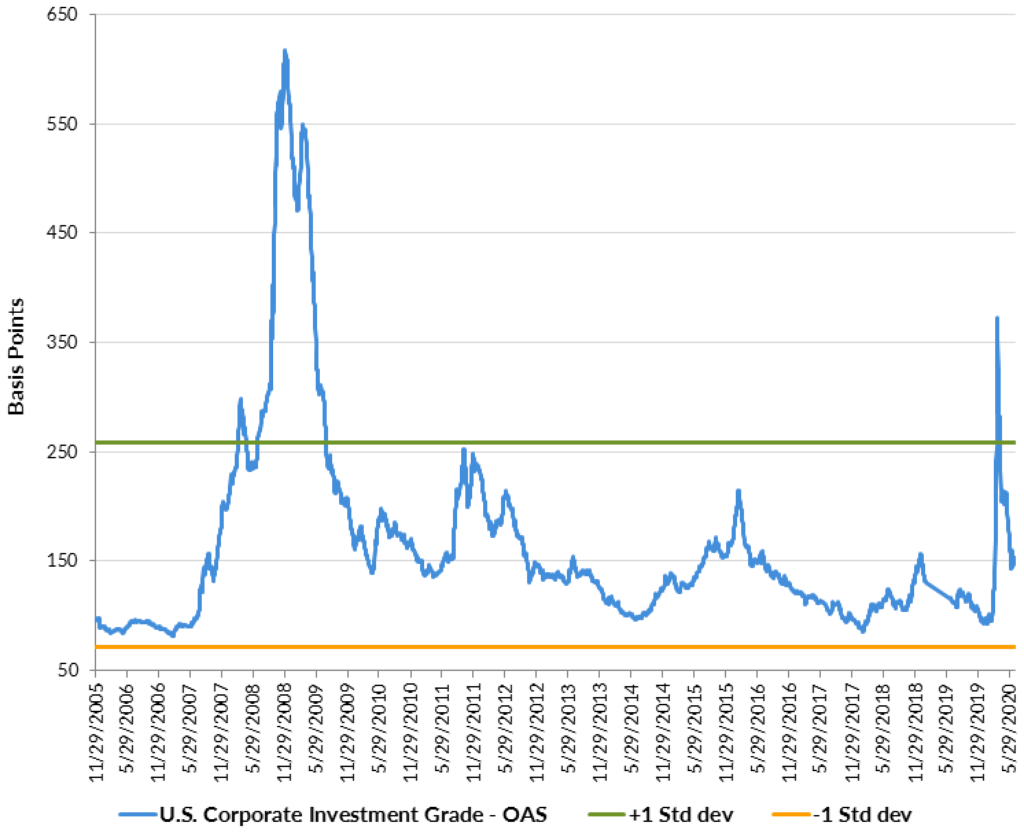
By Elizabeth Henderson, CFA – The Investment Grade (IG) Corporate bond market (per Bloomberg Barclays Index) experienced a historic bout of volatility in the first half of 2020, as spreads widened from a low of 93 basis points (bps) in mid-January to a high of 373 bps on March 23, ending the second quarter at 150 bps (Exhibit 1). Excess returns over Treasuries year-to-date June 30 were negative at -5.4%, but with the Treasury yield rally, total return was 5.0%. The IG market outperformed the S&P Index, which returned -3.1% and High Yield market (per Bloomberg Barclays Index) at -3.8%.
Exhibit 1: U.S. Corporate Investment Grade OAS
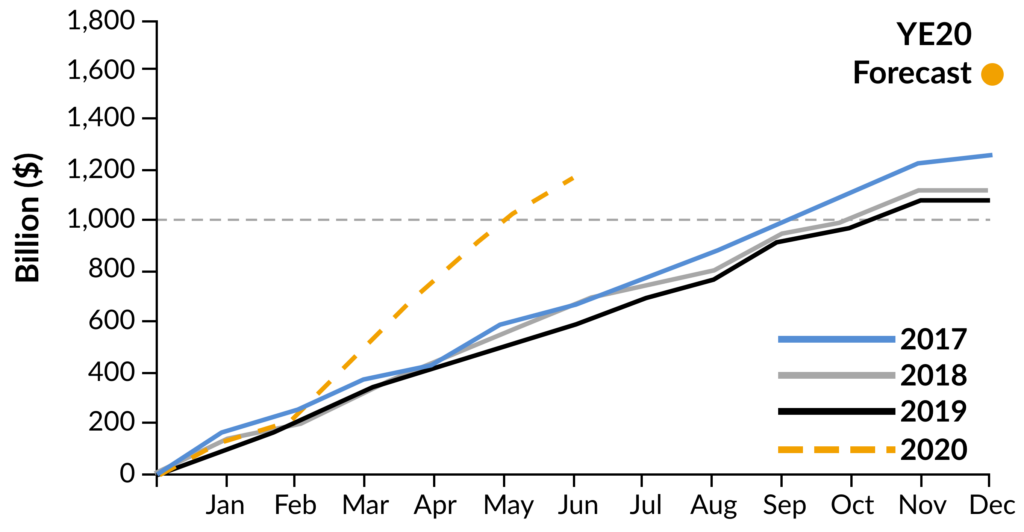
The monetary and fiscal support provided to the markets and economy in March set a floor for the markets as it allowed investors to model downside risk. At that time, the market’s estimate for ratings downgrades to high yield far surpassed our analyst team’s bottom-up estimate. This gave us the ability to measure risk and invest at a time of very attractive spreads especially in the new issue market. In regards to new issue, we saw a record amount in all U.S. fixed income markets with the IG market reaching $1.2T by June, as companies looked to increase liquidity during an uncertain time. We expect a more modest $400B to be issued in the second half, and given scheduled maturities, the net amount could be as low as $45B (Source: Eric Beinstein, JP Morgan, “US High Grade Corporate Bond Issuance Review” 7/2/2020). We are expecting that to be higher as companies look to take advantage of low rates for early refinancing and tender activity, and possibly M&A if the outlook for the economy becomes more certain.
Exhibit 2: New Issuance Hits a Record Pace
Valuation is statistically fair with spreads normalizing over the last couple months, at a sector, industry and rating level. The market is reflecting an expectation for the economy to return to pre-COVID 19 levels in the near term. For example, a modest 6% of the IG market reflected risk of credit rating downgrades to high yield at June 30, 2020, down substantially from 25% in late March 2020 and up modestly from 4% at the end of January 2020. If the economic recovery takes longer than expected, we believe that will easily double.
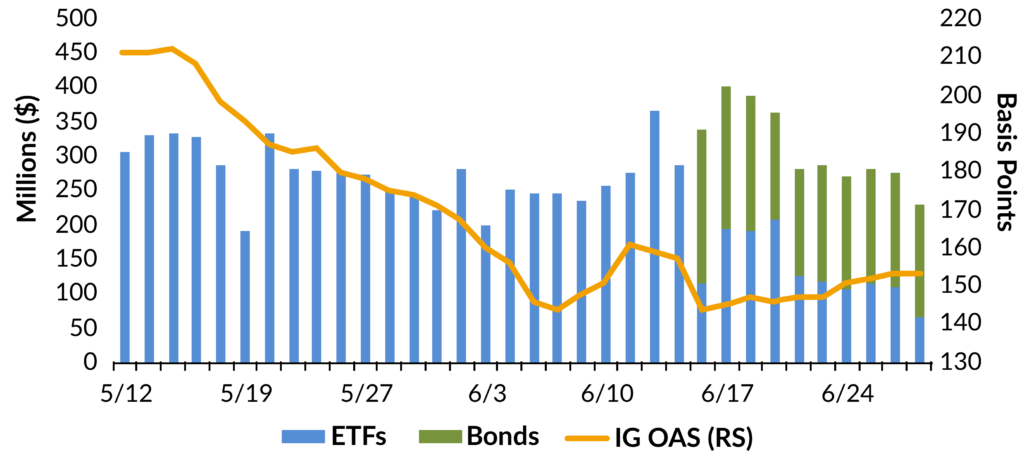
While we expect spreads to widen in that scenario, technical support is expected to remain stronger than it was in March given the improved cash positions of companies and the Federal Reserve’s corporate bond buying program. At the pace at which it has been buying, the Fed is likely to have significant flexibility under its $750B program that expires September 30, 2020 (although likely extended in a stressed environment) (Exhibit 3).
Exhibit 3: Fed Purchases Corporate Bonds and ETFs
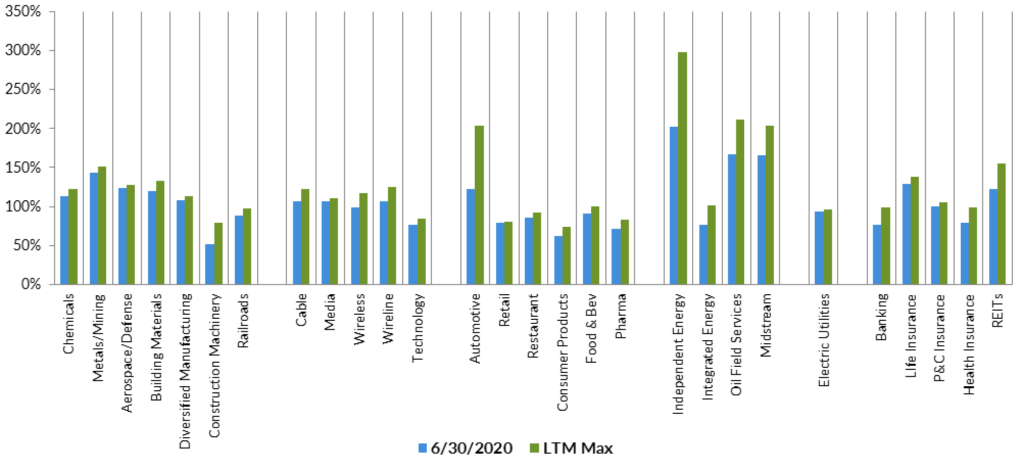
We are closely monitoring the pace of re-opening, expecting spreads to remain highly correlated with that progress as well as the progress developing a vaccine and passing additional fiscal stimulus. After recommending an increase in corporate bond allocations for portfolios in late March and the subsequent tightening of spreads through today, we are recommending a reduction to build flexibility in portfolios to add at more attractive points. This is especially the case in industries and credits we believe will be more vulnerable if the economic rebound is more modest. While spreads had reflected this risk in April as shown in Exhibit 4, this includes sectors like: Autos, Energy, REITs, Banks and non-essential Retail and Leisure. The short end of the curve has recovered and reached pre-COVID-19 spreads, leaving little value relative to other segments of the IG fixed income market.
Exhibit 4: Sector Spreads Relative to Industrial Sector OAS
Finally, you’ll notice our newsletter this quarter is longer than usual. Given the degree of uncertainty in the market, we thought it worthwhile to provide more information on topics and sectors most directly related and/or impacted by the COVID-19 pandemic.
Vaccine: When and If
By Michael Ashley – This continues to be a very hot topic, on the minds of most people across the globe. We have seen violent spikes in certain regions of the U.S. and the world, resulting in measured shutdowns which hope to slow transmission and ultimately avoid hospital overcrowding and deaths. There continues to be lots of unanswered questions about this virus, such as “How many people have been infected that have not been tested?,” “How long do antibodies provide protection?”, and “What is the proper quarantine period for those that have tested positive?” Despite these and many more questions, the process of developing an effective vaccine moves forward. There are many vaccines in development and a relatively smaller number that are heading into Phase III trials starting in July (Moderna, Pfizer) and August (AstraZeneca). It appears we could potentially start hearing about results from these trials in the October/November time frame. In a survey to 184 C-level executives and 37 investors across the healthcare sector in May through June, 75% of respondents estimate that a vaccine will be widely available in the second half of 2021 or later. Two-thirds of respondents put the probability for a widely available vaccine at above 50%, and 49% put the likelihood of a therapeutic at greater than 50%.
Exhibit 5: When Will a Vaccine Become Widely Available?

With over 100 vaccines in the works, we are confident that one, if not several, vaccines will be proven an effective treatment. The scale and rate at which this process is moving complicates the timeline around “when” a vaccine is available at your local drugstore or doctor’s office. There seems to be some mismanagement at the FDA and this topic could become a political issue given the upcoming election. In short, no one knows when a vaccine will be here and issues of safety have become more concerning. Even if phase III trials go as planned, there’s no guarantee that a vaccine will meet FDA guidelines and will be trusted by the world. Our view remains that an effective, usable vaccine is not readily available for use until 2021, probably not until mid-year. In the interim, we look forward to upcoming trial results this fall that are positive.
Fiscal Stimulus: When and How Much?
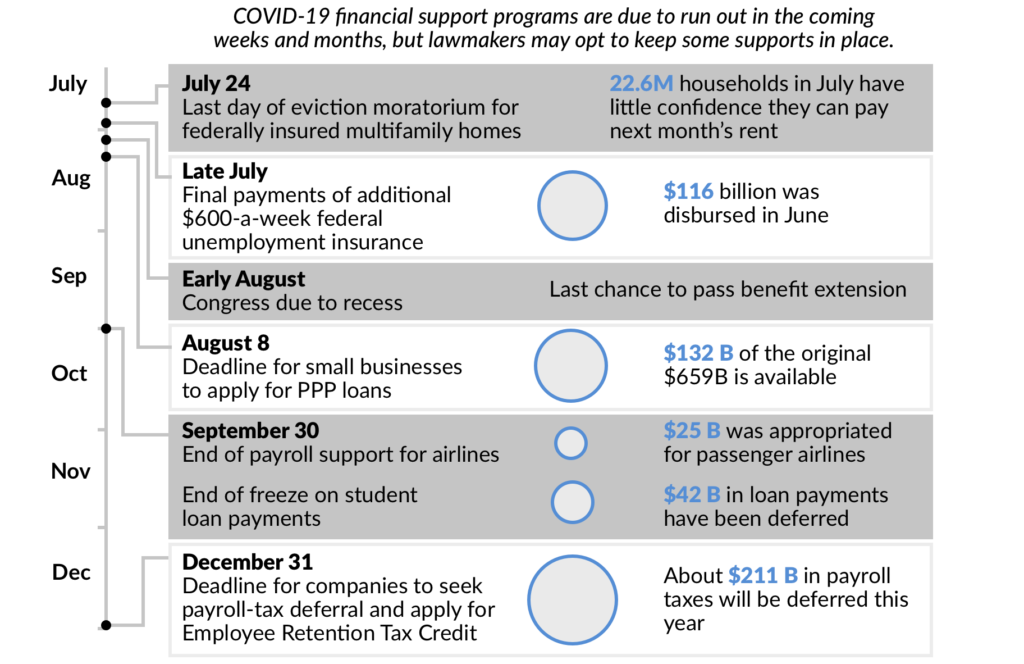
By Garrett Dungee – In regards to the fiscal stimulus timeline, the deadline is quickly approaching before enhanced unemployment benefits expire at the end of the month. The Senate just returned to session on July 20th, and the House enters their August recess on 8/3, and the Senate the following week. This timeline affords a small window for both parties to reach an agreement and pass a Phase 5 stimulus package before the CARES Act programs expire. Both parties return to the Hill the second week of September, two months before the election, where the political stakes will be higher. State and local governments, hospitals, higher education facilities, small businesses, and the consumer require additional stimulus due to the public health crisis. Municipalities are close to the action on the Hill and will continue to lobby their representatives who are well aware of the issues they face. Until there’s a vaccine, it’s likely the economy will not reach its pre-COVID-19 potential. The Fed has communicated its understanding and support. But, the metaphorical ball is in the Senate’s court, and it becomes all about the narrative. Does it change from political pressure? Do we see momentum towards a stimulus bill?
The virus has remained more problematic than many assumed a month ago, especially in southern states. Due to the recent developments, we think the chances of stimulus look better compared to June, where we saw several positive economic surprises, and May, where we saw one retiring house Republican vote for the $3T Heroes Bill. The consensus among economists suggests an additional package of around $2.4T is needed. Senate Majority Leader Mitch McConnell has confirmed that a Paycheck Protection Program (PPP) extension and more direct payments will be in the Republican bill. So at a minimum, we could see a PPP and unemployment benefits extension in July or a retroactive extension in August. We could also see the House stay to negotiate a more substantial relief package, or the House could compromise on a smaller bill for consumers while promising to address the state and local funding issues through the appropriations process for the new fiscal year starting in October. AAM believes there will be additional fiscal support, although the timing is uncertain, especially given the upcoming recess periods for both the House and Senate. We believe the longer it takes for Congress to pass a package, the more damage will be done to the recovery.
Exhibit 6: End of Relief
Autos: A Volatile Sector that Continues to Face Challenges
By Afrim Ponik, CFA – The COVID-19 pandemic brought shock waves across the automotive industry, impacting original equipment manufacturers (OEMs) and part makers globally. We witnessed a significant cash outflow from the manufacturers as the accounts payable came due, while sales declined 50% or more as reported by WARD’s Automotive Group and published by Bloomberg. Having dealt with liquidity crunches before, car companies drew their revolvers down and together with the vast amounts of cash on the balance sheets, bought themselves enough time to withstand this industry shock in an impressive way.
Following the mandatory shutdowns, we witnessed an increased demand for cars given people’s change in lifestyle, providing a nice cushion to the prices of used cars and therefore residual values, insulating the captive finance arms from taking write downs. We believe the industry did an impeccable job withstanding this shock, but demand recovery should be slow and other industry challenges loom in the horizon. We highlight electrification of drive trains, autonomous driving, stringent emission requirements, in addition to under utilized manufacturing footprint globally as current and future challenges impacting profitability and requiring significant capital spending.
Energy: A Litany of Challenges
By Patrick McGeever – In the near term, we will closely monitor how energy companies are navigating the challenges posed by the COVID-19 pandemic and the resulting economic weakness. The key items we will be focusing on are:
• production, particularly as we exit 2020;
• capital spending discipline;
• free cash flow generation and
• shareholder friendly actions in this weak commodity environment.
Many oil producers shut-in production and dramatically reduced completion activity in response to record low oil prices in the second quarter. We believe that producers have brought suspended activities back in recent weeks, but we anticipate the curtailment of drilling since March will lead to production declines of 10%-20% from 4Q19 to 4Q20. We are forecasting capital spending will contract 50%-60% from 2019 to 2020 and believe that any increase in capital spending forecasts will be viewed negatively by stakeholders. We believe free cash flow generation will be better in the second half of the year than in the first half of the year provided higher commodity prices and lower capital spending.
Notwithstanding COVID-19 related issues, the energy industry faces a litany of challenges in the intermediate term. First, the midstream sector is amid legal challenges surrounding environmental impact studies and potential restraining orders on operations. Additionally, the probability of a change in Iranian foreign policy and therefore Iranian oil exports is growing provided the existing Presidential Polling figures, which indicate that Former Vice President Biden is leading President Trump by 5%-10% in most surveys. Furthermore, the decarbonization of the economy and Environmental, Social and Governance (ESG) forces are increasing, leading to reduced capital allocated to the sector. All of these issues are leading to much higher cost of capital for issuers in the investment grade energy sector, which will challenge even the strongest participants.
The energy sector is rightly trading wide of its historic norms and is currently approximately one standard deviation wide of Industrials according to the Bloomberg Barclays US Aggregate Index. We have been actively upgrading our energy exposure given the risks highlighted. Future investments in the sector will be in companies that can generate positive cash flow in the existing commodity environment without the need to access capital markets to fund its operations; have near term catalysts to improve its balance sheet; and/or have plans to improve ESG governance.
Insurance: Enhanced Liquidity Solves Near Term Problems
By Garrett Dungee, CFA – While it is too early to determine the extent of insured losses stemming from the COVID-19 pandemic, loss estimates by Dowling & Partners, Barclays Research, Autonomous Research, BofA Global Research, Berenberg, and Willis Towers Watson range from $30-107B. The bulk of insured losses are expected to come from non-life commercial lines, including, event cancellation, entertainment, business interruption insurance, and litigation-related expenses. Shelter in place orders meant fewer drivers on the road for personal lines, and the favorable trends are expected to continue at least in the short term. So far, several insurers have pre-announced pandemic related catastrophe losses that point to an earnings, not a capital, event for the industry. These second-quarter catastrophe charges serve to reduce, but not eliminate uncertainty for an industry that remains well-capitalized.
For life insurance, the pandemic’s disruption to the economy remains a more significant challenge than the exposure to net mortality, however that could change if the trajectory of the virus accelerates towards a worst-case scenario. We believe longer-term, low rates will continue to be a significant headwind for the industry with lower reinvestment rates and as insurers head into their annual assumption reviews.
Low rates, claims uncertainty, and need for additional liquidity led to a surge in issuance for the sector, almost $50B year to date, on pace to shatter $60B issued in 2019. The strong demand shown for insurance debt with oversubscribed deals points to the resiliency of the sector, and the ability to maintain access if market conditions worsen.
Banking: Fortress Balance Sheets Bolster Against Pandemic Related Credit Costs
By Sebastian Bacchus, CFA – As we come to the end of the first week of second quarter (2Q20) bank earnings*, there are a number of preliminary observations bolstering our belief that strong balance sheets will allow the sector to remain a source of strength and support for the US economy during the pandemic driven downturn. At this point the ten largest US banks have reported earnings and for the second quarter in a row, results were driven primarily by outsized provisioning for future credit costs as the macroeconomic outlook continues to worsen. In contrast to 1Q20, provisioning by banks that have reported earnings this quarter has been focused more heavily on the commercial and commercial real estate loan books (as compared to a greater focus on consumer lending, especially unsecured consumer credit, last quarter). While we have seen variations in banks’ approach to reserving over the past two quarters, all of the banks are preparing for a protracted downturn with outlooks generally calling for ~10% unemployment levels to remain through YE20 and only gradual reductions through FY21, accompanied by a slow return to economic growth in FY21. As a result, all of the banks are growing their allowance for credit loss (ACL) toward or through 2% of loans, and the allowance is generally being sized in the context of the severely adverse loss scenarios from the recently completed Dodd-Frank Act Stress Test (DFAST), even as realized credit losses remain quite low due to ongoing Federal support for individuals and businesses.
Despite the impact of outsized provisions for loan loss, all of the banks remained profitable (with the exception of Wells Fargo) reflecting still robust pre-tax, pre-provision net revenues (PPNR). Although net interest income was impacted by the meaningful fall in front-end rates following the Fed rate cuts, offsets included strong capital markets revenues and mortgage banking revenues. Importantly, all of the banks announcing earnings this week reported strengthening regulatory capital levels, as the previously announced suspension of stock buy-backs has meaningfully reduced capital return to shareholders, allowing capital to build through retained earnings. Additionally, banks have benefited from stable or reduced levels of risk weighted assets (the denominator in the regulatory capital calculation) as balance sheet growth was primarily driven by the Paycheck Protection Program (PPP) loans which carry a zero risk weight (and zero economic risk) for the banks. We expect further capital guidance from regulators after the banks submit to a second DFAST stress test later this year that incorporates updated macroeconomic projections (most likely during 4Q20). However, we view the regulatory actions on capital return to be explicitly creditor friendly, and reflective of the regulators’ focus on preventing the pandemic from transforming a public health crisis into a financial crisis.
While the path of the economic downturn remains uncertain, the strong levels of bank capital, strong balance sheet liquidity and growing levels of allowance for credit loss offer a bulwark against credit deterioration that would harm credit investments in the banking sector.
*Publicly reported 2Q2020 earnings releases by banks on our focus list are the source for all of the statistics.
Disclaimer: Asset Allocation & Management Company, LLC (AAM) is an investment adviser registered with the Securities and Exchange Commission, specializing in fixed-income asset management services for insurance companies. Registration does not imply a certain level of skill or training. This information was developed using publicly available information, internally developed data and outside sources believed to be reliable. While all reasonable care has been taken to ensure that the facts stated and the opinions given are accurate, complete and reasonable, liability is expressly disclaimed by AAM and any affiliates (collectively known as “AAM”), and their representative officers and employees. This report has been prepared for informational purposes only and does not purport to represent a complete analysis of any security, company or industry discussed. Any opinions and/or recommendations expressed are subject to change without notice and should be considered only as part of a diversified portfolio. Any opinions and statements contained herein of financial market trends based on market conditions constitute our judgment. This material may contain projections or other forward-looking statements regarding future events, targets or expectations, and is only current as of the date indicated. There is no assurance that such events or targets will be achieved, and may be significantly different than that discussed here. The information presented, including any statements concerning financial market trends, is based on current market conditions, which will fluctuate and may be superseded by subsequent market events or for other reasons. Although the assumptions underlying the forward-looking statements that may be contained herein are believed to be reasonable they can be affected by inaccurate assumptions or by known or unknown risks and uncertainties. AAM assumes no duty to provide updates to any analysis contained herein. A complete list of investment recommendations made during the past year is available upon request. Past performance is not an indication of future returns. This information is distributed to recipients including AAM, any of which may have acted on the basis of the information, or may have an ownership interest in securities to which the information relates. It may also be distributed to clients of AAM, as well as to other recipients with whom no such client relationship exists. Providing this information does not, in and of itself, constitute a recommendation by AAM, nor does it imply that the purchase or sale of any security is suitable for the recipient. Investing in the bond market is subject to certain risks including market, interest-rate, issuer, credit, inflation, liquidity, valuation, volatility, prepayment and extension. No part of this material may be reproduced in any form, or referred to in any other publication, without express written permission.