insight
AAM’s 2026 Fixed Income Outlook: Navigating Late-Cycle Markets with Selectivity and Opportunity
December 18, 2025
Download PDFAAM Fixed Income Outlook 2026
The 2026 outlook across investment-grade corporate bonds, structured products, and municipal markets is broadly stable but increasingly selective, with muted return expectations and a heightened focus on credit quality and sector dispersion. We expect the new issue market to be a source for outperformance in markets in 2026. A broad opportunity set will be important in addition to flexibility and diversification, as investors seek outperformance in a more challenging environment
The municipal market enters 2026 with a mixed outlook. The tax-exempt sector appears unattractive for institutional investors due to expensive relative valuations and another year of record new issuance, with technicals expected to remain a headwind. Despite stable state and local government credit fundamentals and strong reserve positions, the tax-adjusted yield disadvantage persists, making tax-exempt municipals less appealing for portfolios subject to a 21% corporate tax rate. In contrast, the taxable municipal sector is viewed more constructively, supported by normalized spreads, manageable supply, and stable fundamentals. Higher education remains a focal point, with the strongest institutions demonstrating resilience despite ongoing policy and funding pressures. Overall, the recommendation is to favor taxable municipals over tax-exempts for institutional portfolios in 2026.
In corporate credit, spreads are expected to widen modestly as fundamentals deteriorate in line with late-cycle dynamics – higher leverage, margin compression, and slowing growth. While rating activity was largely positive in 2025, we expect that trend to normalize and begin to reverse as we enter later stages of the cycle. While technicals remain supportive, sector and security selection will be critical to drive performance. Sectors such as Autos, Integrated Energy, Pharmaceuticals, and Utilities are favored for their strong fundamentals and relative value, while Technology and Finance face pressure from AI-driven capital spending and private credit concerns. Consumer sectors are challenged by slowing spending and tariff impacts, but autos and retail maintain healthy, if cautious, growth. Healthcare and financials benefit from solid fundamentals and supportive macro trends, though regulatory and technical factors drive issuer-level dispersion.
Structured products outperformed Treasuries and corporates in 2025, led by Agency MBS, but 2026 is expected to bring more muted returns as spreads normalize and technical supply challenges emerge. Agency MBS should benefit from stable rates and low prepayment volatility, though increased supply will test market absorption. ABS spreads remain attractive, with tighter underwriting and higher disposable income supporting credit quality, but sector selection is key—favoring equipment, aircraft, and mid-prime auto issuers while avoiding riskier data center securitizations. CMBS faces refinancing risks, especially in office properties, but diversified pools and shorter maturities offer competitive yields. CLOs are likely to underperform amid Fed rate cuts and record supply, with senior tranches expected to widen. Overall, disciplined credit selection and a focus on high-quality, well-capitalized issuers are essential as investors navigate a more challenging and differentiated landscape in 2026.
Municipal Market 2026 Outlook
Our outlook for the Municipal market in 2026 is again mixed. Entering the new year, the tax-exempt sector screens as unattractive for institutional investors given expensive relative valuation levels and what is expected to be another year of record new issuance. Conversely, we retain a constructive view toward the taxable municipal sector. Spread levels have normalized following the tariff-driven volatility of early 2025, and we expect a manageable new-issue calendar, stable state and local fiscal conditions, and improving technicals to remain supportive of valuations in 2026.
Total municipal issuance—tax-exempt and taxable—is projected to reach approximately $600 billion in 2026, which would set a new record for the industry and modestly exceed the ~$590 billion expected to price in 2025. As in 2025, “new-money” issuance for infrastructure financing is expected to dominate supply. Broker estimates suggest over $400 billion of issuance tied to infrastructure projects, roughly in line with 2025’s year-end expectations. For taxable munis specifically, issuance is projected at $55 billion in 2026, up from an estimated $49 billion in 2025, which includes issuance under corporate CUSIPs primarily linked to higher education and healthcare borrowers1.
Tax-Exempt Municipals: Relative Valuation Pressures Remain Despite Strong Credit Fundamentals
The tax-exempt sector navigated several headwinds in 2025, and many of these pressures appear likely to extend into 2026. Relative valuation volatility proved to be the dominant narrative. A combination of record new-issue supply—averaging $49 billion per month through the first ten months of 2025—rate volatility tied to the Independence Day tariff announcement, and political uncertainty surrounding federal fiscal policy all contributed to meaningful weakening in municipal/Treasury ratios2.
Ratios in the 10 year tenor, which began 2025 near 66.9%, rose to as high as 89.7% during the year as the market absorbed both significant rate volatility and supply-driven technical weakness. The deterioration in ratios also coincided with weakening long-term mutual fund flows. After beginning the year with positive inflows into long-term funds that averaged $577 million per week through the first 2 months of year, outflows averaged roughly $96 million per week between March and August as rate and policy volatility weighed on retail demand. The lack of reinvestment support at the long end, combined with persistent primary supply, resulted in a steepening of the 10- to 20-year yield curve slope by 36 basis points to 116 bps between April 1st and August 29th.3
Looking ahead, we expect technicals to remain a headwind for tax-exempts in 2026. With supply projected at $600 billion, and with a substantial portion of that financing tied to infrastructure-related new-money issuance, we believe relative valuation metrics will likely remain pressured. Although underlying credit fundamentals remain stable—state and local government revenues registered solid growth rates in 2025 and reserve levels remain well above pre-pandemic norms—the tax-adjusted yield disadvantage for institutional investors persists. As of late 2025, 10-year tax-adjusted spreads for insurers taxed at 21% remain deeply unattractive relative to maturity-matched taxable alternatives. As in 2025, we view these levels as an unattractive entry point for institutional investors as the market moves into another year of heavy seasonal supply4.
Taxable Municipals: A More Constructive Outlook Anchored in Stability and Manageable Supply
Taxable municipal performance in 2025 was challenged early by tariff-related volatility and federal policy uncertainty, particularly around NIH research funding and the imposition of an 8% endowment tax on the wealthiest universities. These developments produced meaningful widening in spreads, with 10-year ‘AAA’ taxable muni spreads increasing from roughly 40 bps at the start of the year to as wide as 74 bps by early April. Since that time, spreads have retraced a substantial portion of the move and, as of this writing, stand near 45 bps5.
Despite the volatility, taxable munis maintained a relatively stable and range-bound spread profile over the balance of the year. ‘AAA’ spreads tightened in a range of 5 to 9 bps across the curve during the third quarter, with the 3-year and 30-year portions of the market performing best. From their mid-April peaks, spreads contracted by 13, 29, and 23 bps in the 5-, 10-, and 30-year maturities, respectively. We view this contraction as indicative of the sector’s defensive attributes, particularly in periods of elevated macro and policy uncertainty6.
Higher education remains a focal point for the taxable sector in 2026. Political scrutiny of private higher-education institutions and cuts or freezes in federal research funding have kept spreads elevated relative to other municipal subsectors. However, we continue to view the strongest universities—those with exceptional demand characteristics, considerable operating flexibility, and substantial balance sheet resources—as fundamentally stable. Institutions have responded to policy-induced funding pressures with hiring freezes, reductions in research spending, and other expense-management initiatives that should help maintain operational stability through 2026. Given this backdrop, we believe that parts of the higher-education subsector remain attractive, particularly where spread differentials relative to similarly rated general obligation credits remain elevated7.
Although headline risk around federal policy is likely to persist into the new year, the sector’s manageable supply outlook should remain supportive of current spread levels. We expect taxable municipal issuance to reach ~$55 billion in 2026—slightly above 2025 levels but still modest relative to historical norms. With fundamentals for the highest-quality issuers stable and spreads near long-term fair-value ranges, we view the taxable municipal market as a favorable taxable alternative to tax-exempt exposure in 20268.
Credit Fundamentals: Stable Entering the New Year Despite Policy-Related Headwinds
State and local government credit fundamentals remain in solid shape heading into 2026. Revenue growth through 2025 has remained resilient—expanding at rates above 5% year-over-year—and total balances across general fund and budget stabilization accounts remain elevated relative to historical norms. These strong reserve positions should provide meaningful insulation should tariff-related pressures or a slowing economic environment materialize in 20269.
Although federal funding uncertainty presents risks for certain subsectors—particularly higher education—we do not view these risks as systemic at this time. Instead, we expect credit bifurcation to persist, with the strongest institutions demonstrating durable financial flexibility while weaker credits face more pronounced budgetary and operating pressures10.
Conclusion
As the industry transitions into 2026, we continue to view the taxable municipal sector as the more attractive option for institutional investors. Favorable technicals, manageable supply expectations, stable fundamentals, and spreads near fair value provide a supportive backdrop for taxable performance. In contrast, the tax-exempt sector faces another year in which valuation levels appear unattractive for insurers, supply technicals are challenged, and policy uncertainty remains elevated.
Given these factors, we maintain a constructive view on taxable municipals while continuing to support reducing exposure to the tax-exempt sector subject to a 21% corporate tax rate.
Exhibit 1
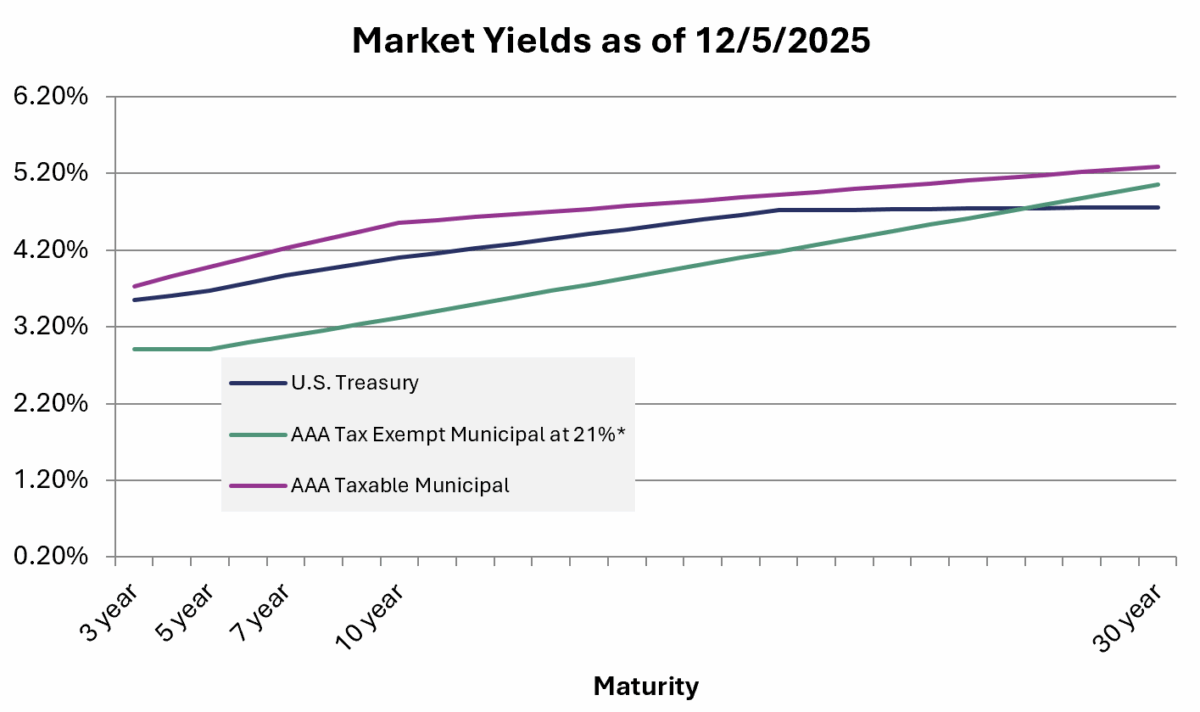
*Tax-exempt rates are tax-adjusted using a factor of 1.19968
Corporate Market Summary
Outside of President Trump’s “Liberation Day Tariffs” announced in April, spread volatility was limited in 2025, with the OAS capped at +85 basis points (bps) through the back half of the year. The OAS effectively ended 2025 about where it began, allowing corporate bond investors to capture roughly 100 bps of excess return, largely from income generation. Looking ahead to 2026, we anticipate a mild widening in spreads and incremental deterioration in corporate fundamentals consistent with a late-credit-cycle environment. Companies are already exhibiting hallmarks of this phase – higher leverage, margin compression, and slowing top-line growth. While technicals should remain constructive, we expect the magnitude of support to moderate relative to 2025. New issue demand remains healthy and should provide opportunities in certain market segments. Our expectation is for the economy to remain resilient, underpinned by consumer and AI-related spending. We expect the OAS of the corporate market to range between 75 and 120 bps during 2026, with an average close to 90 bps. That implies modestly negative excess returns for the sector; therefore, security and sector selection will be important to drive performance in 2026.
Valuation
Corporate spreads are very tight today. As reflected in Exhibit 2, when broken out by sector, spreads are close to five-year minimum levels, well below their averages. There are some exceptions, including Technology and Finance due to sector-related issues. We have seen an explosion of new debt issuance to fund AI-related capital spending in the Technology sector, pressuring spreads. A wider spread in the Financial sector is due to concerns in private credit, specifically related to earnings and asset quality and financial flexibility for BDC/private debt issuers. Our preference is to prioritize sectors with strong fundamentals and higher relative spreads. These subsectors include Autos, Integrated Energy, Pharmaceuticals, and Utilities. Sectors with lower spreads will likely have a harder time outperforming the market. Examples include Diversified Manufacturing and Consumer Products.
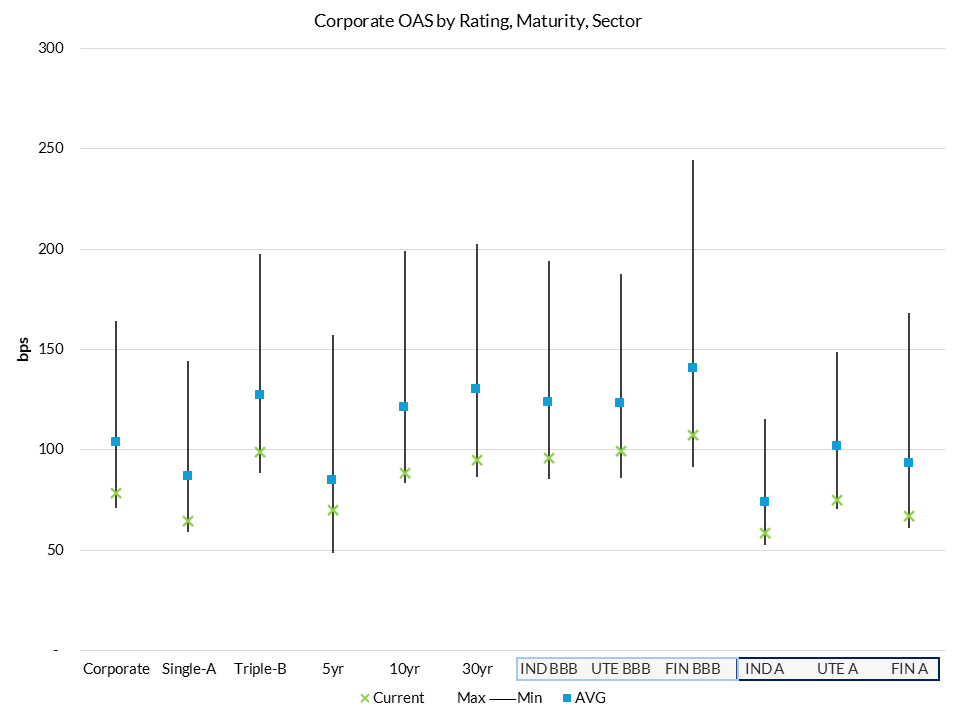
Exhibit 3 highlights the market according to rating, maturity, and broad sector. For single-A-rated bonds, we prefer Utilities given the lower beta nature of the sector and yield advantage. We are agnostic in Triple-B-rated bonds, given the increase in spread versus A-rated bonds is historically low. The risk premium to take more duration (i.e., 10s/30s credit curve) is minimal, as shown by Exhibit 3. This in part supports our caution for longer maturities today, with the expectation that they become more attractive next year. On the front end of the curve, we view the Banking sector as attractive given a supportive economic backdrop and improving technical influences.
Exhibit 2: Sector Relative Value
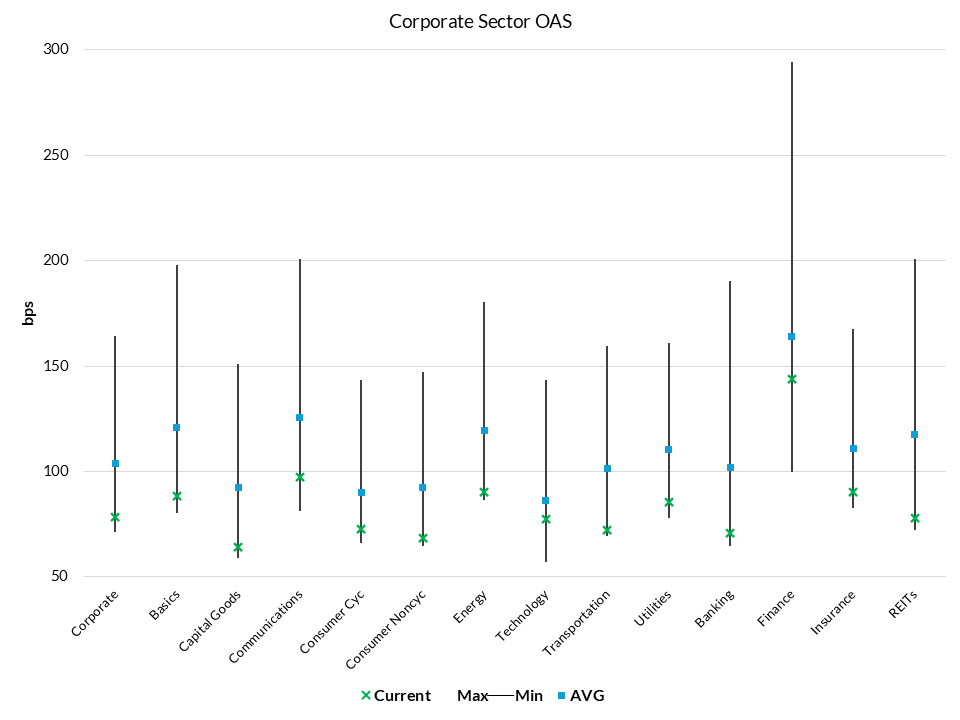
Exhibit 3: Sector Relative Value by Credit Rating
Market Technicals
The technical picture for 2026 remains supportive for corporate spreads. While all-in yields have begun to moderate, they remain attractive on a historical basis. Even with the expectation of rate cuts next year, higher absolute levels should remain appealing for yield-focused investors and continue to anchor demand. On the margin, demand from more total-return-oriented accounts could soften, but overall rate conditions remain supportive. In addition, solid corporate fundamentals continue to provide a solid foundation for the market. We expect 2026 gross issuance of roughly $1.8 trillion, with maturities and coupon income absorbing a significant portion of supply and limiting net issuance to approximately $300 billion11. Incremental supply is likely to be driven by AI-driven infrastructure investment and increased M&A activity, supported by cheaper funding and reduced regulatory barriers. To the extent these deals are financed across the curve, they could create some pressure on long-end spreads and increase sector dispersion. Currently, the 10s30s credit curve is flat at around 10bps, well below its long-term average of roughly 35bps. Against this backdrop, we see the intermediate segment of the curve as offering a more balanced and attractive risk-reward profile, with both carry and rolldown providing support and potential upside. Looking ahead, we expect interest-rate volatility and issuance trends to be the primary drivers of corporate bond spread performance.
Exhibit 4: Performance Expectations by Sector for 2026
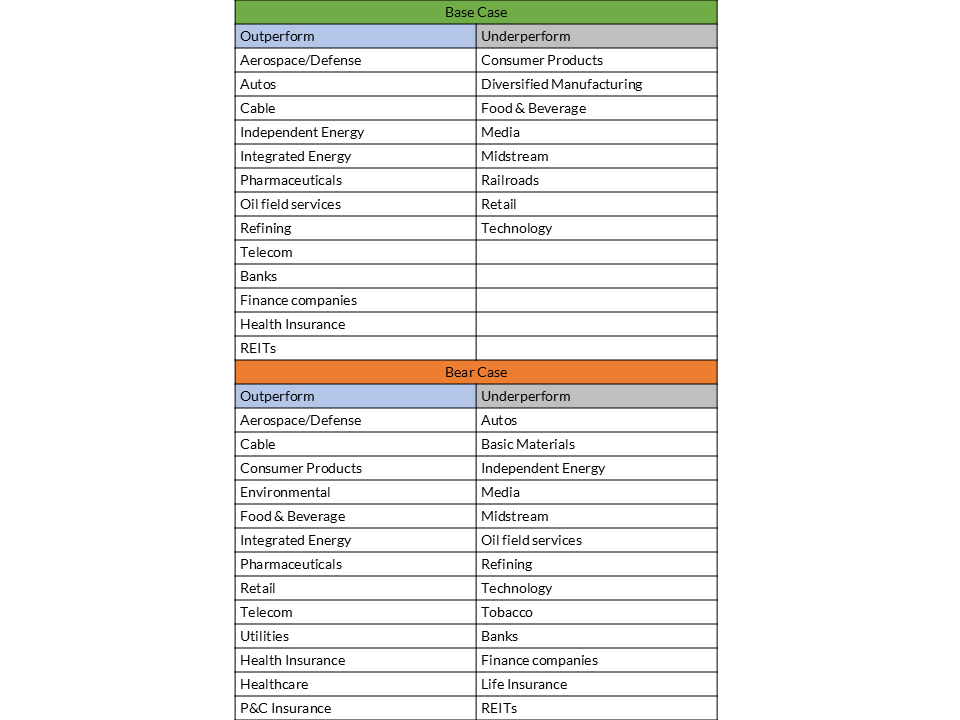
• Base case: GDP growth of approximately 2%, 3 rate cuts in 2026 (25bps each), new issue supply moderately above $1.8T, low recession risk. Inflation remains above the Fed 2% target, and unemployment is higher than the expected 4.5%
• Bear case: Greater concern with inflation leads to higher-than-expected rates and wider spreads, or higher unemployment leads to faster rate cuts and concern about economic growth/ lower GDP
Corporate Sector Outlooks
The following outlines AAM’s fundamental outlook for sectors in the Corporate market. AAM’s 2026 sector outlook highlights a broadly stable but selective environment across major corporate sectors. Basic Materials remain mixed, with metals and mining showing strength, while chemicals face headwinds from excess capacity in China. Capital Goods and Transportation are buoyed by M&A activity and resilient demand, especially in rails and aerospace/defense. Communications and Technology sectors are navigating high idiosyncratic risk, AI-driven capex cycles, and ongoing M&A, with credit profiles pressured by funding needs. Consumer sectors face challenges from slowing spending and tariff impacts, but autos and retail maintain healthy, if cautious, growth. Healthcare fundamentals are solid, though policy uncertainty persists, and energy is expected to weaken slightly amid oversupply. Utilities are stable but face affordability and environmental risks, while Financials—including banks, REITs, and insurers—benefit from supportive macro trends, though regulatory and technical factors drive issuer-level dispersion. Overall, the outlook favors high-quality issuers, disciplined credit selection, and close monitoring of sector-specific risks and opportunities.
Basic Materials
Basic Materials is populated with companies facing a wide range of industry conditions and outlooks. The commonality these companies do share is that, in one way or another, commodity prices are a significant factor. Here again, though, there is not one outlook that can be applied across the commodity spectrum. At the extremes, certain base (copper) and precious metals continue to have a positive outlook, while commodity chemicals continue to face headwinds.
China is always a significant driver when analyzing commodity-exposed industries. The concern has typically been from a demand perspective, but over the past few years, it has increasingly shifted to the supply side. China has overinvested in numerous industries, creating excessive capacity and deflationary pressures. On the demand side, China continues to suffer from weak demand, and we continue to watch for signs of increased stimulus.
Tariffs had little direct impact on the basic materials sector overall, but they were felt in a few prominent areas. Copper, for example, was affected by trade flows that were diverted to the US ahead of higher tariffs. Also, the domestic steel market continues to benefit from protectionist measures. Generally, though, the large international mining companies were relatively unharmed by the tariff disruption.
Paper – The Paper subsector (primarily corrugated containerboard) is somewhat immune to global politics and has a relatively stable outlook. Historically, the paper industry was characterized by rational competitive behavior and disciplined capacity management. The pandemic disrupted this stable environment, and weak demand over the past couple of years led to excess industry capacity. The industry, though, is returning to its historical roots, and the major producers have all announced plant closures. While demand remains soft, we maintain a positive view given ongoing capacity rationalization.
Chemicals – The outlook for chemicals is bifurcated. Commodity petrochemicals like ethylene/polyethylene will remain under pressure from excessive capacity in China and the Middle East. We maintain a negative view on commodity chemicals but recognize that a more positive tone could develop in the coming year if demand improves or “anti-involution” efforts in China are effective at reducing excessive capacity in that country.
Most other areas within chemicals have a more stable to positive outlook. The agricultural cycle appears to be forming a bottom with a gradually improving outlook. While we may see soft demand for fertilizers this winter as farmers pull back, we have a favorable view of the domestic fertilizer producers in the longer term. The remaining segments within the chemical sector (industrial gases, coatings, specialty chemicals) are more stable and should track the course of overall economic growth.
Metals and Mining – Copper prices remain elevated in part due to tariffs, but also from supply disruptions across the globe. We wouldn’t be surprised to see copper prices cool off early in the year, but we maintain a positive view of the metal due to a favorable supply/demand outlook. Most other base and precious metals have a stable to positive outlook. Overall, we have a positive fundamental view of the metals and mining subsector, but tight trading levels provide very few opportunities. M&A is not expected to be overly disruptive but may provide a rare opportunity to buy bonds at more attractive levels.
Capital Goods and Transportation
Rails – The idea that cross-continental M&A could not happen was challenged in 2025 with the announcement of Union Pacific looking to buy Norfolk Southern. This is the biggest development for the industry in years. If approved, we would expect more mergers and a fundamentally stronger, more concentrated Class 1 rail industry. Rails remain a defensive sector with growth in line with overall GDP growth and diversification across many end markets. Capital spending is expected to remain high, and we expect strength in bulk shipping versus intermodal shipping of goods, which has been affected by lower import/exports. The sector continues to have pricing power given efficiency advantages over the much larger trucking industry. We expect low single-digit revenue growth in 2026.
Aerospace/Defense – We expect that the defense spending backdrop under the Trump Administration will continue to be positive for the major US defense contractors despite overall spending cuts. President Trump has historically supported the modernization of the U.S. military, and we continue to experience global tensions, which helps support growth, particularly of domestic products into foreign countries. In addition, growth in commercial aircraft orders/demand should remain strong globally, especially in emerging markets. We have seen fundamentals for Boeing stabilize, which helps support the sector as a whole. We expect high single-digit revenue growth and low double-digit EBITDA growth in this sector. We expect cash flow to be strong and credit measures to remain solid.
Diversified Manufacturing – Major economic indicators continue to show sluggish U.S. industrial demand. We believe final demand (i.e., consumer) will need to pick up for this sector to begin to show expansionary characteristics. A less restrictive interest rate and added growth from mega-sized, regulatory-driven infrastructure projects would help fuel longer-term growth. This includes data center buildouts, expected to benefit manufacturers involved with power generation. We expect continued M&A and equity-driven asset-sales/spin-offs, which we would view as marginally credit-negative events. We expect top-and bottom-line growth in the low-single digits, likely closer to zero.
Communications and Technology
Cable and Media – Idiosyncratic risk remains high in this sector, and we anticipate continued fireworks in Media in 2026. While we await the winning bidder for the Warner Brothers assets, we expect a domino effect of additional merger announcements as companies deal with secular challenges like streaming, technology convergence, and AI. With Meta accounting for close to 50% of this sector’s market value in the debt market, performance will be heavily influenced by Meta’s strategic shift toward massive AI investments and increasing funding needs. Meta defining a path towards monetization or maintaining spending discipline will help alleviate investor concerns. We anticipate continued downgrades to high yield, with Televisa and Paramount already split-rated. We expect Disney to remain quiet, while Netflix would need to issue a large debt deal to fund the assets it seeks to acquire from Warner Brothers, resulting in spread widening in that credit and providing a potential opportunity.
Telecommunications – Spreads slightly underperformed other ‘BBB’ rated companies, as new debt issuance from domestic telecom companies increased to fund acquisitions due to secular challenges. Wireless and cable convergence simply results in too many competitors, and we expect this M&A to continue. European operators were early to experience this and may finally have the financial flexibility to pursue strategic options, although their regulatory environment remains challenging. Canadian companies, after recent investments, need to deleverage to retain their credit ratings. They are finally expected to benefit from an improving wireless environment in 2026 after destructive competition.
Technology – We start the year with a more cautious view, given the expectation for higher supply. We expect the new issuance in the sector, and the evolving perceptions of AI will create trading opportunities throughout the year.
The AI narrative has pivoted from adoption euphoria to a show-me era of monetization, set against the backdrop of a historic capex supercycle. While the “pick-and-shovel” ecosystem benefits from another year of aggressive hyperscaler spending, the credit story is increasingly defined by funding strain and a complex web of financial entanglements, including off-balance-sheet structures, rather than by revenue growth alone. Despite strong top-line projections, the sheer intensity of AI infrastructure build-outs combined with shareholder remuneration is compressing free cash flow profiles, especially for Oracle and Meta.
With the return on investment (ROI) for AI still likely 12–24 months out, the sector faces a “funding gap” that will drive significant net supply growth. We expect this technical headwind to continue to pressure spreads wider as the market digests the sheer volume of new debt. We also anticipate M&A to accelerate, driven less by scale and more by the need to secure talent. This will likely trigger a cycle of re-leveraging as balance sheets are deployed to fund both acquisitions and capex. Finally, geopolitical friction has moved from a tail risk into a structural cost; export controls and duplication of supply chains away from China are elevating the capital intensity of the hardware sector.
Consumer
Food/Beverage – This sector will be challenged to grow revenues given the slowing consumer spending (low and middle-income groups). Trends for the sector include “trade down” to lower cost categories and spending on food-at-home versus eating at restaurants. We expect costs to increase (tariffs, marketing/advertising), including capital spent on product innovation. Continued economic uncertainty makes it more difficult for companies to pass on these higher costs. At the margin, political influences (“Making America Healthy Again”) and lower demand from the popularity of GLP-1 drug usage complicate the demand profile. We expect companies to pursue mid-to-large-sized M&A transactions, supported by lower interest rates, to add exposure to higher-growth areas. We also expect more equity-friendly transactions, including asset spin-offs or sales. Beverage companies typically have better brand positioning, more favorable cost structures, and better geographic diversification. We anticipate low-single-digit top-line growth and mid-single-digit earnings growth.
Retail – Our view is that, while consumers generally remain in good shape, spending is trending lower towards a more normal range. With potential softness in the job market, we view risks skewed to the downside. Shoppers remain focused on value. Trading down and fewer “big-ticket” purchases remain ongoing themes. Higher-income shoppers continue to anchor U.S. consumer spending, reflecting their outsized share of total consumption. In general, inventory levels reflect conservative outlooks from retail management teams. Retailers perceived as offering the most value have been the most successful. Higher costs from tariffs are expected to begin to materialize in prices in the first half of 2026. Retailers’ ability to raise prices will be dependent on the strength of the consumer. We expect top and bottom-line growth in the low-single-digit area.
Autos – While the auto industry continues to face some crosscurrents, it enters 2026 with fewer uncertainties than a year ago. Last year, after years of lean inventories and a strong pricing environment, higher incentives and inventory levels raised concerns about a repeat of past cycles. Adding in the extreme tariff volatility early in the year, it appeared that 2025 may ultimately be a very challenging year for the auto industry. The pull-forward of demand due to tariffs and the elimination of the EV tax credit created expectations of softer demand later in the year. Ultimately, demand proved to be more resilient than expected, with sales holding up relatively well.
With one month to go in 2025, U.S. auto sales are tracking to be around 16.1 million vehicles for the year. At the beginning of the year, we had expected sales to be towards the middle of the 15.5-16.0 million range. Looking forward to 2026, we again expect auto sales to be in the high 15 million range. While this would represent a decline from this year’s surprisingly strong sales, we still consider it a healthy level.
Although tariffs were the primary story in 2025, a hypercompetitive Chinese market and a soft European market continued to weigh on the industry. This is particularly true for European manufacturers (OEMs), who have significant exposure to both markets. China has invested heavily in battery and EV capacity and continues to deal with excessive capacity. In most cases, new energy vehicles (including battery and hybrid electric vehicles) are now cheaper than traditional combustion engine vehicles and come with features increasingly attractive to Chinese consumers. While China remains a challenging market, there is hope that signs of stabilization will emerge for the European OEMs in 2026. Initially caught off guard by the rising competitiveness of Chinese manufacturers, these legacy OEMs are now responding by increasingly adopting a made “in China for China” strategic shift. Also called “local-for-local”, the hope is that the Chinese consumer will be more receptive to these new vehicles than the legacy products that have fallen out of favor.
Domestically, the primary concern heading into 2026 is affordability and the emerging stress on consumers, particularly at lower-income levels. The auto sector is highly sensitive to macroeconomic factors and interest rates, as most vehicle purchases rely on financing. While auto sales have been resilient this year, there are concerns of weaker sales going forward as tariffs continue to put upward pressure on vehicle pricing. Lower rates should provide a tailwind in support of an auto industry increasingly concerned about a weakening consumer.
With an eye on affordability, we have a generally positive view of the auto industry heading into 2026. Tariffs will continue to weigh on margins, but assuming the tariff situation remains stable and somewhat predictable, manufacturers should embark on a path back to historical margin levels. Relaxed emissions standards and reduced capital committed to EVs should provide additional tailwinds for US-based manufacturers. As long as the economy remains buoyant and tariffs are not overly disruptive, demand should be sufficient to maintain solid credit profiles.
Healthcare
Pharmaceuticals – Given the focus on consumer healthcare costs (drug prices), we assume this sector will remain in the headlines, especially considering the new political appointments. So far, the sector has responded to political threats positively with a willingness to lower prices and build infrastructure in the U.S. Fundamentals for the sector are solid with strong cash flow and high EBITDA margins. The growing use of medicines to treat medical conditions and a currently supportive environment for drug discovery are fundamentally supportive in the long term. We have seen a lot of M&A in the drug and medical device areas in 2025, and we believe this will continue. Generally, even large-scale transactions have little to no impact on credit ratings given strong liquidity and improved proforma business risk. We expect high single-digit revenue growth and double-digit bottom-line growth.
Health Insurers – Cost trends in 2025 were worse than anticipated, with deferred care returning to higher acuity levels. Elevated utilization levels are expected to continue in 2026, however the outlook is improving as insurers adjust pricing based on these cost trends. Profit margins are set to improve next year. Health insurers getting back to target margins for Medicare and Medicaid segments will extend into next year and 2027. In Medicare Advantage, insurers reduced benefits, while with Medicaid, insurers are renegotiating with states to reflect a higher-risk pool. There is some potential for positive developments in the outlook, mainly due to policies and rate actions that support Medicare Advantage; however, we believe it will take time for any legislative changes or rate adjustments to improve profitability significantly. While we are cautious about our outlook amid policy and regulatory uncertainty, given underperformance in 2025, spreads remain historically wide relative to other corporate sectors. We see opportunities for outperformance, with an emphasis on credit selection. After a better year with labor costs under control, Providers also face an uncertain outlook, more so on the policy front. If cuts to Medicaid, the expiration of ACA-enhanced subsidies, or a weakening labor market lead to a higher uninsured rate, this could reduce utilization and reimbursement levels, hurting balance sheets. We expect Labs and Distributors to continue to focus on inorganic growth, resulting in higher leverage. The upside is limited given its richer valuations relative to the rest of the sector.
Energy
We expect fundamentals in the Energy sector in 2026 to weaken slightly relative to 2025, largely due to a saturated crude oil environment whereby supply exceeds demand by 1-2 million barrels per day. Oil prices are expected to remain below $60 per barrel, while gasoline and diesel are expected to be in the low-to-mid $3 per gallon range. We expect healthy natural gas prices to average close to $4 per thousand cubic feet, which should partially offset the weak conditions for oil and refined products. Liquefied natural gas export growth of almost 4 billion cubic feet per day (25% YOY) is expected to support the healthy natural gas fundamentals.
At the corporate level, we expect free cash flow discipline to remain strong, which implies capital spending by the Independents, Integrateds and Oil Field Services will decline in mid-single digits due to weaker oil prices. We suspect that capital spending by the Midstream will increase as part of the domestic infrastructure buildout, and refiners probably will spend at levels similar to this year. While we expect companies to maintain healthy balance sheets, should equity valuations decline with the price of oil, M&A would likely accelerate from an already robust level.
Valuations for the Energy sector are Fair, but given our views on fundamentals, our bias is to higher quality components of the Energy complex. Within the sector, Integrateds, the highest-quality Energy subsector offer the best value relative to other Industrial companies. Midstream, the largest subsector within Energy, offers the least value relative to Industrials and is quickly approaching unattractive levels. These conditions are very similar to where we ended 2024.
Utilities
The dominant themes from the past few years remain in place: high capital spending leading to high debt issuance and consistent pressure on credit metrics. Issuance is expected to stay elevated in 2025, and balance sheets will remain under pressure. The industry’s growth narrative has changed with the proliferation of AI, and the related data center growth continues to present both opportunities and challenges for the industry. The EIA projects US electricity consumption to increase 2.2% in 2025 and 1.6% in 2026. While this might not sound like much, this is significant for an industry that saw essentially no growth for the 15 years before the AI boom. It is also worth noting that this load growth is not uniform across the country. The EIA projects demand in the ERCOT (Texas) region to grow by 9.6% in 2026.
After requiring more attention in 2025, we consider affordability to be the most prominent theme heading into 2026. Rising monthly utility bills have caught voters’ attention and are increasingly on the minds of political leaders and regulators. This topic is particularly relevant heading into an election year with 36 gubernatorial elections. According to CPI data released by the Bureau of Labor Statistics, the index for electricity prices increased 5.1% over the 12-month period ending in September 2025. This compares to a 3.0% increase for the all-items index. This continues a trend of relatively high inflation over the past few years. While multiple factors have contributed to this trend, data center load growth has emerged as the most salient culprit. We are seeing pushback across the nation, with many regulatory entities scrutinizing data center deals and imposing guardrails on their development to shield residential consumers. Despite this increased scrutiny, we expect the regulatory environment to remain constructive as regulators and political leaders continue to support the development of AI. That said, utility companies and data center developers need to be aware of the heightened sensitivity to electricity prices and structure projects accordingly.
With affordability garnering much attention in the utility industry, it is worth noting that environmental risks, particularly wildfires, remain a significant concern. A year ago, investors were observing the end of a relatively quiet fire season, and spreads of issuers with wildfire risk had reached very tight levels. This was just before the Los Angeles fires shocked the industry, which occurred at a time not considered within the traditional wildfire season. The state of California has taken aggressive action to address the risk, but the events served as a reminder that wildfires and other environmental risks remain unpredictable.
tility companies have a variety of levers to pull to address pressure on credit metrics and continue to explore alternatives to debt financing. Utility stock prices performed well for most of 2025 before weakening into year-end. Although it is never popular with shareholders, equity issuance will continue to be necessary, and the attractiveness of this option will depend on the eventual course of public equity prices. Hybrids increased in popularity over the past two years, and we should continue to see elevated issuance in 2026. Also, asset sales (both minority and whole) are options that remain on the table. Finally, companies have raised the possibility of accessing the burgeoning private credit market, potentially at the project level.
The utility industry is always a balancing act between the often-competing objectives of growth, reliability, and affordability. Despite the challenges posed by this balancing act, we maintain a stable outlook for the industry and consider it a defensive sector offering decent value.
Financials
We expect a broadly supportive macro environment for U.S. banks in 2026, characterized by steady economic growth, lower policy rates, and improving clarity around monetary and regulatory policy. Entering the year, prior rate cuts should continue to ease funding costs and support earnings stability, while greater confidence in the policy outlook underpins a gradual recovery in loan growth. Net interest margins have likely peaked, as declining short-term rates offset the benefits of lower deposit costs and higher-yielding fixed-rate assets; however, a rebound in loan growth, capital markets activity, and M&A volumes should provide meaningful revenue offsets. Persistently elevated long-term rates remain a key risk, particularly for asset quality in commercial real estate (CRE). While most U.S. banks have reduced CRE exposure and built reserves, smaller regional and community banks remain more vulnerable due to higher concentration and limited capital flexibility. Large U.S. banks also maintain material exposure to nonbank financial institutions (NBFIs), including private credit, primarily through secured financing; while this introduces late-cycle headline risk and episodic volatility, underlying credit risk appears manageable given balance-sheet scale and diversification.
Against this backdrop, regulatory dynamics remain a key swing factor for U.S. banks in 2026, with capital ratios likely past cyclical peaks, particularly for U.S. Global Systemically Important Banks (G-SIBs). Recent and proposed reforms, including recalibration of the Supplementary Leverage Ratio (SLR) and potential adjustments to stress-testing assumptions, are intended to reduce binding leverage constraints and unwind excess common equity Tier 1 (CET1) buffers accumulated over recent years. While the final calibration of Basel III Endgame remains unresolved, expectations have shifted toward a materially lower capital impact than earlier proposals, limiting incremental pressure on risk-weighted assets (RWA), Total Loss-Absorbing Capacity (TLAC), and long-term debt issuance. As regulatory uncertainty fades, improved visibility into capital requirements should enhance balance-sheet flexibility, supporting higher capital returns, more active balance-sheet optimization, and a renewed pickup in bank M&A, particularly among regional banks pursuing scale, efficiency gains, and geographic diversification without materially eroding regulatory capital buffers.
From a funding and technical perspective, U.S. bank issuance is expected to remain broadly stable in 2026, with modest growth in gross issuance but a decline in net supply. G-SIB issuance should increase modestly, reflecting a heavier maturity and call calendar, though excess regulatory debt capacity allows for selective refinancing rather than full replacement. Stable markets and lower interest-rate volatility could support higher gross issuance to fund client activity, while regulatory relief, particularly lower TLAC and leverage requirements, should constrain structural funding needs. Regional bank issuance is expected to be broadly in line with 2025, driven primarily by maturities, with improving capital flexibility and potential RWA growth offset by the absence of binding long-term debt requirements. Overall, the technical backdrop points to lighter net supply and a supportive environment for U.S. bank credit in 2026.
Yankee banks enter 2026 with broadly sound fundamentals, supported by strong capitalization, resilient asset quality, and diversified earnings profiles. While lower policy rates will pressure net interest margins, earnings power remains solid, with fee income, capital markets activity, and cost discipline offsetting margin compression. Asset quality across major European, UK, Canadian, and Asian banks is expected to remain stable, with the cost of risk low by historical standards and limited signs of late-cycle stress. Key risks are exogenous rather than balance-sheet driven. Political and sovereign uncertainty, particularly in France and the UK, is likely to remain a primary sentiment driver, even as direct sovereign exposure is manageable, and capital buffers remain high. Regulatory developments and banks’ growing interaction with private credit and NBFIs warrant monitoring but are expected to create headline-driven volatility rather than fundamental deterioration, reinforcing issuer- and country-level dispersion.
From a technical perspective, 2026 Yankee bank supply is expected to be supportive, with lower overall issuance versus 2025 and a continued shift toward senior non-preferred and holding company funding, reducing pressure from operating-company senior and hybrid supply. Liquidity and funding profiles remain strong globally, underpinned by stabilizing deposit bases and conservative balance-sheet management.
REITs enter 2026 with fundamentals broadly stable and balance sheets in solid shape, supported by conservative leverage, ample liquidity, and covenant protection. Credit metrics have stabilized and, in many cases, improved modestly following a period of rate-driven pressure, as issuers slowed development, prioritized refinancing over growth, and used asset sales and retained cash to support balance sheets. REIT issuance is expected to increase by approximately 17% year over year, rising to roughly $50 billion, driven primarily by a heavier maturity calendar rather than incremental expansion. Despite higher supply, market access remains open, with funding conditions increasingly shaped by issuer quality, asset mix, and balance-sheet flexibility.
At the sector level, industrial and data center REITs continue to benefit from durable tenant demand tied to domestic manufacturing, logistics, and AI-related infrastructure, even as absorption moderates from prior highs. Rental housing fundamentals are normalizing: multifamily rents are growing more slowly as supply works through the system, while single-family rents remain supported by limited new construction. Retail REITs, particularly grocery-anchored and outlet formats, continue to show healthy leasing trends and stable occupancy. Net lease REITs maintain predictable cash flows, with credit outcomes increasingly influenced by tenant concentration and asset quality. Healthcare REITs are gradually strengthening following balance-sheet actions and improved operating conditions. Office REITs, including life science portfolios, remain the most pressured segment, but conditions are diverging: traditional office appears closer to stabilization, supported by improving tenant activity and sharply reduced new supply, while life science remains more challenged as elevated lab availability and slower tenant demand extend the recovery timeline.
Insurance – While the Fed continues the rate-cutting cycle, new money yields remain above book yields, creating a tailwind for investment income, though the sector faces a tougher year with increased volatility. For life insurers, we expect performance to be differentiated by capital strength and business mix. Although spread-based earnings may compress as peak rates pass, sales of fixed and spread-based products should maintain strong momentum. Group benefits remain a bright spot, with strong margins and favorable opportunities continuing into 2026. We expect block deal momentum to persist, particularly given the increased potential for risk-transfer transactions in the long-term care (LTC) space. While concerns remain regarding CRE office, another issue for the sector is exposure to private credit within investment portfolios. We expect increased transparency to ease investor worries. Aside from private credit, we anticipate the sector will perform well in 2026, backed by strong capital positions and a supportive macro environment.
P&C Insurance faces a softening market in 2026, with pricing pressure expected to weigh on margins. We expect investment income to grow as investment balances rise and new money yields continue to exceed book yields. Commercial insurers are seeing pricing soften in property, particularly for large-account writers, where price is below loss trend, while small- and mid-market accounts are holding up closer to trend. The risk environment remains elevated with social inflation, but we expect underwriters to maintain discipline. With the market softening and companies sitting on excess capital, we anticipate a pick-up in M&A activity in 2026. Next year, personal insurers will shift further towards competition; with auto rate-taking largely behind us, carriers are now pivoting to growth, driving increased competition for market share. Homeowners’ pricing remains historically high and is expected to moderate next year. The sector remains sensitive to weather-related losses and catastrophe claims.
BDC performance in 2026 is expected to be shaped by dispersion rather than broad-based deterioration. Asset quality should soften modestly as portfolios season and competitive pressures persist, but outcomes are likely to vary widely across issuers. Subscale BDCs face greater downside risk, reflecting weaker diversification, sponsor access, and workout capabilities, which heighten sensitivity to incremental credit stress and valuation volatility. In contrast, scaled platforms with diversified portfolios, disciplined underwriting, and deeper restructuring resources are better positioned to absorb normalization without material balance-sheet strain.
Earnings quality is a key fault line, reinforcing this dispersion. Lower base rates and tighter spreads are expected to compress net investment income further, while PIK income remains elevated, sustaining pressure on cash earnings and dividend coverage. As a result, dividend policy is likely to become a more active lever, with dividend cuts increasingly probable, particularly among smaller or weakly positioned BDCs. While proactive reductions should be credit-positive by preserving liquidity and limiting leverage creep, they may also dampen equity investor demand and increase redemption risk at perpetual BDCs. Against this backdrop, many BDCs are likely to remain active debt issuers in 2026 to refinance maturities and support growth if M&A activity improves, elevating execution risk during periods of spread volatility. Scaled platforms with diversified funding access are best positioned to manage these pressures, reinforcing the case for a selective, issuer-by-issuer credit approach focused on scale, earnings quality, PIK discipline, funding flexibility, and sustainable dividend alignment.
Aircraft Lessors – The aircraft shortage that has defined Aircraft Lessor fundamentals for the past few years is set to continue into 2026. Boeing and Airbus have not made sufficient production progress to meaningfully change the sector’s performance drivers. We expect profitability to continue to improve as leases negotiated during this period of stronger pricing power come online. Many of the established players are now operating at their target leverage and will likely return free cash flow to shareholders. In Aircraft Leasing, scale matters, and the constraints on aircraft supply may continue to motivate companies to make their own strategic acquisitions to gain scale.
Structured Products 2026 Outlook
Structured Product securities have performed quite well relative to Treasuries and other fixed income risk sectors in 2025. Agency mortgage backed securities are the best performing sector, outdistancing ABS and CMBS as well as corporate bonds and taxable municipals year to date. Spreads within the structured product sub-sectors now reflect longer term value and are not nearly as attractive as they were entering 2025. Looking to 2026, we remain constructive on all the sub-sectors but have much more muted return expectations as compared to last year.
Agency MBS
Our interest rate outlook at AAM envisions only modest declines in market interest rates over the course of 2026. Range bond interest rates restrains volatility which provides the perfect back drop that supports mortgage valuations. We expect prepayment volatility to remain low, limiting any prepayment shocks and allowing mortgage securities to earn their yield advantage over other fixed income sectors.
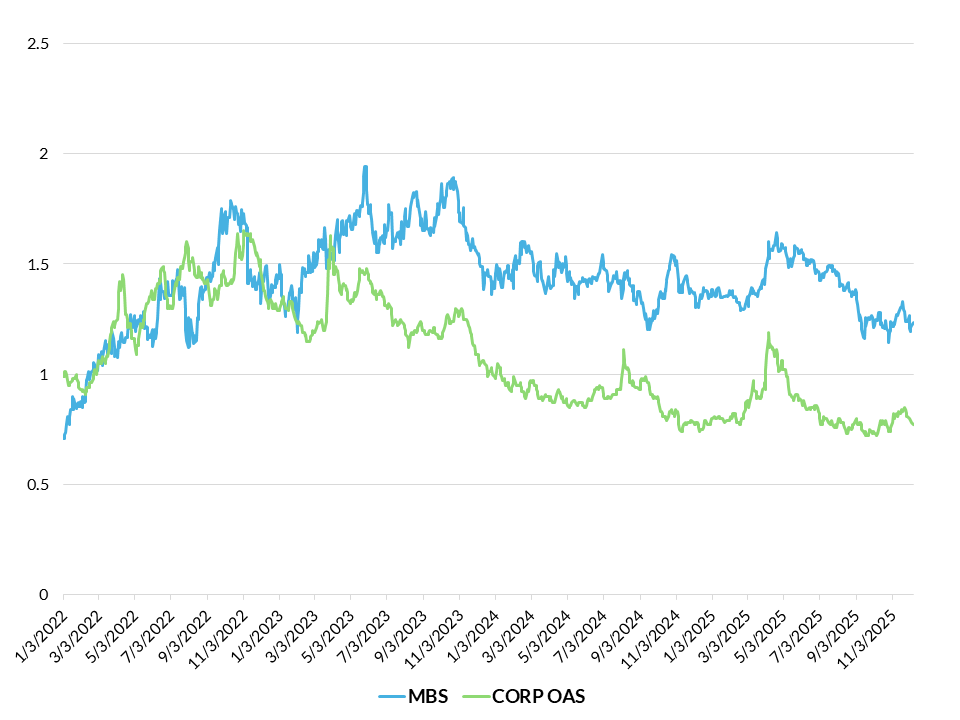
Exhibit 5 below reflects the yield spread between agency mortgages and corporate bonds. Agency MBS have a yield advantage that narrowed over the course of 2025. We view the relationship as being more in line with longer term averages and therefore expect only a modest amount of spread tightening from their current level of 123bp over intermediate Treasuries. One key risk to our view is in the event the corporate bond market experiences any material spread widening due to geopolitical events or deteriorating credit conditions, agency MBS could see similar spread widening, hurting returns.
Exhibit 5: Current Coupon OAS vs Corporate OAS
The technical environment will be more challenging in 2026 as the net supply of new mortgages is forecast to be as high as $200B12. When factoring in organic growth as well as nearly $200B in runoff from the Federal Reserve’s portfolio13, this represents a substantial increase in supply for the market to digest. We anticipate increased demand from Insurance companies, money managers and commercial banks to absorb the supply but also believe we could get some help from the GSEs. Political pressure to help lower market mortgage rates could encourage the agencies to purchase agency MBS expanding their balance sheets which would certainly be supportive of security returns.
Security selection within the sector continues to be of vital importance. Targeting mortgage pools with certain characteristics that have better prepayment profiles can enhance yield and generate greater excess returns. Avoiding generic, TBA securities limits your exposure to unforeseen prepayment fluctuations from increased interest volatility.
ABS
The ABS sector experienced rather lackluster performance as a whole in 2025. More generic auto and credit card securities saw spreads hold steady to widen slightly while more esoteric sub-sectors produced higher returns simply based upon their higher yields and short duration. There were pockets of underperformance however as some sub-sectors experienced deteriorating credit fundamentals particularly with less established subprime auto issuers and solar energy securitizations.
We anticipate spreads tightening in most ABS sectors in the coming year. Current spreads remain wide to corporate bonds and taxable municipals making for favorable relative value comparisons. From a credit perspective, tighter underwriting standards and expected increases in disposable income should hold consumer delinquency statistics within historical norms.
ABS remain a key component of our overall investment strategy. They provide high credit quality and stable cashflows with yields that are often higher than other short duration alternatives. We continue to favor higher yielding, off the run sectors such as equipment, aircraft and better capitalized mid-prime auto issuers. We have avoided data center securitizations in the ABS and CMBS markets. Multi-tenant deals lacking strong sponsorship and uncertain lease commitments have made us uncomfortable with the credit profile of the securities. We prefer to gain exposure to data centers through the highly rated, large hyperscalers within the corporate bond market.
Exhibit 6: Data center related financings

CMBS
Maturing loans unable to be refinanced, defaulted properties leading to large losses for investors, CMBS investors faced many challenges in 2025. Yet despite these challenges, CMBS have performed very well, generating excess return similar to corporate bonds over the course of the year. We expect CMBS to generate positive excess returns in 2026 as spreads tighten from current levels. Evaluating refinancing risk in both conduit loans and particularly in single asset single borrower (SASB) transactions will be critical in 2026.
Through the first 10 months of the year only 73% of conduit loans have successfully refinanced at maturity14. The office sector in particular has really struggled to attract fresh capital as only 49% of those loans have refinanced15. The root cause of the issue is that market loan rates exceed the average rate on maturing loans by 163bp16. While down from 230bp at the end of 2024, the net operating income of many properties is not sufficient to support higher interest rates. Unfortunately given our interest rate forecast for 2026, borrowers cannot expect declining Treasury yields to materially lower loan rates.
Successful investing in 2026 will require targeting those securitizations where the underlying collateral has low loan to value ratios and strong operating metrics where property cash flows are sufficient to carry the higher interest burden. We have been targeting conduit transactions with a broadly diversified base of properties where no single sector, multifamily, office or large anchored retail dominates the collateral pool. In addition we prefer those securitizations where the size of the underlying loans is predominately in the $20-25mm range, as those loans have demonstrated a history of successfully refinancing at a high rate. One recent development in the CMBS market has been a shift toward 5-year maturities rather than 10-year maturities at issuance as has been the norm. With yield spreads similar to the longer 10-year maturities, the shorter maturities provide very competitive yields compared to other fixed income alternatives with less duration and spread risk.
Monitoring older securitization where loans remain outstanding well past their expected maturity date remains a challenge. This has been particularly notable in the SASB market. Successful refinancing may require borrowers to invest additional equity capital however many borrowers lack the financial resources to do so. Fortunately many lenders have been reluctant to foreclose and liquidate properties allowing borrowers to wait for better market conditions and saving investors from incurring large losses. We continue to look to high quality properties, operated by well capitalized sponsors has having the best likelihood of a successful outcome.
CLOs
We expect CLOs to experience a number of headwinds in 2026, resulting in wider spreads and lower nominal returns compared to other short duration, fixed income securities. The most immediate challenge to the sector has been the easing program the Fed began at the end of 2024. As the Fed cuts rates, the variable rate CLOs pay declines such that they no longer provide the income advantage over other alternatives. Given our outlook for another 2 to 3 cuts by the Fed in 2026, CLOs will struggle to generate sufficient yield to outperform other fixed rate options.
Another potential issue for the sector is the potential for a record level of new supply coming to market. New issuance of CLOs is expected to be $150b, which is actually $30B lower than 2024, however there are $422B of CLOs issued in 2024 that will become eligible to be called next year17. Those two factors could cause gross supply to exceed $500B which would be an all-time high. In an environment of declining interest rates, there may not be sufficient demand to absorb such heavy new issuance. As investors look for more attractive options, we expect the most senior, Aaa rated tranches of CLOs to widen 10bp to 15bp and in some circumstances potentially even more. We believe it best to look elsewhere until more clarity is known about potential supply and the terminal funds rate from the Fed.
1 Bond Buyer, BofA, Bloomberg, Barclays, Refinitiv
2 Bond Buyer, Bloomberg
3 Lipper, Bloomberg, Refinitiv
4 NASBO, BEA, AAM, Bloomberg
5 Bond Buyer, AAM, Bloomberg
6 Bond Buyer, AAM, Bloomberg
7 Bond Buyer, AAM, Bloomberg
8 JPM, Barclays, Bond Buyer, AAM, Bloomberg
9 JPM, Barclays, Bond Buyer, AAM, Bloomberg
10 AAM
11 JPM
12 Robert W. Baird & Co.
13 Robert W. Baird & Co.
14 BankAmerica
15 BankAmerica
16 JP Morgan
Disclaimer: Asset Allocation & Management Company, LLC (AAM) is an investment adviser registered with the Securities and Exchange Commission, specializing in fixed-income asset management services for insurance companies. Registration does not imply a certain level of skill or training. This information was developed using publicly available information, internally developed data and outside sources believed to be reliable. While all reasonable care has been taken to ensure that the facts stated and the opinions given are accurate, complete and reasonable, liability is expressly disclaimed by AAM and any affiliates (collectively known as “AAM”), and their representative officers and employees. This report has been prepared for informational purposes only and does not purport to represent a complete analysis of any security, company or industry discussed. Any opinions and/or recommendations expressed are subject to change without notice and should be considered only as part of a diversified portfolio. Any opinions and statements contained herein of financial market trends based on market conditions constitute our judgment. This material may contain projections or other forward-looking statements regarding future events, targets or expectations, and is only current as of the date indicated. There is no assurance that such events or targets will be achieved, and may be significantly different than that discussed here. The information presented, including any statements concerning financial market trends, is based on current market conditions, which will fluctuate and may be superseded by subsequent market events or for other reasons. Although the assumptions underlying the forward-looking statements that may be contained herein are believed to be reasonable they can be affected by inaccurate assumptions or by known or unknown risks and uncertainties. AAM assumes no duty to provide updates to any analysis contained herein. A complete list of investment recommendations made during the past year is available upon request. Past performance is not an indication of future returns. This information is distributed to recipients including AAM, any of which may have acted on the basis of the information, or may have an ownership interest in securities to which the information relates. It may also be distributed to clients of AAM, as well as to other recipients with whom no such client relationship exists. Providing this information does not, in and of itself, constitute a recommendation by AAM, nor does it imply that the purchase or sale of any security is suitable for the recipient. Investing in the bond market is subject to certain risks including market, interest-rate, issuer, credit, inflation, liquidity, valuation, volatility, prepayment and extension. No part of this material may be reproduced in any form, or referred to in any other publication, without express written permission.