The Rolling Stones released “Jumpin Jack Flash” in 1968. It might as well be the theme song for the natural gas market in 2024. Mick belting out that “I was drowned, I was washed up and left for dead” probably rang true to many natural gas producers, particularly those in West Texas, where the average price for the commodity year to date is 95% below the five-year average at $0.20 per million British thermal units1. However, after learning of the incredible amount of expected data center-related electric demand, those same producers, are all singing “But it’s all right now, in fact it’s a gas! But it’s all right, I’m Jumpin’ Jack Flash!”
Below we dovetail our outlook for natural gas demand with the recent conversation AAM’s utility analyst, Andy Bohlin, had on our podcast, The Portfolio Fix. We detail how natural gas is currently used, the impact data center-related electric demand is likely to have on total natural gas consumption and the items that are likely to influence the pace of growth over the next several years.
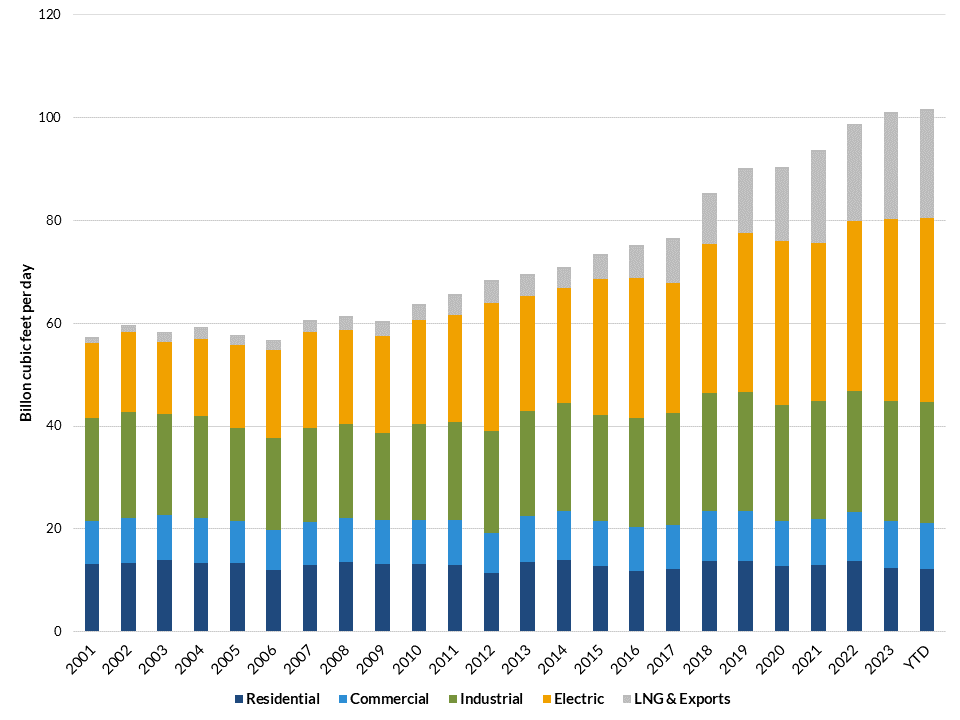
Natural gas demand is classified under five categories by the U.S. Energy Information Administration – Residential, Commercial, Industrial, Electric and Exports. Since 2001, annual demand has on average increased 2.6% per year, but this rate has increased in recent years due to electric use (coal to natural gas switching) and liquefied natural gas (LNG) exports (Figure 1). Average annual consumption and exports are now above 100 billion cubic feet per day.
As recently as 12 months ago, many pundits believed nearly all the consumption growth over the next 5 years would come from increased LNG exports and industrial uses (onshoring), while demand from the electric sector would decline. The rationale for the reduced electric-related demand was renewables like wind and solar would take market share from natural gas. Those assumptions have changed.
Figure 1: Annual Domestic Natural Gas Consumption by Sector

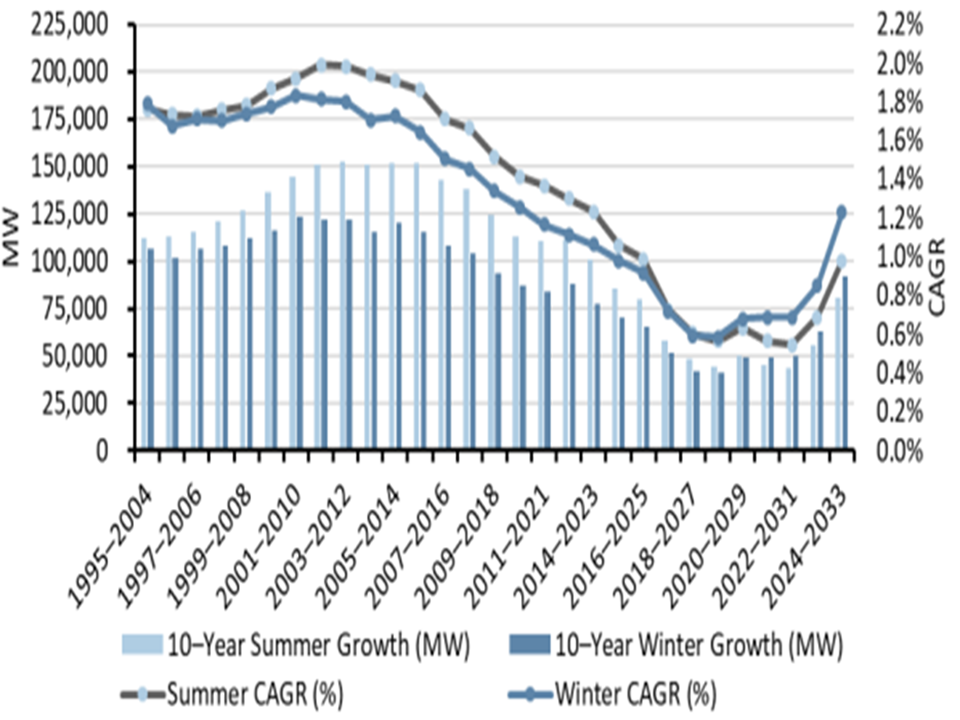
As Andy indicated in the podcast, data center-related electric demand is expected to increase from 17 gigawatt hours to over 51 gigawatt hours by 2030 – a 17% compounded annual growth rate. This dramatic increase is due to the power required for artificial intelligence. On average, a ChatGPT query needs nearly 10 times as much electricity as a Google search. This increased electric demand associated with data center needs is incremental to the requirements for reshoring of power-intensive industries. In total, electric demand is expected to increase at a compounded annual growth rate of about 1% per year through 2030 (Figure 2).
Figure 2: Domestic Electric Demand Growth Forecast

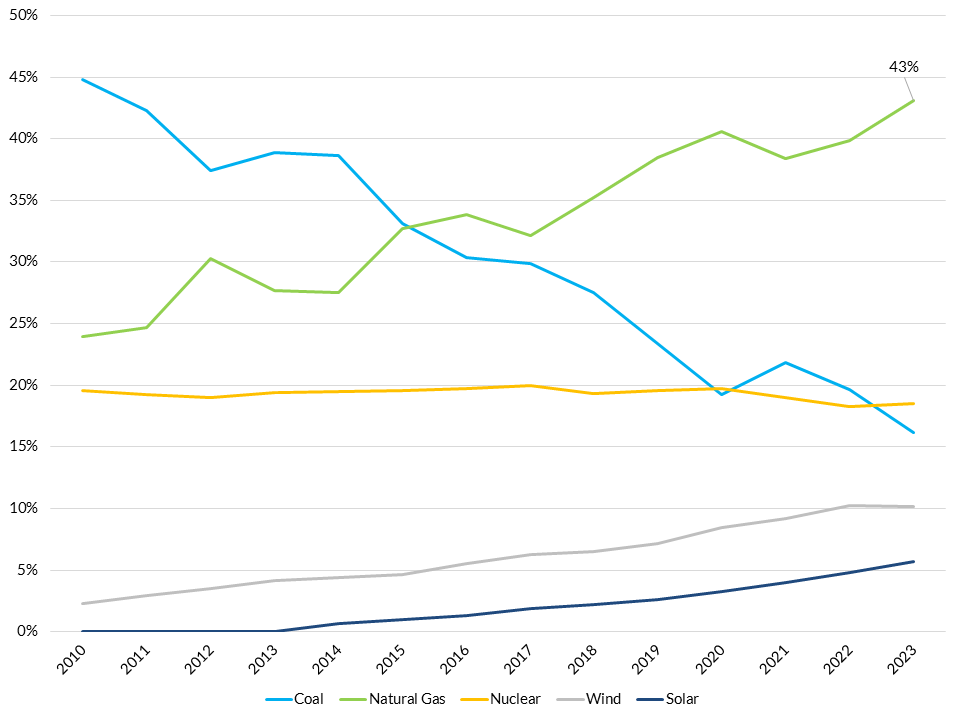
So, what does the increased demand for electricity mean for natural gas consumption? We expect natural gas consumption from the electric sector to rise. It helps to put the existing power grid into context. Presently, the U.S. electric generation fleet consists of plants fueled by natural gas, coal and nuclear, as well as renewables like wind, hydroelectric and solar farms. While wind and solar farms have increased in size over the years, natural gas-fired plants remain the largest generation type by a wide margin with a 43% market share (Figure 3). We expect that overall share to hold firm through 2030 due to the specific needs of demand centers and as coal plants are replaced with a combination of renewable farms and natural gas plants.
Figure 3: Utility Scale Generation by Fuel Type

However, the magnitude of the increase depends on several big assumptions. The primary assumption is the incremental gigawatt hours needed to meet demand center requirements – we noted above this is about 34 gigawatts (51 gigawatts of expected demand less the 17 gigawatts presently). Other assumptions include the type of power plants built to meet that demand, the efficiency of those plants and the utilization rates. We suspect data center-electric demand growth will be more reliant on natural gas than the grid in general given natural gas’s relatively low cost and data center needs for high reliability that renewables do not provide. We also assume the efficiency and utilization rates of the natural gas plants added will be similar to average historical rates. Taking all of these assumptions together adds an incremental 1 billion cubic feet of demand per day by 2030. For context, the U.S. consumes 100 billion cubic feet of demand presently as highlighted in figure 1. Based on the data available, we do not believe data center electric demand will be a game changer for natural gas producers.
However, our confidence level is low on this estimate. Different assumptions than those we made lead to very different forecasts. For example, several energy companies are forecasting significantly larger data center-related demand than our 1 billion cubic feet. During the 1Q24 earnings season, forecasts of an incremental 3 billion cubic feet per day up to 18 billion cubic feet per day by 2030 were made2!
On the other hand, some of the biggest data center users like Alphabet, Amazon, Meta and Microsoft have net zero carbon emission targets for 2030 that conflict with the increased use of natural gas-fired electricity3. Also, there are very real regulatory, permitting and construction constraints that have to be overcome to meet potential incremental demand. According to Goldman Sachs, it takes approximately 4 years from a project announcement date to in-service which includes roughly a year for pre-filing and filing activities, 1-1.5 years for permitting and 1.5-2 years for construction. Suffice it to say, there is a lot of uncertainty.
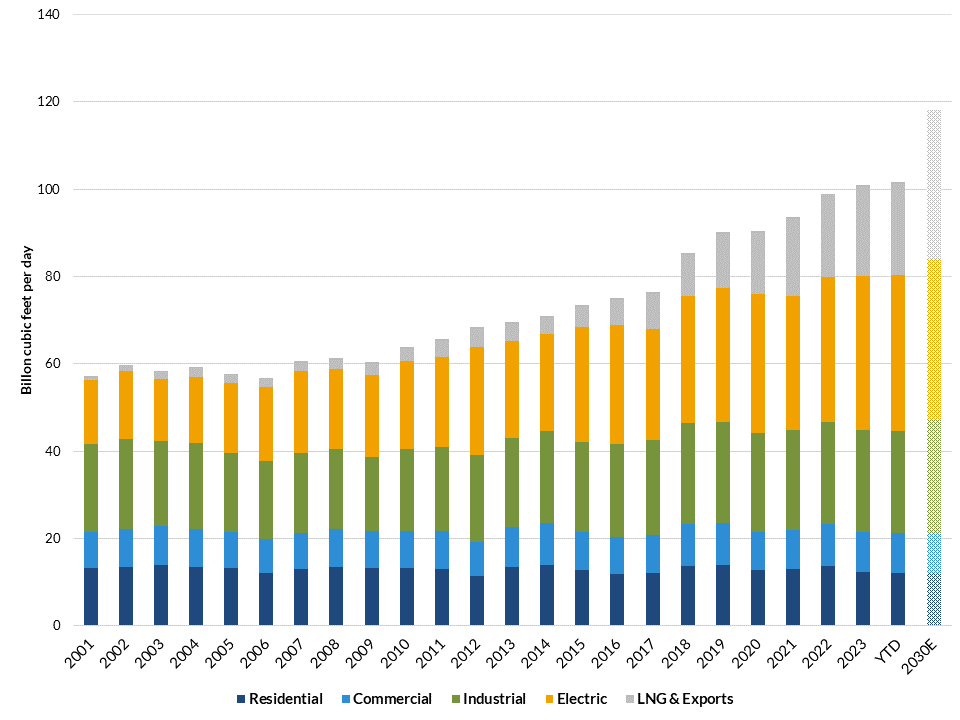
Despite our skepticism about a boom in natural gas consumption from data centers, we are optimistic about total natural gas demand through 2030 (figure 4). The most significant contributor to expected growth is increased liquefied natural gas exports. Presently, the U.S. exports about 12 billion cubic feet per day of liquefied natural gas (and another 8 billion cubic feet per day via pipe to Mexico). We expect liquefied natural gas exports to double by 2030. Additionally, there are new methanol and fertilizer plants that commence operations in the near term, which should increase industrial related demand by 2.5 billion cubic feet per day. So while natural gas consumption growth from data center electric demand may be modest, total demand should be quite healthy for the remainder of the decade.
Figure 4: Annual Domestic Natural Gas Consumption by Sector

1. Waha Hub Natural Gas Trade Date Spot Price (spot price for Permian natural gas)
2. Enbridge Inc.: “I think data center demand, it’s early, I’ve seen numbers from 5 billion cubic feet up to 16 billion cubic feet.” Energy Transfer LP: “The data centers and especially around AI, it’s going to happen. Whether that means over the next five or eight years, it’s going to grow by 3 billion cubic feet of demand of gas-generated electricity or 8 billion cubic feet, we don’t know.”
EQT Corp.: “Our base case view suggests the proliferation of data centers, along with growth in other electricity-intensive markets, such as electric vehicles to drive an incremental 10 billion cubic feet per day of natural gas demand by 2030, while there is a plausible upside case that could take this number up to 18 billion cubic feet per day.”
Kinder Morgan Inc.: “If just 40% of that AI demand is served by natural gas, that would result in an incremental demand of 7 billion cubic feet to 10 billion cubic feet a day.”
TC Energy Corp.: “We think somewhere between 6 billion cubic feet to 8 billion cubic feet of increased gas demand between now and 2030.”
3. Alphabet Inc.: “At Google, our goal is to achieve net-zero emissions across all of our operations and value chain by 2030. Our net-zero goal is supported by an ambitious clean energy goal to operate our offices and data centers on 24/7 carbon-free energy, such as solar and wind.”
Amazon Inc.: “We want to reach net-zero carbon emissions by 2040, a decade ahead of the Paris Climate Agreement, and we are on a path to powering our operations with 100% renewable energy by 2025 as part of our goal to reach net-zero carbon.”
Meta Platforms Inc.: “To align with the Paris Agreement, we have set a goal to reach net zero emissions across our value chain in 2030.” In 2022, Meta’s total emissions equaled 8.5 million metric tons of CO2e.
Microsoft Corp.: “By 2030 Microsoft will be carbon negative, and by 2050 Microsoft will remove from the environment all the carbon the company has emitted either directly or by electrical consumption since it was founded in 1975.”
Disclaimer: Asset Allocation & Management Company, LLC (AAM) is an investment adviser registered with the Securities and Exchange Commission, specializing in fixed-income asset management services for insurance companies. Registration does not imply a certain level of skill or training. This information was developed using publicly available information, internally developed data and outside sources believed to be reliable. While all reasonable care has been taken to ensure that the facts stated and the opinions given are accurate, complete and reasonable, liability is expressly disclaimed by AAM and any affiliates (collectively known as “AAM”), and their representative officers and employees. This report has been prepared for informational purposes only and does not purport to represent a complete analysis of any security, company or industry discussed. Any opinions and/or recommendations expressed are subject to change without notice and should be considered only as part of a diversified portfolio. Any opinions and statements contained herein of financial market trends based on market conditions constitute our judgment. This material may contain projections or other forward-looking statements regarding future events, targets or expectations, and is only current as of the date indicated. There is no assurance that such events or targets will be achieved, and may be significantly different than that discussed here. The information presented, including any statements concerning financial market trends, is based on current market conditions, which will fluctuate and may be superseded by subsequent market events or for other reasons. Although the assumptions underlying the forward-looking statements that may be contained herein are believed to be reasonable they can be affected by inaccurate assumptions or by known or unknown risks and uncertainties. AAM assumes no duty to provide updates to any analysis contained herein. A complete list of investment recommendations made during the past year is available upon request. Past performance is not an indication of future returns. This information is distributed to recipients including AAM, any of which may have acted on the basis of the information, or may have an ownership interest in securities to which the information relates. It may also be distributed to clients of AAM, as well as to other recipients with whom no such client relationship exists. Providing this information does not, in and of itself, constitute a recommendation by AAM, nor does it imply that the purchase or sale of any security is suitable for the recipient. Investing in the bond market is subject to certain risks including market, interest-rate, issuer, credit, inflation, liquidity, valuation, volatility, prepayment and extension. No part of this material may be reproduced in any form, or referred to in any other publication, without express written permission.