SECOND QUARTER CORPORATE CREDIT UPDATE
Market Performance – Continued to weaken in the second quarter
The Investment Grade (IG) Corporate bond market continued to report very weak performance in the second quarter ending June 30, as concerns transitioned from interest rates to the economy. The IG market generated an excess return versus a duration-neutral Treasury of -2.4% for the second quarter, and when including the underlying Treasuries, the total return YTD was -7.2%1. This performance compares to the S&P Index returning -16.4%, and the High Yield market returning -8.1%2 during the same period.
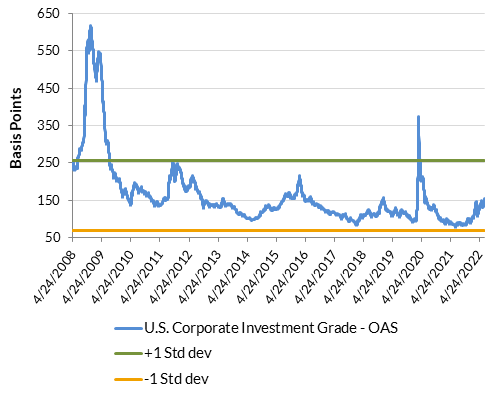
The option adjusted spread (OAS) of the IG market widened 39 basis points (bps) to 155 in the second quarter, with long maturities and ‘BBB’ rated bonds underperforming3. We estimate this reflects a probability of a recession of around 45%. The differential between ‘A-/higher’ and ‘BBB’ rated bonds widened 25 bps to 83, exceeding its 3 and 10-year medians but within one standard deviation respectively4. We expect the OAS to widen beyond 200 bps and the BBB-A basis to widen beyond 100 bps as the probability of a recession increases.
Exhibit 1: IG Corporate OAS
Fundamentals – Weakness expected although IG market is in a stronger position vs. prior cycles
First quarter results were strong from a credit perspective with debt leverage remaining stable and margins improving. Companies allocated slightly more cash to repurchasing shares but spending was in line with cash flow generation, not exceeding it which happens later in a credit cycle. We believe that indicates some level of conservativism on behalf of company management teams.
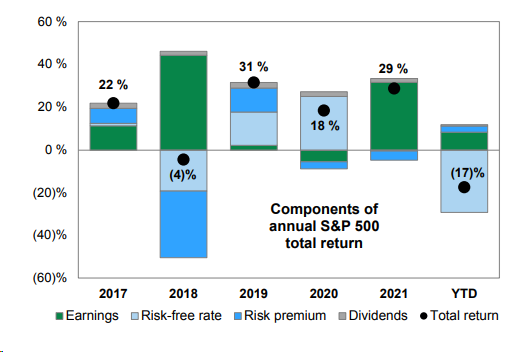
As shown in Exhibit 2, the poor performance of the stock market this year has been driven by higher interest rates not earnings. The Price-to-Earnings multiple of the S&P 500 has historically had a negative correlation with inflation5.
Exhibit 2: Components of S&P 500 Total Return
We expect inflation to remain elevated due to pressures in the natural gas, oil, labor and housing markets. We have been surprised to see inflation break-evens as measured by TIPS fall as rapidly, as we see many of these outlasting early recessionary forces. Moreover, the natural gas crisis in Europe is increasing the risk of a recession and potential shocks if industrial capacity has to be curtailed. Finally, while supply chain pressures have started to alleviate, China’s zero-COVID policy continues to linger and we await a resolution of the contract negotiations with the US West coast dockworkers and shipping companies.
Inflation coupled with slowing growth is increasing the probability of a recession and should pressure earnings. According to information provided by FactSet, equity analyst estimates for this year continue to appear optimistic, with stable-to-expanding margins and double-digit EBITDA growth. Downward revisions for next year’s estimates have started, however. As we wrote last quarter, we believe estimates will need to be lowered. Companies have started to issue negative EPS guidance for the second quarter. Most have originated in the Technology sector in addition to the Consumer Discretionary and Industrial sectors per Factset.
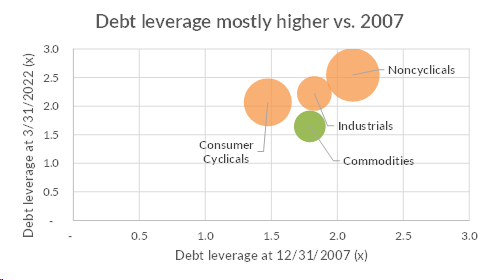
Positively for the IG market, unlike the prior cycle, commodity related firms are entering a slowdown with stronger balance sheets. As shown in Exhibit 3, a large segment of the IG market has increased debt leverage since 2007, but those cash flows are less sensitive to economic cycles (“noncyclical” firms). We expect consumer cyclical sectors to be most vulnerable in this cycle; however, average debt leverage is starting at a relatively healthy point at 2x. Accordingly, while ‘BBB’ rated cyclicals are more at risk of falling to high yield, fallen angels should not be as numerous as in prior cycles.
Exhibit 3: Debt Leverage

Liquidity – Worsening with more downside likely
Financial conditions as measured by the Federal Reserve Bank of Chicago have tightened this year and reflect conditions in prior recessions or stressed periods since 1990. That said, they are not as tight as in the 1970’s or 80’s, when the Fed was fighting inflation. We have moved from massive fiscal stimulus to fiscal drag, as deficits will have reversed from over $3 trillion to slightly under $1 trillion6. After the increase in global interest rates, there is still a little over $2 trillion of negative yielding debt7. However, this has declined to a level we have not seen since prior to 2016.
Liquidity worsened in the second quarter in all markets, as companies have had a more challenging time bringing new debt issues and/or IPOs to market, and transaction costs have increased. We have also seen dysfunction in high quality markets such as Treasuries and Mortgage Backed Securities (MBS).
An equally significant issue for economic growth is the result of the Fed’s stress tests for the three largest banks. Increased capital requirements for JP Morgan, Bank of America and Citigroup will likely result in tightening financial conditions and/or a pullback in capital market activity. This is expected to have a negative effect on liquidity and thus, economic growth. This is coming at a time when fiscal drag is taking hold, as evidenced in part by the fall in money supply growth as measured by M28, and QT has just started.
Market Outlook – Recession risk has increased and volatility likely to remain elevated
Recession risk has increased given the Fed’s focus on inflation and our outlook for it to remain elevated. As GDP growth falls, we expect unemployment to rise materially, although this is not what is reflected in consensus estimates9. The increase in the unemployment rate is a key variable in many default models, and the anticipation of defaults drives spreads. We believe a fall in unemployment may take some time to materialize given the unique nature of the job market. Therefore, we expect choppy markets for the near term.
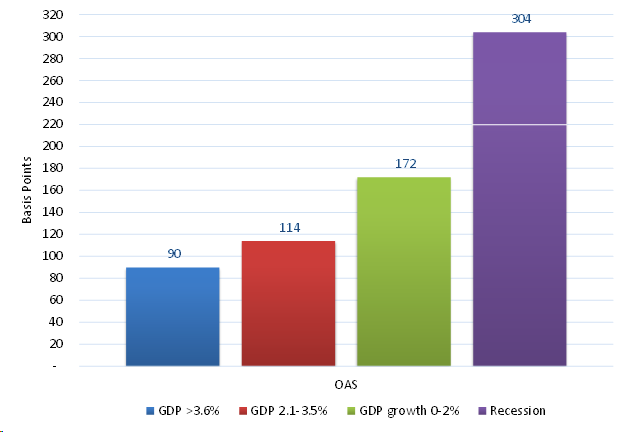
We have reduced risk in total return-oriented portfolios to prepare for wider spreads and risk premiums in various sectors, maturities and rating categories. As our final Exhibit 4 shows, we expect the IG market OAS to increase to around 220, as recession related risks start to materialize. Since 1990, the Corporate OAS has reached 160 seven times. When that has occurred, spreads have widened over the subsequent six months to a median peak of 215 (low 198, high 373)10.
Exhibit 4: IG OAS in Various GDP Environments

1: Bloomberg Barclays Corporate Index
2: Bloomberg Barclays High Yield Index
3: Bloomberg Barclays Corporate Index
4: Bloomberg Barclays Corporate Index
5: GFD, Deutsche Bank using data since 1920
6: Congressional Budget Office (CBO)
7: Bloomberg
8: Bloomberg
9: Bloomberg Economic Forecast Composite for the U.S. as of 7/13/2022
10: “Inflection Point for Spreads” Barclays, 7/8/2022
Disclaimer: Asset Allocation & Management Company, LLC (AAM) is an investment adviser registered with the Securities and Exchange Commission, specializing in fixed-income asset management services for insurance companies. Registration does not imply a certain level of skill or training. This information was developed using publicly available information, internally developed data and outside sources believed to be reliable. While all reasonable care has been taken to ensure that the facts stated and the opinions given are accurate, complete and reasonable, liability is expressly disclaimed by AAM and any affiliates (collectively known as “AAM”), and their representative officers and employees. This report has been prepared for informational purposes only and does not purport to represent a complete analysis of any security, company or industry discussed. Any opinions and/or recommendations expressed are subject to change without notice and should be considered only as part of a diversified portfolio. Any opinions and statements contained herein of financial market trends based on market conditions constitute our judgment. This material may contain projections or other forward-looking statements regarding future events, targets or expectations, and is only current as of the date indicated. There is no assurance that such events or targets will be achieved, and may be significantly different than that discussed here. The information presented, including any statements concerning financial market trends, is based on current market conditions, which will fluctuate and may be superseded by subsequent market events or for other reasons. Although the assumptions underlying the forward-looking statements that may be contained herein are believed to be reasonable they can be affected by inaccurate assumptions or by known or unknown risks and uncertainties. AAM assumes no duty to provide updates to any analysis contained herein. A complete list of investment recommendations made during the past year is available upon request. Past performance is not an indication of future returns. This information is distributed to recipients including AAM, any of which may have acted on the basis of the information, or may have an ownership interest in securities to which the information relates. It may also be distributed to clients of AAM, as well as to other recipients with whom no such client relationship exists. Providing this information does not, in and of itself, constitute a recommendation by AAM, nor does it imply that the purchase or sale of any security is suitable for the recipient. Investing in the bond market is subject to certain risks including market, interest-rate, issuer, credit, inflation, liquidity, valuation, volatility, prepayment and extension. No part of this material may be reproduced in any form, or referred to in any other publication, without express written permission.

