SECOND QUARTER MUNICIPAL BONDS UPDATE
Market Recap
Market rate volatility continued to be a driving theme during the quarter as investors grappled with the transitioning in monetary policy from a pause in tightening to potential rate cuts in the second half of 2024. After starting the quarter at 4.20%, Treasury 10-year rates rose 50 basis points (bps) to a high of 4.70%, before ending the quarter at 4.40%. Most of the volatility was attributed to stronger than expected economic data1.
The municipal market suffered through similar bouts of volatility, as well. Tax-exempt 10-year yields rose as much as 60bps between the beginning of the quarter and June 3rd, before rallying on stronger market technicals to finish the quarter at 2.84%. Taxable munis also exhibited weakness during the quarter as overall market volatility and expensive relative valuation levels at the start of the quarter resulted in weaker demand that pressured yield spreads to Treasuries to widen by 5 to 15bps across the yield curve. Returns for the Bloomberg IG Tax-Exempt Index and the Bloomberg Taxable Muni Index produced negative results for the quarter of -.02% and -.19%, respectively2.
Supply Surge Expected to Remain Elevated
New issue supply in 2024 has surprised to the upside with year-to-date (YTD) issuance levels of $238 Billion through the end of the 2nd quarter. Extrapolating this amount over a full year would produce a total of $477 Billion, which would result in the 3rd highest issuance on record behind only 2020 and 2021. After the 1st quarter generated $102 Billion and a year-over-year increase of 28.3% versus the same period in 2023, the 2nd quarter continued to build in momentum, with issuance of $136B and a year-over-year increase of 32.1%. Overall, YTD issuance is up 30.4% versus 20233.
One of the factors driving issuance so far this year has been a substantial increase in refinancing/refunding activity. Historically, this source of bond issuance typically becomes more elevated as rates move to lower levels. However, even though 10yr Treasury rates have hovered around or exceeded 4% over the last year, the municipal sector has seen a surge in this segment. On a YTD basis, total refundings are up 65% to a total of $74.8 Billion. with elevated activity sourced to tender offerings. Although there is not a consistent publishing platform for tracking this segment, the Bond Buyer reported in 2023 that these refinancings reached a high of $14.1 Billion through July of that year. That compares to only $4 Billion of activity in both 2021 and 2022. For taxable munis that were issued in the low-yield environment of 2020 and 2021, the current elevated rate condition has pushed these prices into deep discounts, and issuers are finding extremely compelling interest cost savings in buying back this discounted debt and refinancing it in the tax-exempt market. There are estimates that tender offer related refinancings could reach $34B for 20244.
In addition to tender offers, the market has also seen an increase in call activity tied to Build America Bonds (BAB). The relatively low nominal yields on tax-exempts, combined with the higher-yield induced reduction of the premium price level on BABs, have made the refinancing of this debt very attractive. As long as muni-to-Treasury yield ratios remain near 30yr lows and the elevated taxable rate environment continues to make the strike prices on BAB calls attractive, the elevated refinancing cycle on this debt should remain in place over the balance of this year. Although there could be legal challenges ahead that hinder these calls from being exercised, there have been market estimates that the sector could see in excess of $30 Billion of calls tied to BABs in 20245.
Another source for the heavier new issuance cycle is coming from new debt issuance tied primarily to infrastructure-related projects. This “new money” issuance has produced a total of $163.9 Billion for a year-over-year increase of 20% on a YTD basis through the end of the 2nd quarter. Extrapolating that over the full year would generate $327.8 billion of issuance, which would be a new record for this category6.
Part of the increase in project financings can be attributed to the $1.2 Trillion Infrastructure and Investment Act that was passed in 2021. Only about 30% of the federal dollars tied to this legislation have been released; however, the majority of that 30% was released in 2023 and 2024 due to the slow ramp-up process for projects. It was expected that state and local governments would leverage the federal dollars from this legislation with their own debt financings, which on a relative basis to taxable yields, looks very attractive. Over the last 8 months, tax-exempt yields as a percentage of Treasury yields have been hovering around 30yr lows of between 58% and 65% due to strong demand metrics for the sector7.
Outlook: Relative Valuations are Unattractive Across the Muni Sector
Although the municipal market exhibited weaker performance for both taxable and tax-exempts during the 2nd quarter, we remain cautious on our outlook for the sector over the balance of the year. Taxable spreads to Treasuries are ~20 to 25 bps through their long-term averages, producing z-scores of -.7 to -1.5 standard deviations for maturity buckets between 7 and 30yrs. New issuance in the taxable muni space has been anemic all year, with only $16.7 Billion issued YTD for a year-over-year decline of 22.4%. With the drop in new issuance, combined with the attrition of the taxable muni universe from elevated call activity tied to tender offers and BABs, we expect supply technicals to provide a favorable backdrop. However, given the expensive relative valuation levels, we are reducing exposure to the sector and favor taxable alternatives with better carry and total return projections8.
We also continue to advocate for the reduction of tax-exempt exposure for insurance company portfolios. As of this writing, at the 21% corporate tax rate, tax-adjusted yields on ‘AAA’ municipals remain at a yield disadvantage to Treasuries of 82 and 83 bps in 3 and 10yr maturities, respectively. There are clearly better yield opportunities in taxable spread sectors and these portfolios should migrate out of municipals, while relative valuations for tax-exempts remain expensive9.
Exhibit 1: Tax-Exempt Relative Valuation Levels
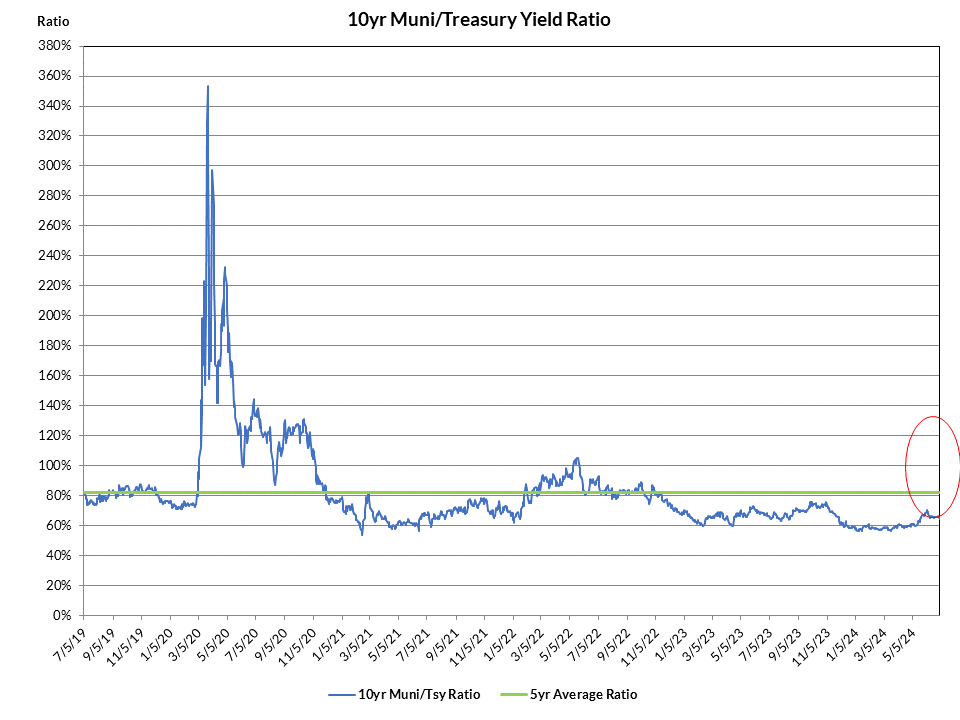
Exhibit 2: Taxable Munis: Compelling Alternative to Tax-Exempts
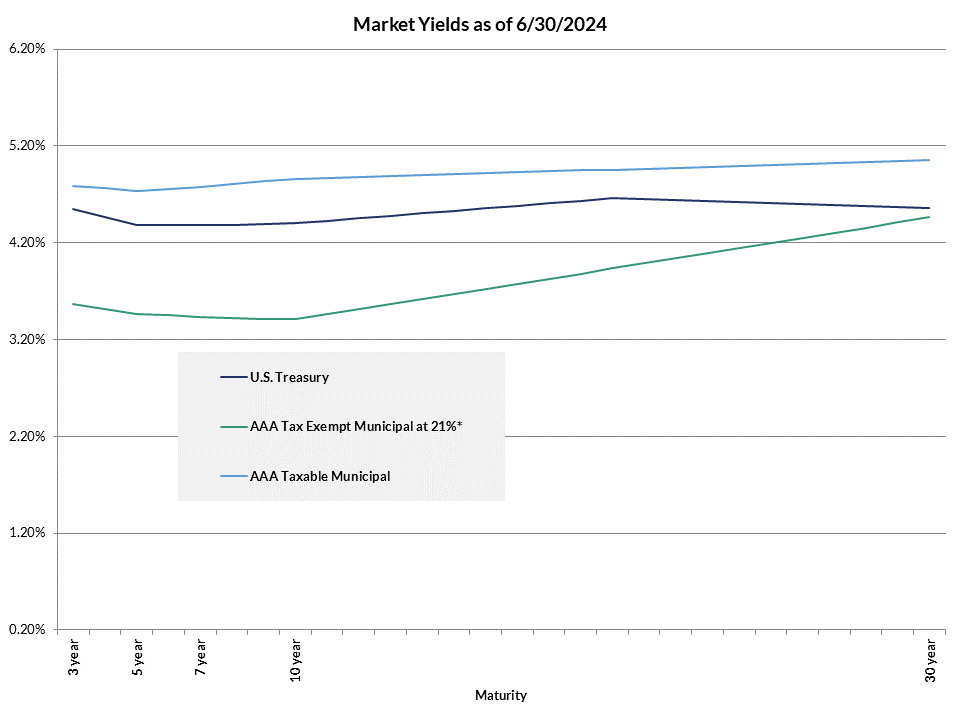
*21% Corp Rate Tax-Adjusted at a Factor of 1.1994
1 Bloomberg
2 Bloomberg, Barclays
3 Bond Buyer, Bloomberg, Barclays
4 Barclays, Bond Buyer, AAM, BEA
5 JPM, Bond Buyer, AAM, BEA
6 Bond Buyer
7 Jefferies, Bloomberg, Refinitiv, TM3
8 AAM, Bloomberg
9 Refinitiv, TM3, AAM, Bloomberg