insight
The Leveraged Loan Market – An Opportunity for Insurance Portfolios
September 30, 2020
Download PDFRecap on Leveraged Loans
Leveraged Loans are senior ranking floating rate debt instruments typically issued by companies with below investment grade credit ratings. A key advantage of loans is that 97% of the market is 1st lien senior secured debt which is higher seniority in the capital structure (1). In the event of default, this priority claim on assets has resulted in higher long-term average recovery rates of 67% (2). By comparison, most bonds are issued as senior unsecured debt which has long-term recovery rates of 38% (2).
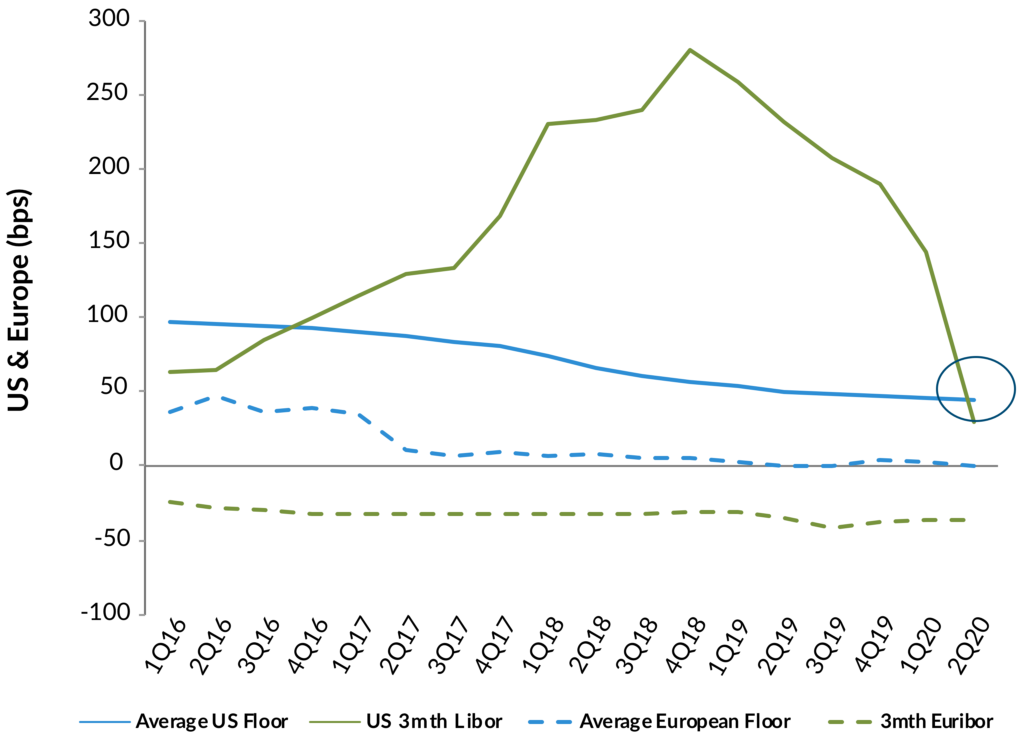
Most loan coupons reset referencing 3 month Libor. But an important feature in today’s low short-term rate environment is that almost all loans have the benefit of Libor floors which limits how far coupons can drop and in turn helps to protect returns.
Exhibit 1: Illustrative Corporate Capital Structure
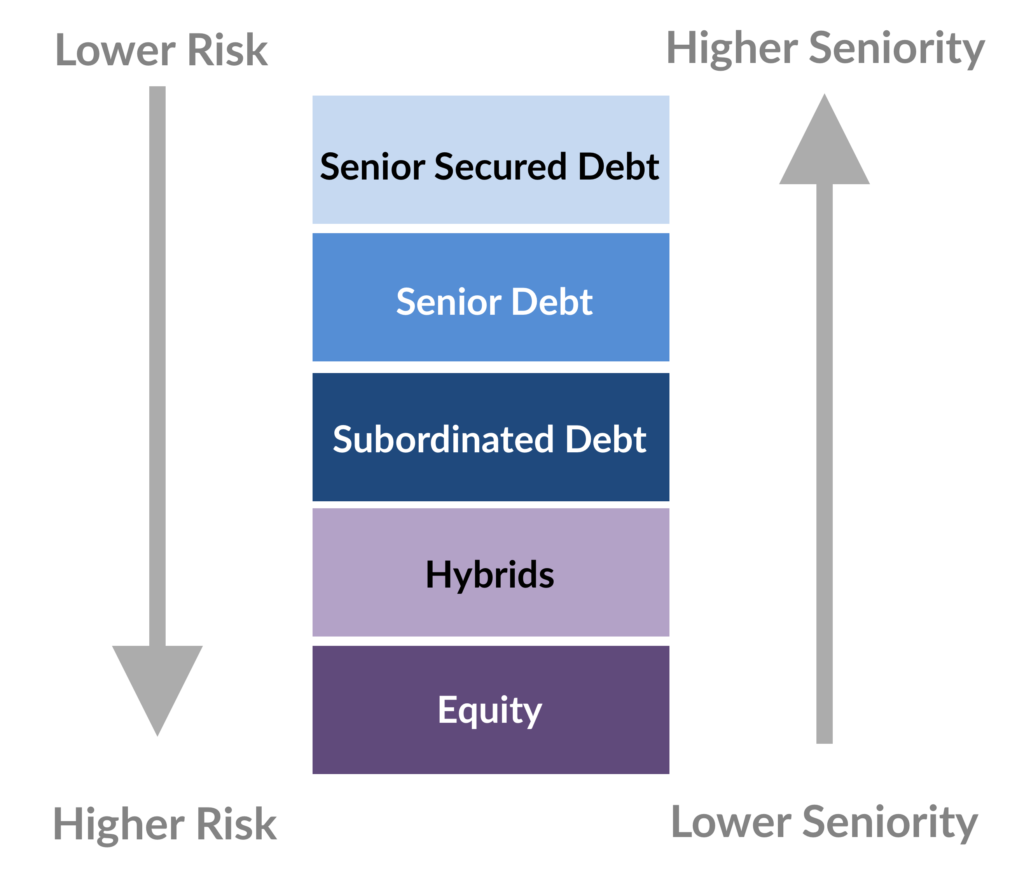
Exhibit 2: Loan Market Libor Floors
Growth of the US Loan Market and Investor Base
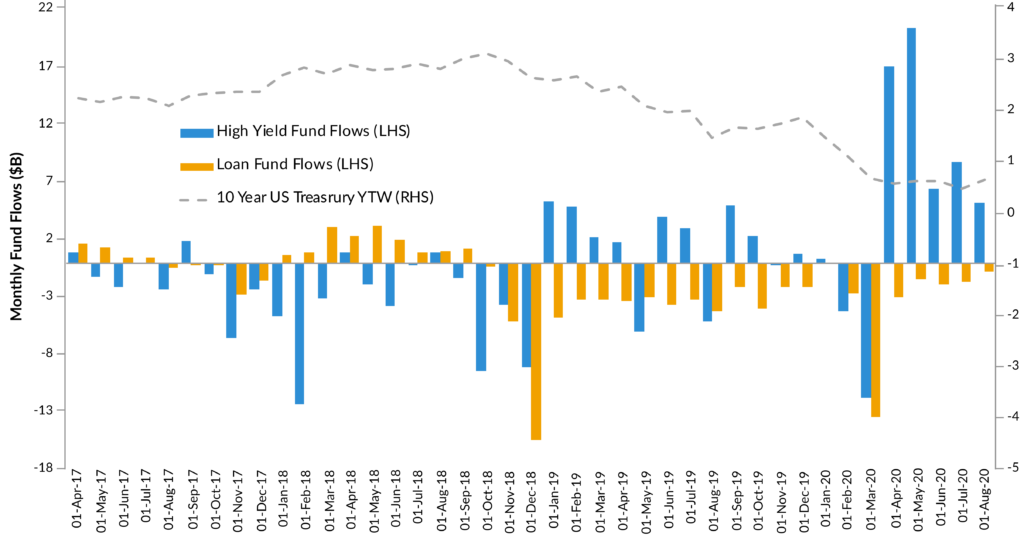
The US loan market has grown significantly since the global financial crisis (GFC) and now stands at $1.27 trillion (3). The U.S. Collateralized Loan Obligation (CLO) market has been a significant driver of demand for loans accounting for as much as 60% of the investor base in recent years. In 2020, however, COVID related concerns reduced CLO issuance which temporarily tempered demand for loans. In addition, retail fund flows are generally correlated to interest rate expectations so recent flows to the loan market have been negative as US Treasury rates reached historic lows.
Exhibit 3: Annual US CLO Activity
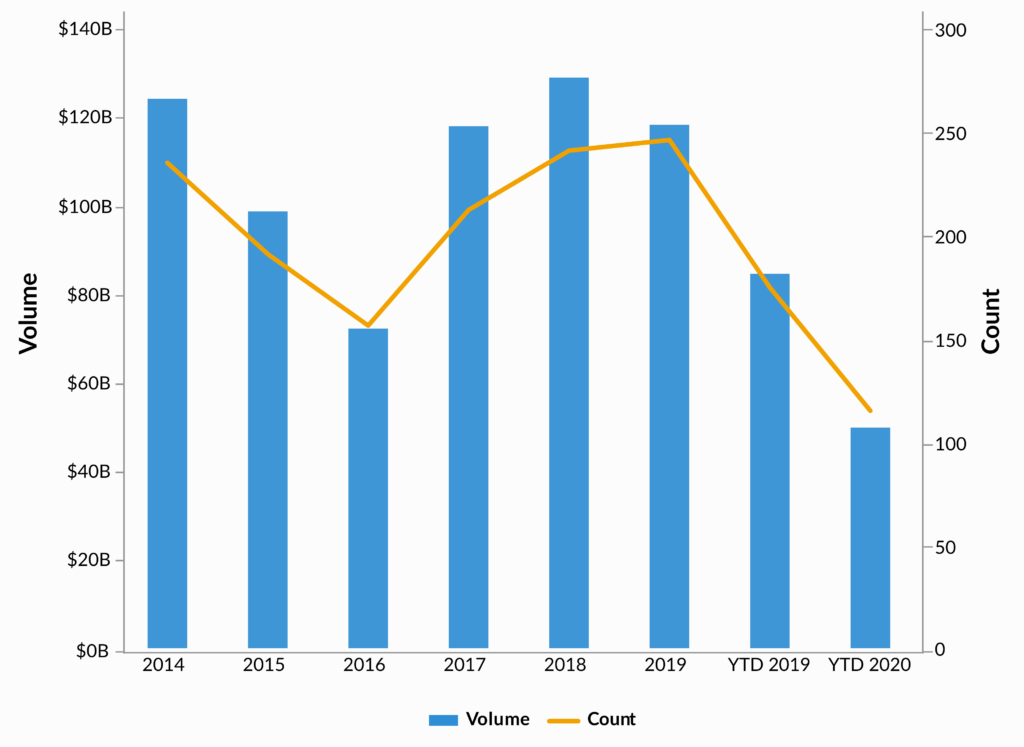
Exhibit 4: Retail Fund Flows and 10 Year Treasury Yields
Current Valuations in Leveraged Loans
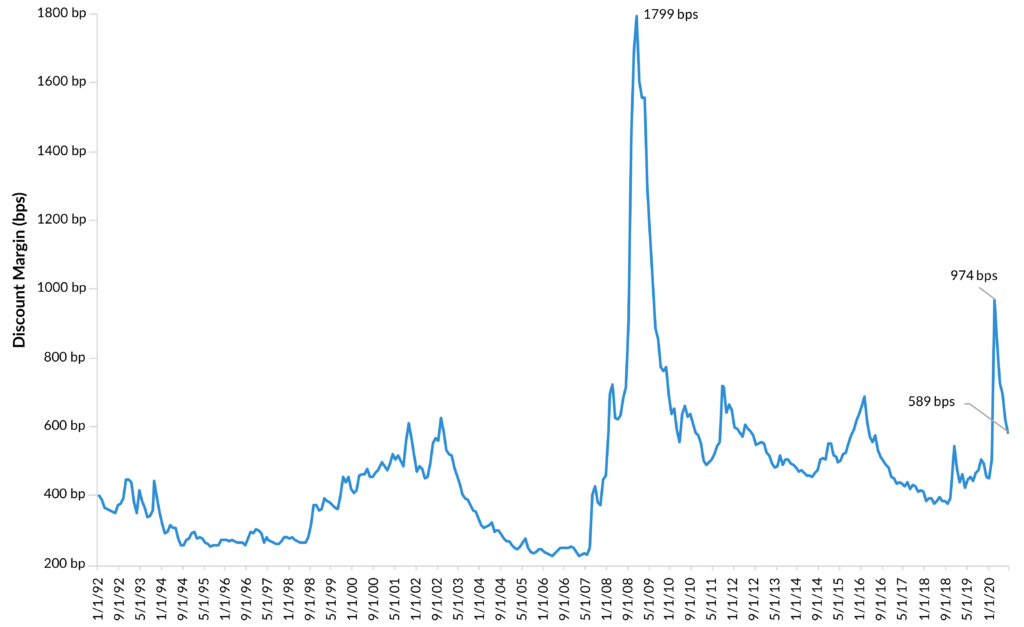
These technical headwinds, along with the recent repricing of risk valuations have caused leveraged loan credit spreads to remain at levels which we believe have historically been attractive entry points for the sector. While trailing 12-month default rates have increased to 4%, we believe that rate should peak in the high single digit percentages in 2020 followed by a decline in 2021 (4). Accordingly, loan spreads over Libor (discount margins) remain elevated, while we believe the average discounted dollar price offers a pull to par opportunity to capture returns as we seek to manage opportunities prudently through the credit cycle. In addition, a recent resurgence in CLO issuance as well as the potential return of retail fund flows could be a catalyst for improving demand.
Exhibit 5: Weighted Average Bid Price ($)
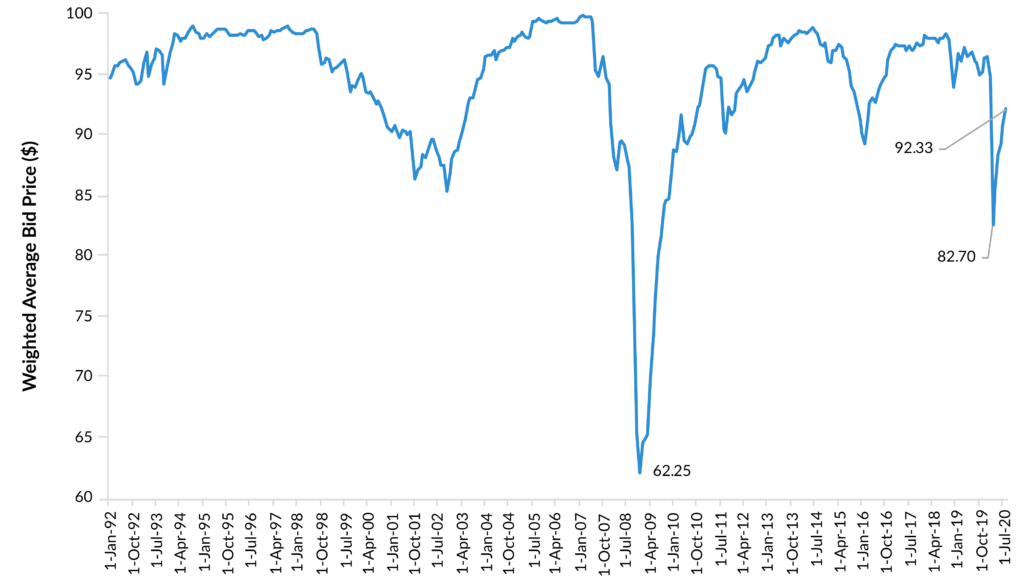
Exhibit 6: Discount Margin – 3 Year Life (bps)
Where Should Leveraged Loans Sit in Insurance Portfolios?
Leveraged loans typically compete for shelf space with high yield in investors’ portfolios. While both products are sub-investment grade lending at heart, there are some significant differences between the products that complement each other well and could provide diversification benefits to an investor’s overall below investment grade exposure. In contrast to high yield bonds, loans are a floating rate product, callable at any time, and typically exhibit lower volatility due to the almost exclusively institutional nature of the investor base. Loans sit higher in the corporate capital structure than high yield bonds, providing different risk considerations. While both asset classes may suffer defaults in a recession, loan recovery rates should be higher than high yield given their senior secured position in borrowers’ capital structure. Finally, loans can offer some additional sector diversity. Of particular relevance this year has been the fact that the loan market had an energy sector exposure of 3% at the end of February 2020, versus 12% for high yield (5).
Regulatory Considerations for Insurance Companies
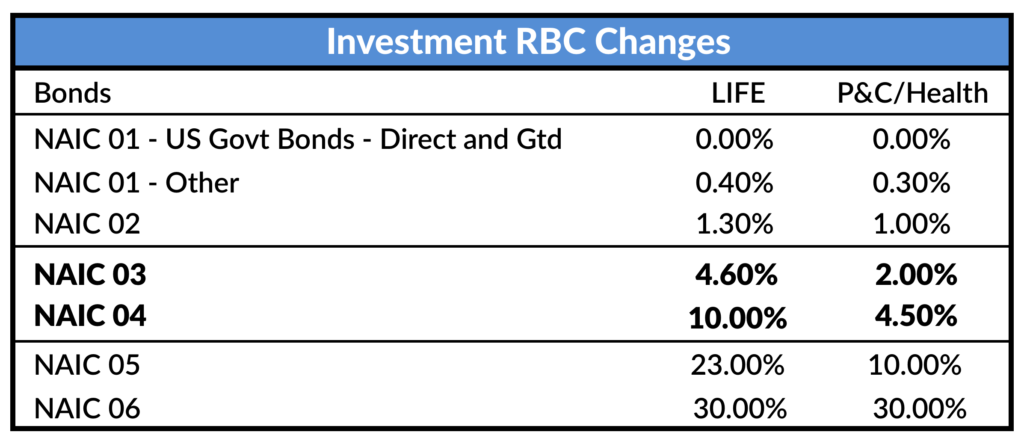
Leveraged loans are schedule D assets with Risk Based Capital charges similar to below investment grade bonds. Almost 90% of the loan market is rated either BB (NAIC 3 equivalent) or B (NAIC 4 equivalent) so we’ve highlighted those corresponding capital charges in the table below (6).
Exhibit 7
Conclusion
In our view, the loan market today is possibly nearing the trough of an economic cycle and should be well positioned for the recovery, both fundamentally and technically. We believe this should create opportunities for investors who can look beyond the headlines. If rates rise again, then retail investors will most likely return to the market in anticipation of this. CLOs, which paused their issuance at the market wides, are being created again, and in the short term demand for loans is likely to outstrip thin supply.
The convergence of global interest rates around zero once again also removes one of the major obstacles for international investors looking at US syndicated loans as hedging costs for buying USD assets have come down substantially. We can also expect to see more international flows into the US syndicated loan market in the coming months seeking to take advantage of the enhanced return opportunity.
We believe loans represent an appealing investment opportunity as a lower volatility source of carry for insurance investors, coupled with some upside potential through the pull to par opportunity in the current market.
In our opinion, insurance investors seeking to minimize defaults might consider an allocation to loans through an actively managed strategy with a focus on higher quality issuers.
Index Definitions and Sources
CS Leveraged Loan Index – The CS Leveraged Loan Index is designed to mirror the investable universe of US dollar denominated leveraged loan market. The index is rebalanced monthly on the last business day of the month instead of daily. Qualifying loans must have a minimum outstanding balance of $100 million for all facilities except TL A facilities (TL A facilities need a minimum outstanding balance of $1 billion), issuers domiciled in developed countries, at least one year long tenor, be rated “5B” or lower, fully funded and priced by a third party vendor at month-end.
GA10 – The ICE BofA ML Current 10-Year US Treasury Index is a one-security index comprised of the most recently issued 10-year US Treasury note.
LIBOR – LIBOR is a benchmark rate that represents the interest rate at which banks offer to lend funds to one another in the international interbank market for short-term loans. LIBOR is an average value of the interest-rate which is calculated from estimates submitted by the leading global banks, on a daily basis.
Sources
(1) Credit Suisse Leveraged Loan Index as of August 31, 2020.
(2) Recovery rate Moody’s Annual Default Study, published January 30, 2020. Issuer weighed recoveries 1983-2019.
(3) Credit Suisse Leveraged Loan Index as of August 31, 2020.
(4) S&P Leveraged Commentary and Data (LCD) index review as of 8/31/2020.
(5) Credit Suisse Leveraged Loan Index (CSLL) and the ICE BofA ML US High Yield Index (H0A0) as of June 30th, 2020.
(6) Credit Suisse Leveraged Loan Index as of 8/31/2020.
Authors
Sam McGairl joined Muzinich in 2016. He is a Portfolio Manager focusing on syndicated loans. Prior to joining Muzinich, Sam was with ECM Asset Management Limited, where he was a Portfolio Manager responsible for loan and high yield investments in the firm’s pooled loan programmes, as well as being responsible for loan trading across all ECM portfolios. Sam started his career at Bank of Scotland and BNP Paribas before ECM. He is a graduate of the University of Newcastle upon Tyne.
Scott Skowronski, CFA is a Principal, Vice President, and Senior Portfolio Manager at AAM. He has 24 years of investment experience, 19 of which have been dedicated to fixed income. Scott is responsible for constructing portfolios based on client-specific objectives, constraints, and risk preferences. He is also responsible for communicating market developments and portfolio updates to clients. In addition to this, Scott is a member of AAM’s ‘Outsourced CIO’ Committee. Immediately prior to joining AAM, Scott worked as a Portfolio Manager and Senior Analyst at Brandes Investment Partners. He is a member of the CFA Institute. Scott earned a BA in Risk Management from Illinois Wesleyan University.
Disclaimer: Asset Allocation & Management Company, LLC (AAM) is an investment adviser registered with the Securities and Exchange Commission, specializing in fixed-income asset management services for insurance companies. Registration does not imply a certain level of skill or training. This information was developed using publicly available information, internally developed data and outside sources believed to be reliable. While all reasonable care has been taken to ensure that the facts stated and the opinions given are accurate, complete and reasonable, liability is expressly disclaimed by AAM and any affiliates (collectively known as “AAM”), and their representative officers and employees. This report has been prepared for informational purposes only and does not purport to represent a complete analysis of any security, company or industry discussed. Any opinions and/or recommendations expressed are subject to change without notice and should be considered only as part of a diversified portfolio. Any opinions and statements contained herein of financial market trends based on market conditions constitute our judgment. This material may contain projections or other forward-looking statements regarding future events, targets or expectations, and is only current as of the date indicated. There is no assurance that such events or targets will be achieved, and may be significantly different than that discussed here. The information presented, including any statements concerning financial market trends, is based on current market conditions, which will fluctuate and may be superseded by subsequent market events or for other reasons. Although the assumptions underlying the forward-looking statements that may be contained herein are believed to be reasonable they can be affected by inaccurate assumptions or by known or unknown risks and uncertainties. AAM assumes no duty to provide updates to any analysis contained herein. A complete list of investment recommendations made during the past year is available upon request. Past performance is not an indication of future returns. This information is distributed to recipients including AAM, any of which may have acted on the basis of the information, or may have an ownership interest in securities to which the information relates. It may also be distributed to clients of AAM, as well as to other recipients with whom no such client relationship exists. Providing this information does not, in and of itself, constitute a recommendation by AAM, nor does it imply that the purchase or sale of any security is suitable for the recipient. Investing in the bond market is subject to certain risks including market, interest-rate, issuer, credit, inflation, liquidity, valuation, volatility, prepayment and extension. No part of this material may be reproduced in any form, or referred to in any other publication, without express written permission.