insight
The Perfect Storm? Fixed Income Portfolio Management in a Reduced Liquidity Environment
September 28, 2015
- Liquidity in the bond market is substantially reduced.
- This liquidity reduction is structural, driven by regulation and a reduced field of intermediaries.
- At the same time, institutional fixed income management has consolidated in order to capture benefits of scale, but their ability to transact is reduced.
- In this environment, there is benefit to being a nimble manager.
Dimensioning the Bond Market and Liquidity
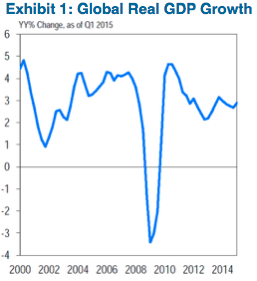
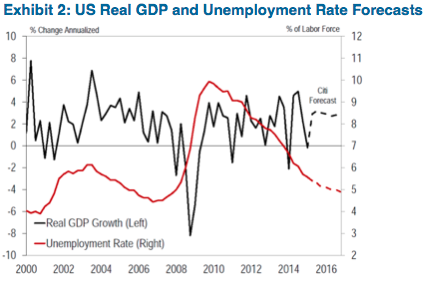
Since the extreme disruption of the global financial crisis in 2008 the world and the U.S. have experienced a deep economic recession followed by a much slower than expected resumption of GDP growth (Exhibits 1 and 2).
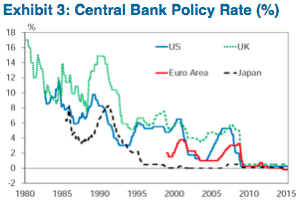
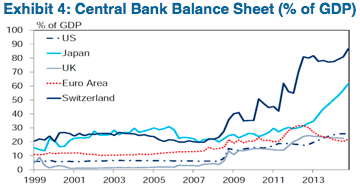
The response of central banks and policy makers to the economic downturn and the subsequent slow recovery have been broad and aggressive, including both conventional policy such as interest rate cuts and non-conventional approaches including aggressive quantitative easing in the large developed markets (Exhibits 3 and 4).
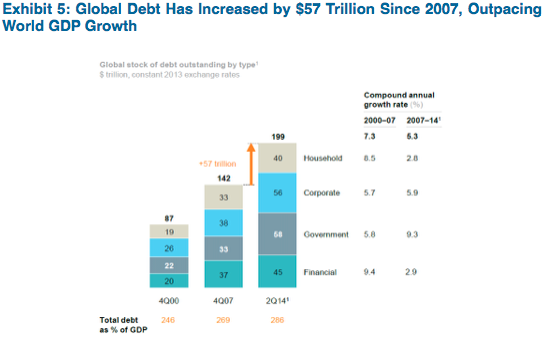
The sustained low rate environment, as well as the introduction of quantitative easing via open market purchase programs, has resulted in an acceleration of the growth of global leverage even as the mix has shifted (Exhibit 5).
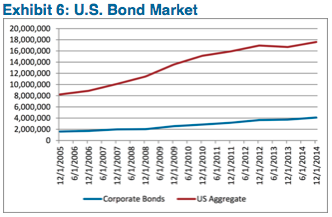
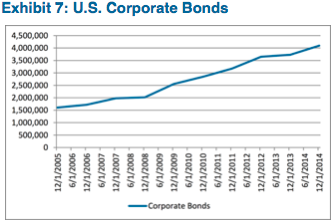
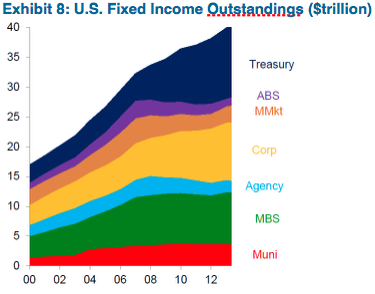
U.S. dollar denominated fixed income markets have participated in this expansion of leverage with the overall market experiencing 18% growth since 2008. While the most rapid rate of growth has been in government linked indebtedness (116%), it has been followed by corporate indebtedness (45%) as shown in Exhibits 6, 7, and 8.
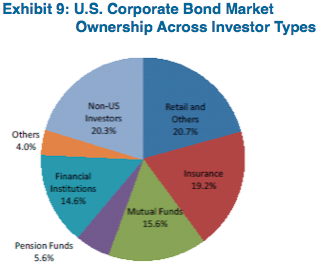
And in particular, growth of the corporate bond market has been propelled both by a move away from bank loans and an influx of retail money in the form of mutual funds and Exchange Traded Funds (ETFs) as well as non-U.S. investors (Exhibit 9).
At the same time that the corporate bond market has experienced record growth, liquidity within the asset class has been dramatically reduced. The most obvious sign of illiquidity is the materially reduced inventories held by the global banks that act as the main intermediaries in the market (Exhibit 10).
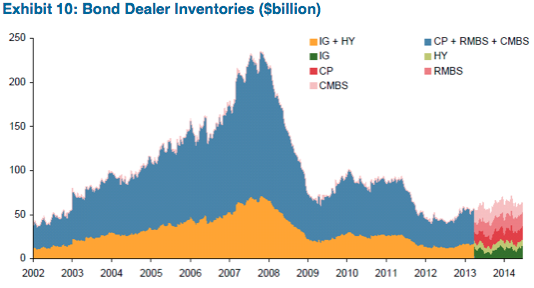
Note: Because corporate bond dealer inventories are not broken down prior to 2013, we have assumed IG and HY inventories are in the same proportion as the average from 2013 – present.
While reduced dealer inventories in all classes of fixed income are evident, the fall in inventories relative to the growth in the size of the corporate bond markets is particularly striking (Exhibit 11).
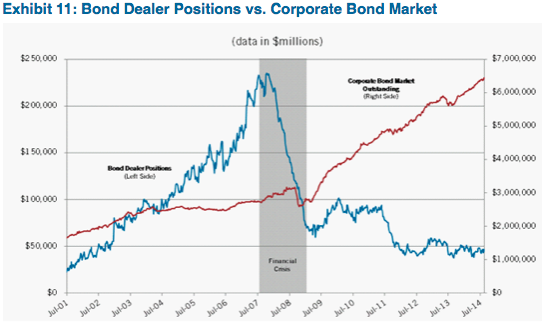
Corporate Bond Market Outstanding = Bank of America Merrill Lynch US Corporate Bond Index and US Cash Pay High Yield Index
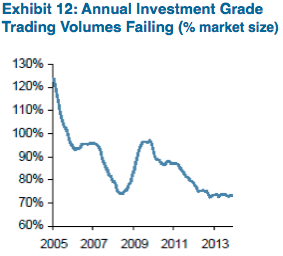
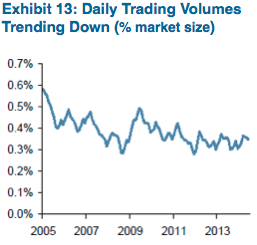
Further evidence of reduced liquidity can be seen in the static daily turnover and average trade size in the corporate bond market (despite the 45% growth in the outstanding).
Why Has Liquidity Been Reduced?
The cause of the reduced liquidity is twofold. Firstly, the advent of new banking regulations in response to the global financial crisis has increased the capital intensity of bank owned capital markets businesses, incentivizing balance sheet reductions by this group of intermediaries. Secondly, the global financial crisis has reduced the traditional pool of intermediaries (the “sell side”), either through outright failure, or through a retreat from the capital markets business.
The main regulatory developments impacting bond market liquidity have been the advent of the Basel III capital guidelines and the Dodd-Frank Act. The Basel III guidelines are a recommended framework for bank capitalization which were finalized in 2011 in response to shortcomings of the previous capital guidelines that were exposed by the global financial crisis (most notably undercapitalizing against the risks inherent in capital markets businesses and securities inventories). The Dodd-Frank Act signed into law in 2010 represents the U.S. Congress’ attempt to remedy the shortcomings in regulatory oversight of the U.S. financial sector that came to light during the financial crisis (and which set the stage for the U.S. adoption of the Basel III guidelines). The key aspects of the Dodd-Frank Act that have impacted liquidity of the U.S. bond market include:
- Implementation of Basel III capital rules – while the new capital guidelines materially increased the minimum levels of capital, they also raised the risk weighting assigned to securities portfolios and counterparty exposures resulting from OTC derivative trades. The increased capital requirements and risk weightings have made the fixed income business considerably more capital intensive (Exhibit 14).
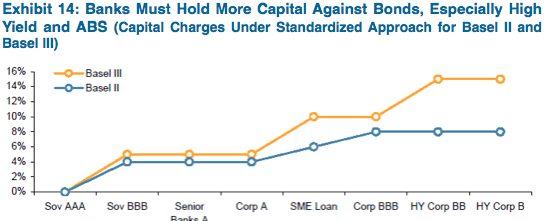
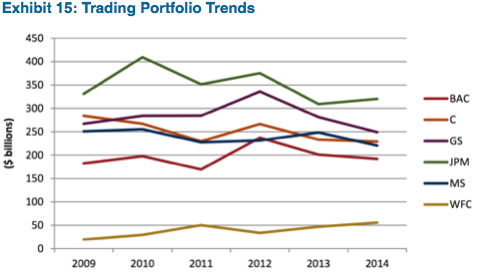
Source: RBS Credit Strategy (July 2014), RBS ABS Strategy, BIS - Imposition of a leverage ratio – in addition to increased risk weighting of securities on the balance sheet, Basel III has imposed a leverage ratio that measures capital against gross assets. This measure of capitalization is meant to protect against any gaming of risk weightings, and particularly penalizes inflated balance sheets (even those consisting of low risk weighted assets such as secured repo and highly liquid Treasury and agency debenture portfolios). The impact of the leverage ratio can be directly observed in the reduction of money center trading portfolios (Exhibit 15).
Source: SNL Financial - Volker Rule – the Volker Rule was a late addition to the Dodd-Frank Act and was meant to cap “risky” activities previously undertaken by banks. Most relevant to the discussion on corporate bond liquidity is the prohibition on “proprietary” trading, defined as trading that is not reasonably associated with customer-based activity. While the implementation of this part of the Volker Rule has been somewhat watered down, it remains subject to regulatory discretion and it has been cited as a driver of reduced trading inventories and staff by bank management.
While increased regulations have reduced the depth of bond market liquidity, the global financial crisis also caused a reduction in the breadth of market liquidity as intermediaries either failed or retreated from the market. The failure of Bear Stearns and Lehman Brothers, as well as the sale of Merrill Lynch to Bank of America represented the most obvious removal or consolidation of market makers. Numerous European banks have also been forced by their domestic regulators to pare back their capital markets businesses. Institutions such as UBS AG, Credit Suisse, Royal Bank of Scotland and Barclays Capital, which had previously been heavily involved in the U.S. fixed income markets, have downsized their capital markets staffing and market making. While various pools of capital have attempted to replace these traditional intermediaries, the effect of new entrants has been muted. Non-bank intermediaries such as hedge funds and start-up broker/dealers have had uneven results and have been reluctant to commit meaningful capital to market making. At the same time, several alternative bond trading platforms have failed to gain a toehold in the markets (with the liquidation of the online start-up Bondcube being the latest failure).
Shift in the Bond Buyer Universe
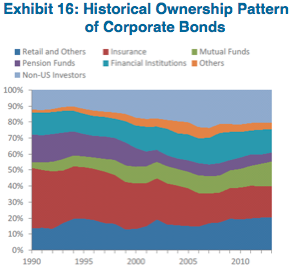
At the same time that bond market liquidity has been challenged by increased regulations and a narrowed field of intermediaries, the bond buyer universe has experienced a transformation. Insurance companies and pensions have remained large buyers, but their proportion of the market has dropped. In contrast, mutual funds/ETFs and foreign buyers have increased as a proportion of the buyer base as investors have attempted to offset the impact of low rates by extending from money market funds (Exhibit 16).
The investment management field has experienced rapid consolidation as bond buyers strive to gain economies of scale. Over the past decade, the twenty largest institutional fixed income managers have increased to 60% of total fixed income assets under management vs. 50% a decade ago, even as the overall market size has grown.
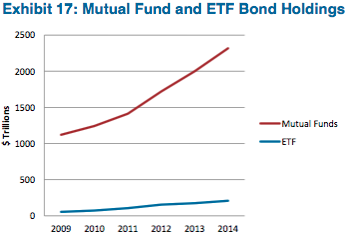
Importantly, the mutual fund and ETF component of these asset managers’ AUM have grown as investors that previously would have invested in money market or treasuries instead pursue income through broad fixed income exposure (Exhibit 17).
Implications for Investors
Corporate bonds as an asset class have largely been a one way trade since 2008, with spreads tightening even as supply has exploded. Reduced liquidity has ramifications for investment management clients both in the current environment, and when the credit cycle turns.
Going forward, total return opportunities in fixed income will increasingly be generated from yield as opposed to opportunistic trading. While increased scale benefits the largest managers in the new issue allocation process, their absolute size is making it increasingly difficult to build meaningful positions across portfolios. Stealth indexing becomes a risk if managers are forced to buy every new deal that comes to market just to maintain diversity and exposure.
Because of the lack of secondary market liquidity, large managers also face limits on their ability to add to positions outside of the new issue market. And liquidity challenges will be aggravated in more volatile markets, making outsized positions difficult to liquidate in more volatile markets. In this context, portfolio construction becomes an enterprise risk management consideration. Bond maturities and cash flow profiles of fixed income portfolios will be critical to meeting client liquidity needs.
In this environment, investment performance will accrue to the providers of liquidity from forced sellers. It will be critical to position client fixed income and surplus strategies to be liquidity providers when there are forced sellers and traditional intermediaries pull back from the market.
Against this backdrop, the benefits of hiring a nimble manager become readily apparent. Defined as being able to execute a chosen investment strategy in the current and foreseeable markets, nimble managers necessarily:
- Can implement portfolio positioning through trades roughly at the market average trade size
- Are able to achieve duration targets in individual credits without owning every outstanding issue
- Do not need to own every issuer that comes to market in order to achieve credit diversification
- Can reduce or eliminate credit exposures without causing market dislocations
It is important to make the distinction between managers that are merely small and those that are nimble, with the latter maintaining institutional level market access and an investment team that is able to independently identify and recommend investments on a timely basis.
Specific Example:
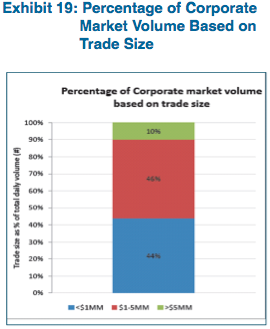
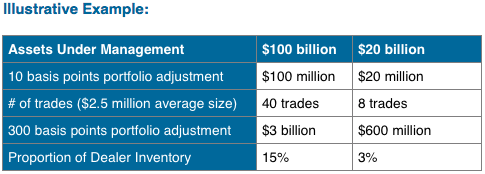
With 90% of total corporate bond trade volume in lot sizes below $5 million, the ability to build material positions outside of the new issue market is minimized. As an example, a manager with $100 billion in assets under management (AUM) trying to grow an exposure to a single credit from 10 basis points to 20 basis points of the portfolio would likely need to execute close to 50 separate trades (Exhibit 19).
Even more concerning is the prospect of increasing volatility of both flows and spreads when market sentiment turns. Returning to our hypothetical $100 billion AUM manager, we assume a 20% weighting to corporate bonds ($20 billion). A decision to reduce corporate bond exposure to 17% necessitates the sale of $3 billion of bonds. Within the context of the average trade size of less than $5 million, this would entail in excess of 500 trades. Even assuming that a larger manager was able to engage in block trades for a portion of the portfolio reduction, a $3 billion portfolio reduction represents 15% of total primary dealer inventory, so it is reasonable to expect that such a repositioning would impact prices and likely require a sustained period of time in order to execute. If such a repositioning were occurring against the backdrop of a negative shift in market sentiment and a pull back by intermediaries, the ability of larger managers to execute portfolio shifts would be further constrained.
Considerations Going Forward
Have regulatory efforts to decrease systemic risk in the banking system increased systemic risk in the capital markets?
To be determined; while lower liquidity/increased volatility appear to be the unintended consequence of the regulatory response to the global financial crisis, higher capitalization and lower systemic leverage (in the financial system anyway) mean that the financial system is better able to sustain the same.
How will fixed income investors react to an eventual removal of easy monetary policy by central banks?
While a sustained rising rate environment would benefit insurance investment clients, the reaction of the new entrants (foreign investors/retail mutual funds/ETFs) in the face of falling prices is less certain. Although mutual funds and ETFs promise continual liquidity to investors, this has yet to be tested in a sustained rising rate environment, particularly for illiquid underlying investments such as corporate or municipal bonds.
Should fixed income investors pay active management fees for passive management results?
We previously touched on the potential for “stealth indexing” to occur when large managers are forced to buy new issues indiscriminately just to stay diversified. Clients should pay careful attention to their investment managers’ ability to customize portfolios and execute their investment ideas efficiently, while also generating needed liquidity, achieving target returns, and prudently managing risk.
N. Sebastian Bacchus, CFA
Senior Analyst, Corporate Credit
Disclaimer: Asset Allocation & Management Company, LLC (AAM) is an investment adviser registered with the Securities and Exchange Commission, specializing in fixed-income asset management services for insurance companies. This information was developed using publicly available information, internally developed data and outside sources believed to be reliable. While all reasonable care has been taken to ensure that the facts stated and the opinions given are accurate, complete and reasonable, liability is expressly disclaimed by AAM and any affiliates (collectively known as “AAM”), and their representative officers and employees. This report has been prepared for informational purposes only and does not purport to represent a complete analysis of any security, company or industry discussed. Any opinions and/or recommendations expressed are subject to change without notice and should be considered only as part of a diversified portfolio. A complete list of investment recommendations made during the past year is available upon request. Past performance is not an indication of future returns.
This information is distributed to recipients including AAM, any of which may have acted on the basis of the information, or may have an ownership interest in securities to which the information relates. It may also be distributed to clients of AAM, as well as to other recipients with whom no such client relationship exists. Providing this information does not, in and of itself, constitute a recommendation by AAM, nor does it imply that the purchase or sale of any security is suitable for the recipient. Investing in the bond market is subject to certain risks including market, interest-rate, issuer, credit, inflation, liquidity, valuation, volatility, prepayment and extension. No part of this material may be reproduced in any form, or referred to in any other publication, without express written permission.
Disclaimer: Asset Allocation & Management Company, LLC (AAM) is an investment adviser registered with the Securities and Exchange Commission, specializing in fixed-income asset management services for insurance companies. Registration does not imply a certain level of skill or training. This information was developed using publicly available information, internally developed data and outside sources believed to be reliable. While all reasonable care has been taken to ensure that the facts stated and the opinions given are accurate, complete and reasonable, liability is expressly disclaimed by AAM and any affiliates (collectively known as “AAM”), and their representative officers and employees. This report has been prepared for informational purposes only and does not purport to represent a complete analysis of any security, company or industry discussed. Any opinions and/or recommendations expressed are subject to change without notice and should be considered only as part of a diversified portfolio. Any opinions and statements contained herein of financial market trends based on market conditions constitute our judgment. This material may contain projections or other forward-looking statements regarding future events, targets or expectations, and is only current as of the date indicated. There is no assurance that such events or targets will be achieved, and may be significantly different than that discussed here. The information presented, including any statements concerning financial market trends, is based on current market conditions, which will fluctuate and may be superseded by subsequent market events or for other reasons. Although the assumptions underlying the forward-looking statements that may be contained herein are believed to be reasonable they can be affected by inaccurate assumptions or by known or unknown risks and uncertainties. AAM assumes no duty to provide updates to any analysis contained herein. A complete list of investment recommendations made during the past year is available upon request. Past performance is not an indication of future returns. This information is distributed to recipients including AAM, any of which may have acted on the basis of the information, or may have an ownership interest in securities to which the information relates. It may also be distributed to clients of AAM, as well as to other recipients with whom no such client relationship exists. Providing this information does not, in and of itself, constitute a recommendation by AAM, nor does it imply that the purchase or sale of any security is suitable for the recipient. Investing in the bond market is subject to certain risks including market, interest-rate, issuer, credit, inflation, liquidity, valuation, volatility, prepayment and extension. No part of this material may be reproduced in any form, or referred to in any other publication, without express written permission.