FIRST QUARTER CORPORATE CREDIT UPDATE
Market Summary and Outlook
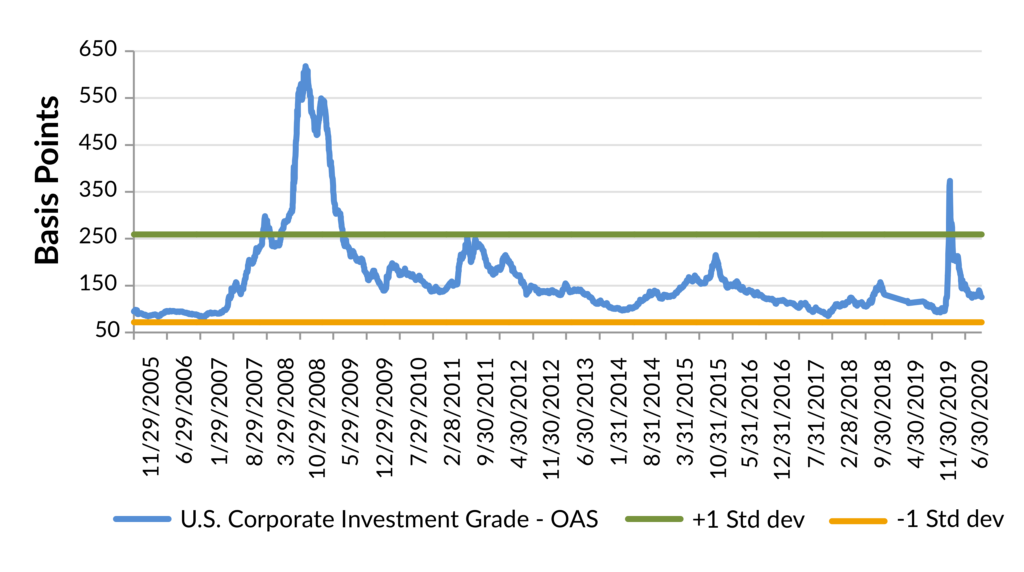
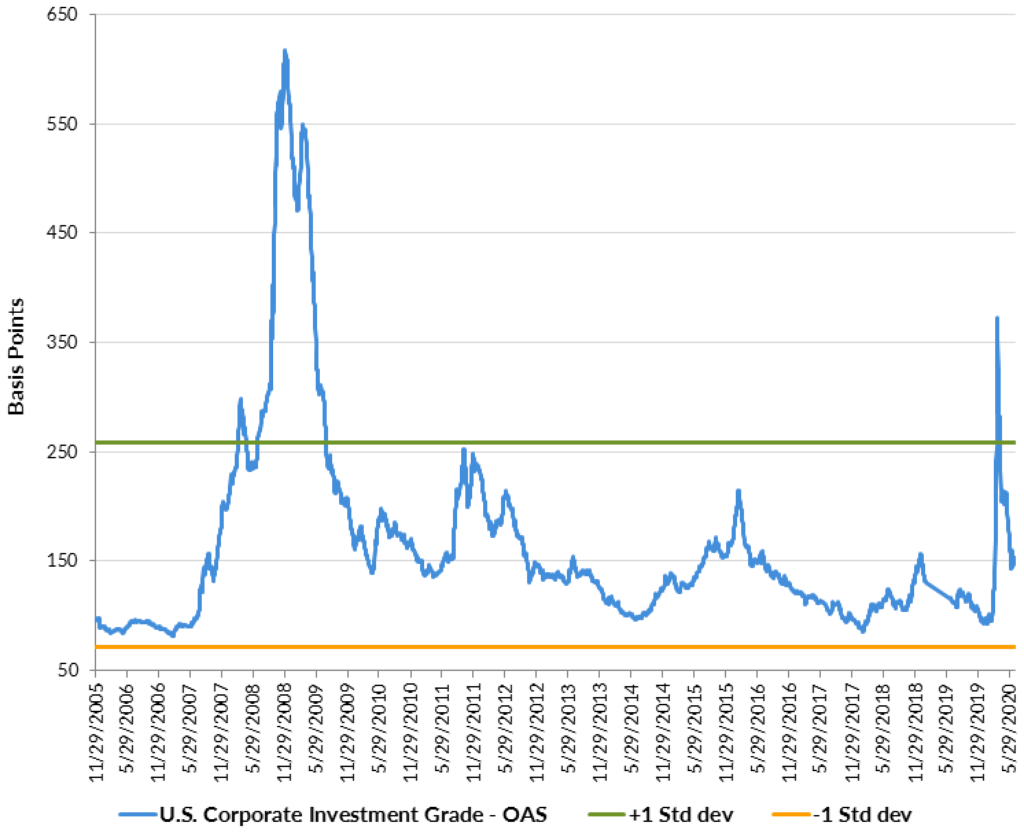
The Investment Grade (IG) Corporate bond market (per Bloomberg Barclays Index) generated modest returns in the first quarter of 2021, with an excess return versus a duration neutral Treasury of 1.0%. On a total return basis, the IG market had one of its worst quarters due to rising Treasury yields, generating a return of -4.7%. Hence, Corporate bonds underperformed the S&P Index, which returned 6.2% and the High Yield market (per Bloomberg Barclays) at 0.9%. The option adjusted spread (OAS) of the market tightened 5 bps in the first quarter, with virtualy all the outperformance coming from the long end, and BBBs outperformed higher quality. Spreads tightened despite heavier than expected new issuance in the first quarter and increased rate volatility.
Exhibit 1: Corporate IG OAS is Statistically Rich
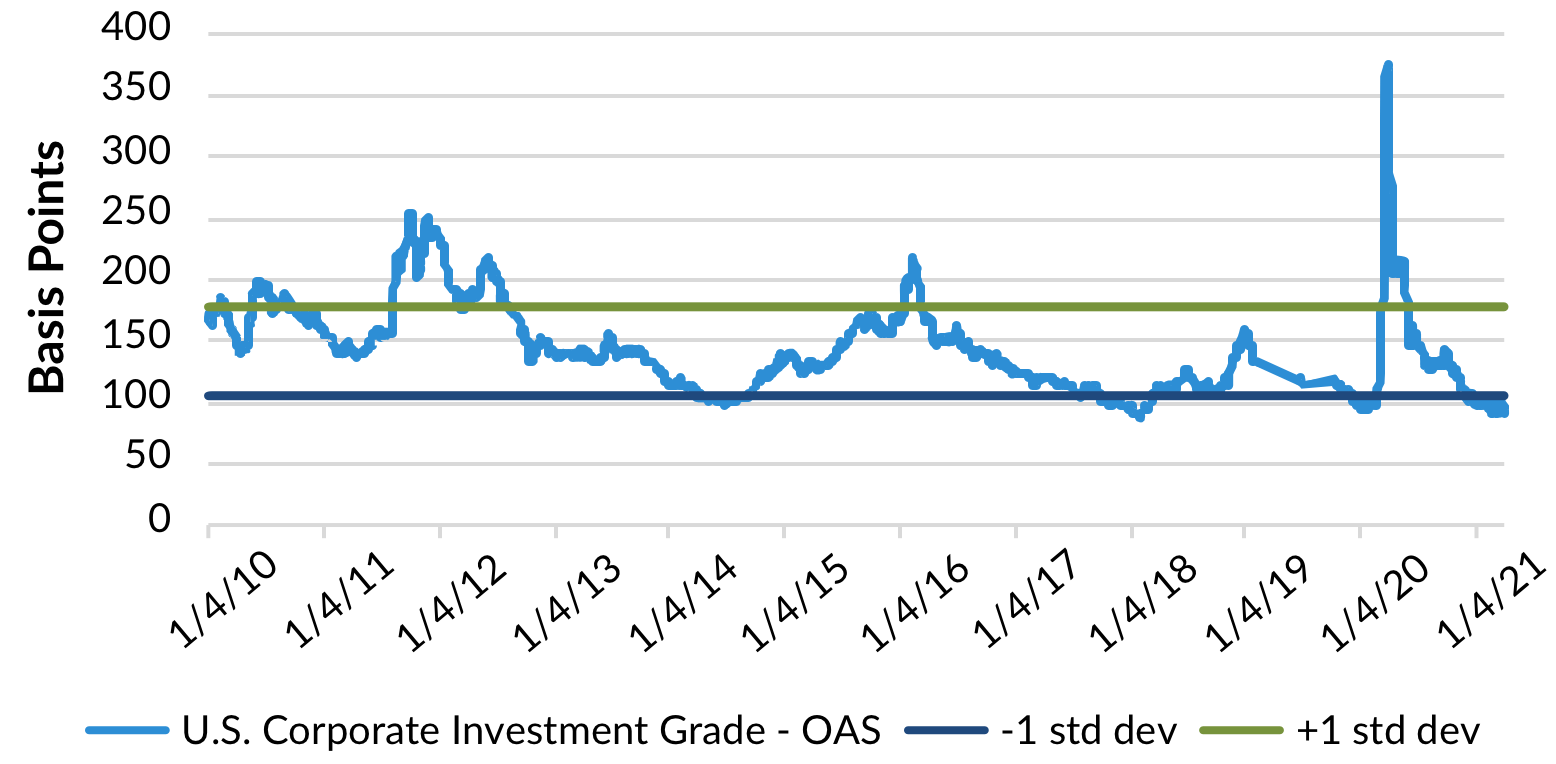
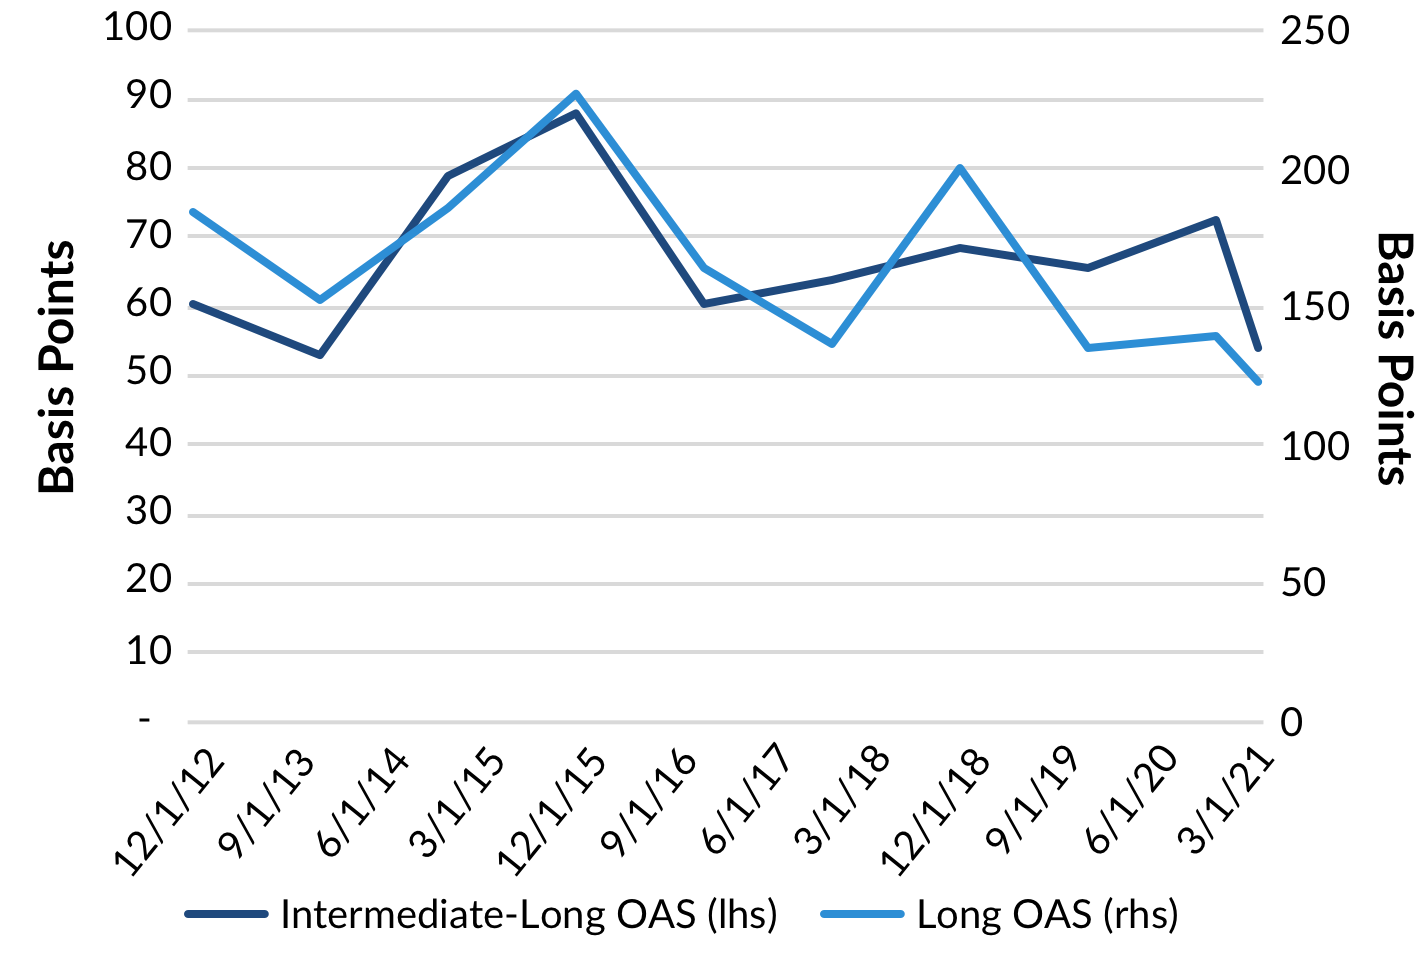
The outperformance in the long end and BBBs is likely being driven by yield oriented investors, who are awash in liquidity, facing a lackluster opportunity set with low global yields and falling default risk. The credit curve has flattened to a cyclical low (Exhibit 2), with short end spreads widening and long end spreads tightening this year. Until we see higher yields away from Corporate Bonds or the Fed signals it will begin tapering asset purchases, we expect this trend to continue, albeit at much slower pace. Despite rising inflation expectations, the Federal Reserve is expected to remain accommodative at least through 2021.
Exhibit 2: The Credit Curve Flattens as Credit Risk Premiums Fall
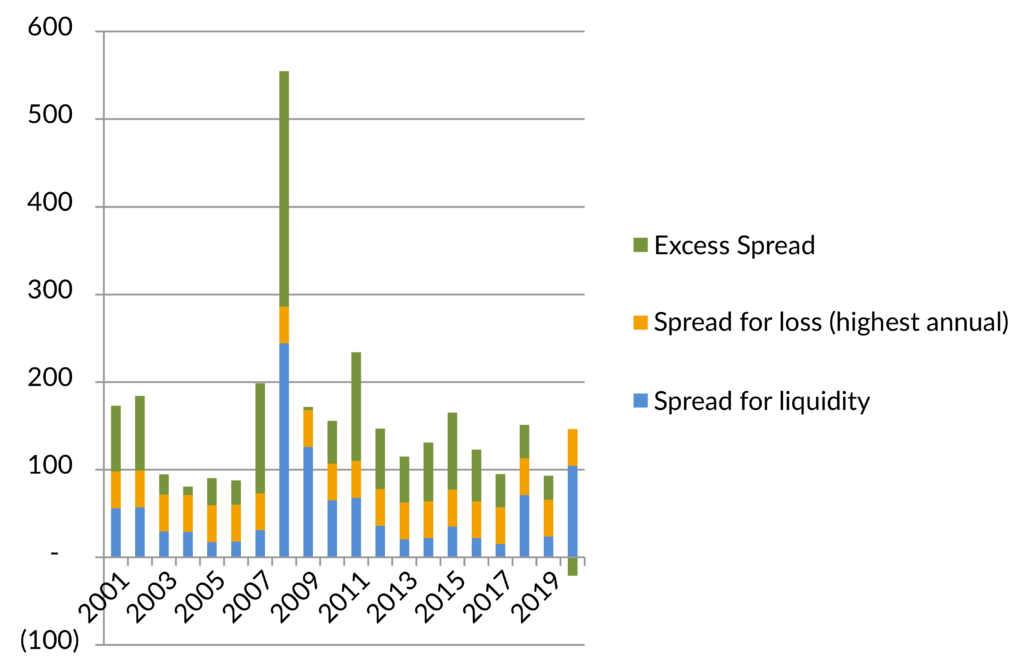
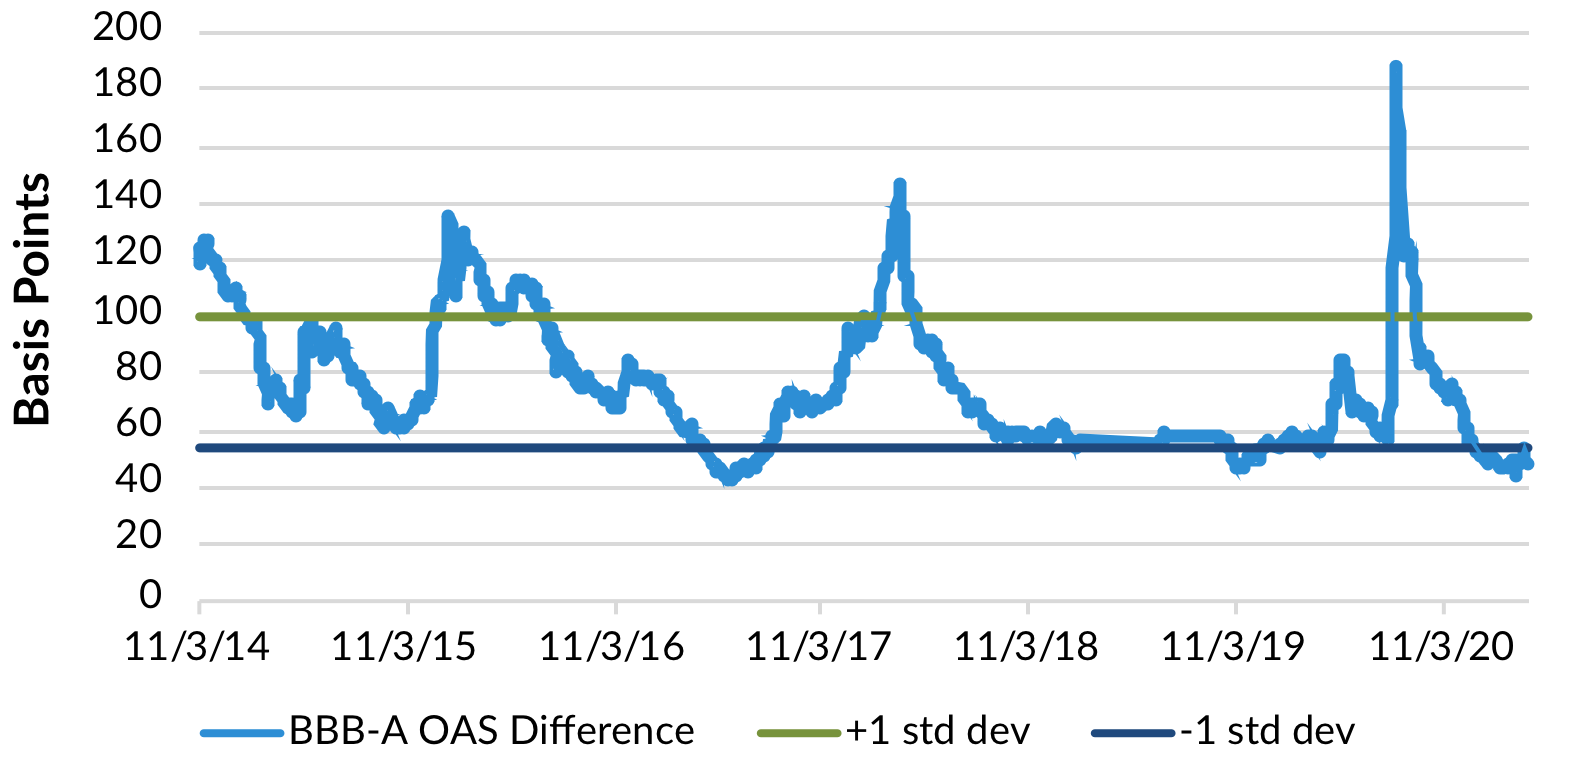
The spread premium investors receive from buying ‘BBB’ rated corporate bonds vs. ‘A’ rated has compressed to a cycle tight. As you can see in Exhibit 3, this basis can remain quite low for some time until there is a fundamental threat to the market. ‘BBB’s widen more than ‘A’ rated credits because of the increased risk of falling to high yield, which adds both increased default and technical risks to the bonds. Since we are early in the economic recovery with unprecedented simultaneous monetary and fiscal support, we view the risk of a fundamental threat as very low. Therefore, until we are later in the cycle or see an emerging threat, we will continue to advocate an overweight BBB position.
Exhibit 3: The Credit Risk Premium Has Fallen as the Economic Outlook Improves
What are the risks to spreads?
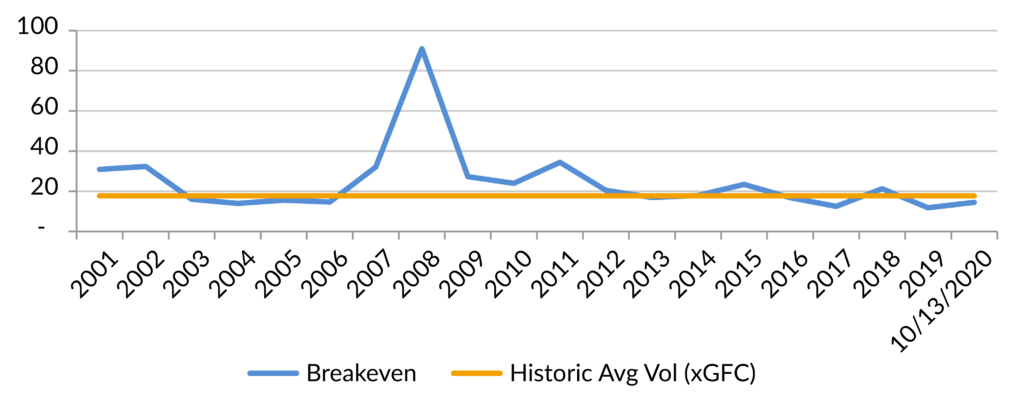
As we had expected, OAS volatility has been minimal this year, with a range of 12 basis points (bps). We expect this to continue in the second quarter, although tax reform related volatility or continued inflation and/or economic data surprises could be the next catalyst for increased spread volatility.
Tax reform
After tax reform was passed at the end of 2017, the OAS moved to its 5-year tights, to 84 bps as investors became more optimistic about growth and the increased incentive for corporations to reduce debt (Bloomberg Barclays Corporate Index). Depending on the magnitude of the change, spreads could soften if growth prospects dim. During the period of 2018-2019, average debt leverage remained flat, as debt increased in line with EBITDA. It was in 2016 when debt leverage fell as companies waited for more information related to taxes and policy. There are many differences today vs. 2017 that will influence the capital allocation decisions of management and Boards. While we would expect companies to generally deleverage this year, management teams are being asked to invest in their businesses at a time of attractive capital and potential investment opportunities and growth. We would view rising tax rates as a headwind for spreads generally. The one caveat is if the plan is viewed as benefiting those sectors and companies (i.e., small businesses) from a top line perspective that will be hurt disproportionately.
Taper tantrum
While we would expect spreads to eventually tighten after a period of volatility induced widening by the Fed as we saw in May of 2013, the long end performance in Corporates is more questionable. The “taper tantrum” sent spreads widening by about 20-25 bps, but after yields became more attractive, buyers stepped in especially on the long end. This caused the Corporate 10s-30s curve to flatten to approximately where it is today (~50bps) (Bloomberg Barclays Corporate Index). As Treasury volatility continued in 2013, long end spreads remained relatively flat while intermediate maturities outperformed. With spreads so tight today and credit curves generally flat, there is little room for this type of volatility without impacting performance. The basis is also vulnerable if these moves cause rising hedging costs or materially higher Treasury yields given the potential softening of market technicals.
Where do we see value in the market?
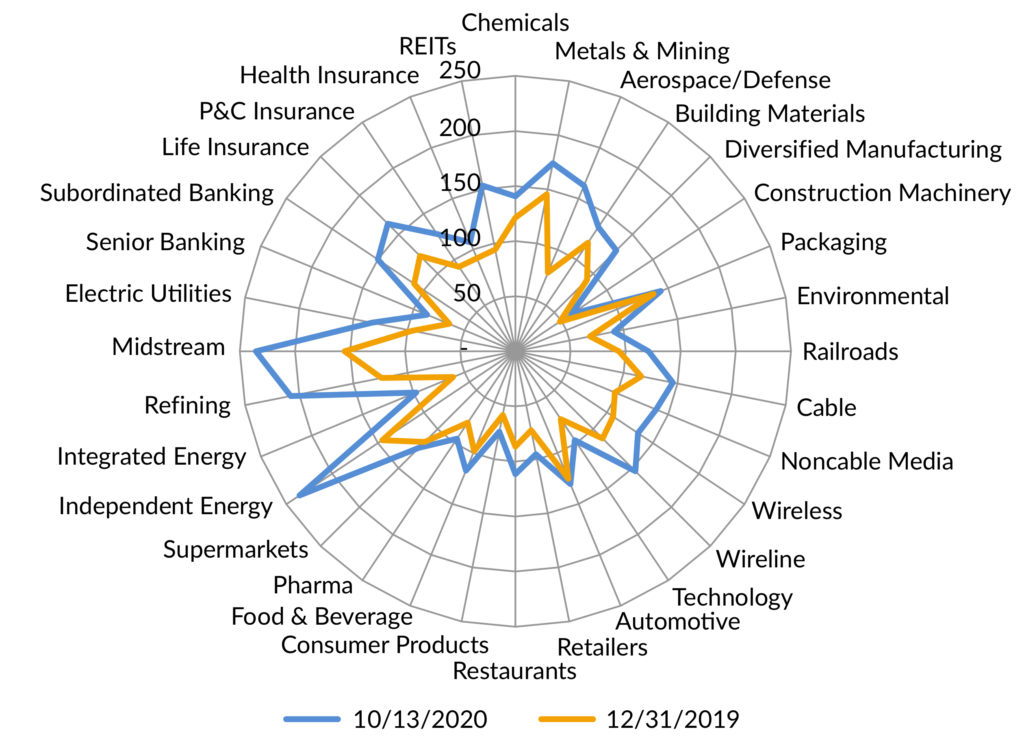
As spreads have tightened, we have been selling bonds with unattractive spreads versus peers and buying those that provide attractive compensation for liquidity and/or industry risk premiums that we calculate in the near to intermediate term. Specifically, we sold bonds in the first quarter that have limited spread tightening potential most often due to the high-quality nature of the credit and/or industry outperformance. Examples of those include: Aerospace/Defense, Chemicals, Infrastructure, Pharmaceuticals, Retail, and Universities. Conversely, we added to sectors that we believe offer attractive risk adjusted income opportunities, such as: BBB rated REITs, Technology, Packaging, and Advertising.
We are being selective in the high-quality rating opportunity set, buying credits we believe have upward momentum fundamentally, as spreads are very tight with low break-evens. We are adding to sectors we believe offer more value today vs. historical levels with positive fundamental outlooks, such as Asset Managers, Communications and possibly Airline Lessors. We continue to see more value in sectors that will benefit from the recovering economy. Lastly, market liquidity continues to be cheaply priced given the absolute level of spreads, so we are taking advantage of those premiums when possible in sectors like Community Banks and Private Placements.