• Skip to primary navigation
  • Skip to main content
  • Skip to footer
AAM CompanyTransparent Logo

AAM Company

AAM Company Website

  • Investment Strategies
    • Investment Grade Fixed Income
    • Specialty Asset Classes
  • Clients
    • Our Clients
    • Client Experience
    • Download Sample RFP
  • Insights
    • Video
    • Webinars
    • Podcasts
    • News
  • About
    • Our Team
    • Events
  • Login
  • Contact Us
Contact

Corporate Credit View

March 2, 2010 by

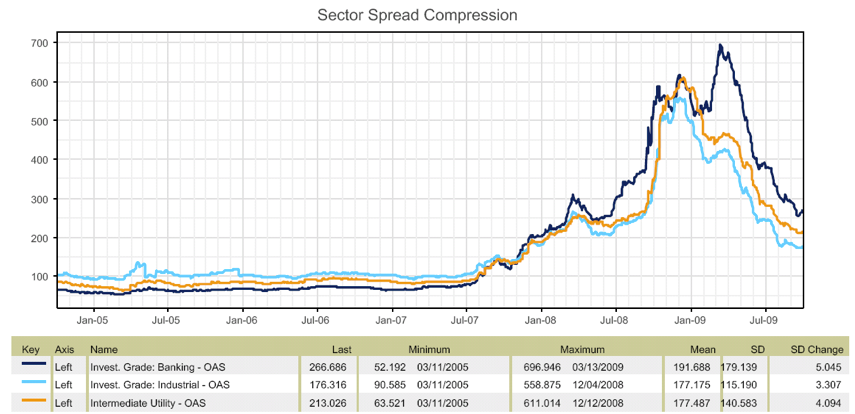
The Barclays Corporate Bond Index modestly underperformed Treasuries in February (-5 basis points (bps) of excess return), leaving the Option Adjusted Spread (OAS) 1 basis point wider than where it ended in 2009, and the yield 26 bps lower.  The year of mixed sentiment certainly continued in February.  Sovereign related fears dominated discussions and the media but did not affect spreads, as they had in January (correlation between Barclays Corporate Index OAS and Greece 5-yr Credit Default Swaps (CDS) dropped from 0.6 in January to 0.2 in February).  Companies continued to report improved earnings and sales while management voiced

Source: Bloomberg
Source: Bloomberg

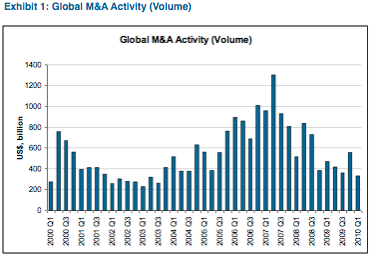
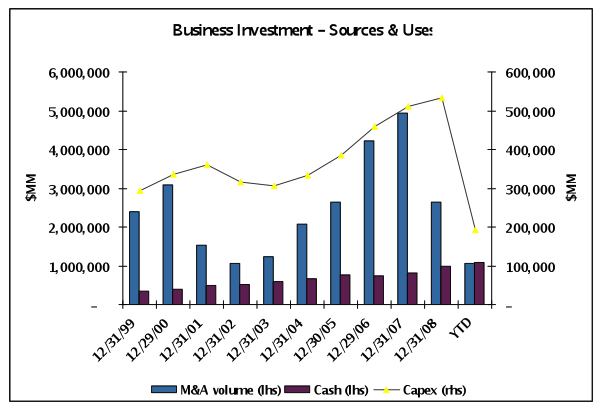
caution regarding the strength of the economic recovery.  Moreover, domestic economic data was mixed, M&A activity remained low (Exhibit 1), cash continued to build at the corporate level, and of course, political and regulatory issues remained unresolved. Regarding technicals, the new issue calendar has been slow, new issue concessions lack- luster, and most accounts are long credit, including the  primary dealers, which finally stopped adding to positions in mid-January.  In short, this is what we expect in 2010 – a year driven by economic data and idiosyncratic events.  Therefore, unlike the broad based spread tightening in 2009, we continue to expect 2010 to be a year where sector and credit selection and curve positioning are paramount for outperformance.

The much anticipated Greek bond issue continues to get delayed, but it’s a matter of time since €23 billion is due by the end of May.  The capital markets expect assistance from either France, Germany, the European Union (EU) and/or International Monetary Fund (IMF) in order to not only prevent a Greek default, but to decrease funding costs and implement conditions that will force structural reforms and tougher fiscal policies.  This does not necessarily apply only to Greece, as other countries in the region and outside the region face the same challenges.  Therefore, we expect sovereign and municipal related headlines to continue throughout 2010, periodically affecting spreads especially for those institutions directly exposed (e.g., local banks in Southern Europe as opposed to large, diverse European utilities or telecoms).  We took advantage of the contagion in early/mid February and recommended buying two strong, diverse credits based in Spain, Telefonica and Iberdrola.  Specifically, the Telefonica 2019 bonds were purchased at +165 to the 10-year Treasury (+165/10) and are offered today at +139/10.  We also recommended selling select highly rated Industrials, as the spreads are lackluster relative to other risk-adjusted investment alternatives.  We expect others may do the same if sovereign issuance is attractive and mortgage spreads widen after the Fed terminates its Mortgage Backed Securities (MBS) purchase program.

Source: Federal Reserve Bank of New York, Barclays

Regarding economic data, February was a difficult month to analyze given the severe weather in many parts of the country and other unexpected events (e.g., Toyota scandal resulted in plant shut downs).   On the negative side, consumer confidence was lower than expected and initial jobless claims were higher than expected.  At this point, we believe such noneconomic factors caused the miss and may further influence other reports in the near term (e.g., government’s monthly employment report released on March 5).  That said, if initial claims do not begin to improve over the next several weeks, it would potentially indicate layoffs are beginning to accelerate and the recovery is stalling.  Positively in February, manufacturing related data was strong according to the two regional manufacturing surveys and robust industrial production growth, although we expect the pace will slow in coming months as goods production settles into a more sustainable growth path. Pricing pressures remained low, and with the surplus of production capacity and slack in the labor market, should remain low this year at a minimum.  In addition, credit costs seemed to have stabilized in the fourth quarter, Mortgage Bankers Association mortgage delinquency rates edged lower, retail sales were up albeit modestly, temp hiring continued, and employment related advertising spending increased.  We believe economic data will be the ultimate driver of spreads in 2010.  Our forecast is muted GDP growth, hampered by a weak consumer and housing market and the lack of credit for consumers and small businesses.  Banks, especially smaller community and regional banks, are still fragile, and governments are not in a position to continue subsidizing growth.

Source: Citi Investment Research and Analytics (survey results)

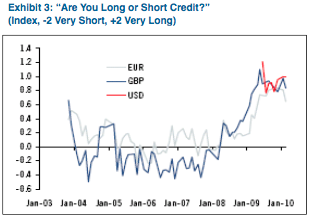
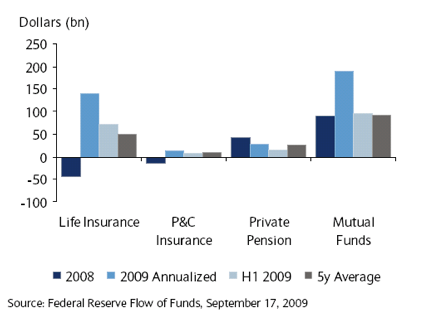
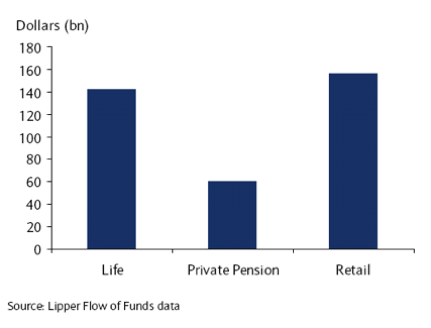
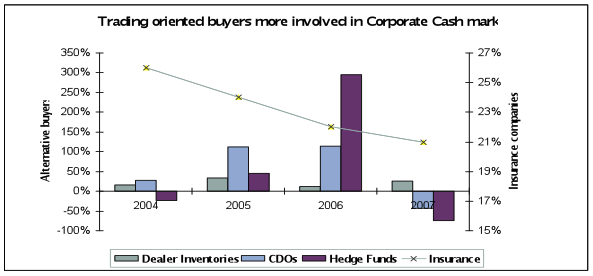
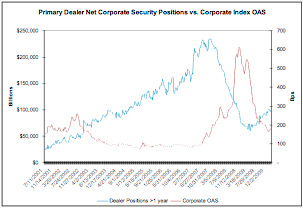
Lastly, the technical back-drop entering 2010 was not as positive as a year ago.  In the second half of 2009, investors’ risk appetite returned. This is best shown in the regression results of primary dealer net Corporate security positions and Corporate Index OAS. Historically, dealer positions have explained very little (R squared 6% since 2001), but over the last six months (November and December in particular), they have explained 80% of the variability in spreads (Exhibit 2).  Also, dealer surveys are showing investors are long credit and the flow into investment grade mutual funds, while still positive, has slowed (Exhibit 3).  While new issuance has been slow year-to-date, we expect it to pick-up especially as M&A activity increases.  That said, we expect new issue concessions and issuance from Industrials will be lower in 2010 versus 2009.  We believe the current level of uncertainty regarding political, regulatory, economic and sovereign related issues does not bode well for a big change in these positions, keeping investors cautious and expecting coupon income to be the predominant source of return in 2010.

This information is developed using publicly available information, internally developed data and outside sources believed to be reliable.  While all reasonable care has been taken to ensure that the facts stated and the opinions given are accurate, complete and reasonable, liability is expressly disclaimed by AAM and any affiliates (collectively known as ‘AAM’), and their respective officers and employees.  Any opinions and/or recommendations expressed are subject to change without notice.

This information is distributed to recipients including AAM, any of which may have acted on the basis of the information, or may have an ownership interest in securities to which the information relates.  It may also be distributed to clients of AAM, as well as to other recipients with whom no such client relationship exists.  Providing this information does not, in and of itself, constitute a recommendation by AAM, nor does it imply that the purchase or sale of any security is suitable for the recipient.

February 4, 2010 by

Volatility re-emerged in January. It started strong with Corporate intermediate spreads tightening 10 basis points (bps) and long spreads 6 bps by January 11. On January 12, they reversed course and widened 5 bps and 18 bps respectively over the remaining days of January. This pressure on the long end caused the Corporate Index (Barclays) to post negative excess returns for January (-11 bps overall, +16 bps intermediate, -92 bps long).   All three broad sectors (Finance, Industrials, Utilities) exhibited this type of performance (positive 1-7 years, negative 8+ years) and BBBs and AAAs outperformed AAs and As. The drivers were diverse: sovereign, political and economic.

Sovereign risk was front and center this month. China increased its reserve requirement for banks by 50 bps from 15.5% to 16%. The market viewed this as the Central Bank taking action to cool potential asset price inflation, namely in the property and equity markets. In short, we believe China’s structural changes bring organic growth opportunities, and view the largely symbolic action as supportive of that outlook.

The other sovereign issue was and remains in Europe, namely Portugal, Ireland, Greece and Spain, and the potential systemic effects they could have economically and technically given their fiscal issues. Regarding technicals in particular, one reason for concern is the correlation between the Sovereign and Corporate sectors of the Index. It has historically been high (0.92 over 10 years per the Barclays Index data), but has ranged from 0.24 to 0.98, which shows decoupling does take place. The European Commission recognizes the downside risks of letting countries like Greece fail, and while we acknowledge the risk of sovereign weakness over the longer term for market returns, we do not view that as a material driver of spreads in 2010. We do expect spreads to remain vulnerable to this news until uncertainties are addressed.

Second, President Obama’s speech regarding his support of the Volcker Rule disrupted the financial markets due to both the direct and indirect consequences of a more aggressive regulatory approach. The public’s outrage toward large banks increases the uncertainty regarding the reform of the financial system, and the possibility that the issue will become more political. We had believed that financial reform would decrease the risk in the system (good for creditors), but the shift in tone was worrisome from the standpoint that too much regulation can be harmful to economic growth, potentially slowing down the velocity of funds and destroying value. This risk continues to be front and center in our minds, but we are optimistic after time has passed since the President’s speech and the rhetoric has not increased but has been assuaged.

Lastly, fears emerged once again that the economy was not as strong as it seemed at the end of 2009. We have communicated our expectation for muted domestic GDP growth, which we believe is supportive for Corporate bonds. Our tracking of the data, including but not limited to: specific industry related data (see Exhibit 1) that serves as leading economic indicators, the improvement in 30 and 90 day delinquencies at the banks, the improvement in consumer confidence and spending, temporary hiring, not to mention the positive results this earnings season especially at the revenue level, is encouraging. Moreover, the Administration’s focus on job growth we view positively for the economy, as these stimulus efforts should help to support GDP growth in 2010 and reduce the risk of a “double dip.”

Exhibit 1:

AAM Corp Credit 2-10 1

In summary, we believe January is reflective of what Corporate bond investors can expect this year. Investors are wary that spreads are not compensating them for downside scenarios that can easily be painted due to all of the uncertainty that exists, politically, economically, financially, globally. That being said, after nearly 12 months of supportive behavior and actions at many different levels (private and public sectors), our outlook is not skewed to the downside based on higher probabilities assigned to more draconian scenarios. We are taking an objective approach, analyzing and tracking the data, and continue to believe that a portfolio that is invested in particular industries and credits will outperform Treasuries in 2010.

This information is developed using publicly available information, internally developed data and outside sources believed to be reliable.  While all reasonable care has been taken to ensure that the facts stated and the opinions given are accurate, complete and reasonable, liability is expressly disclaimed by AAM and any affiliates (collectively known as ‘AAM’), and their respective officers and employees.  Any opinions and/or recommendations expressed are subject to change without notice.

 This information is distributed to recipients including AAM, any of which may have acted on the basis of the information, or may have an ownership interest in securities to which the information relates.  It may also be distributed to clients of AAM, as well as to other recipients with whom no such client relationship exists.  Providing this information does not, in and of itself, constitute a recommendation by AAM, nor does it imply that the purchase or sale of any security is suitable for the recipient.

January 6, 2010 by

Year 2009 closed as an exceptional year for the Corporate Bond sector with 2276 basis points (bps) of excess return per the Barclays Corporate Bond Index. This compares to 2008, which posted an excess return of -1988 bps. In terms of broad sector performance, Industrials and Utilities outperformed the Finance sector. Spreads remain wide of historical averages, reflecting the various uncertainties we face in the near term. Exhibit 1 depicts spreads for higher quality bonds in the three broad sectors.

Exhibit 1: A Rated Bonds (Z spread, bps)

5-year 10-year 30-year
12/30/2009 Average std dev 12/30/2009 Average std dev 12/30/2009 Average std dev
Utilities 92 74 80 105 85 78 128 109 109
Industrials 71 67 69 93 82 70 126 110 110
Finance 148 130 169 171 142 164 204 163 163

Source: Barclays; Index data as of 5/31/1994 to 12/30/2009

Spreads reflect the fundamental health and technical dynamics of the market. Compression in 2009 was due to an improvement in both, as the government stimulus and financial related initiatives shortened the tail risk in the market especially for Financials. Technical support returned to the market, as shown in the Exhibits 2 and 3, as funds flowed back into Corporate Credit.

Exhibit 2: Direct Flows into Corporate Credit
AAM Corp Credit 1-14 2
Exhibit 3: Annualized 2009 Flows Into Credit From 3 Major Buyer Groups
AAM Corp Credit 1-14 3


We enter 2010 with a different set of variables. Fundamentally, we continue to expect a muted economic recovery in the U.S. while other countries (“BRIC” – Brazil, Russia, India and China) grow more rapidly. The U.S. continues to face serious issues despite the improvements of late. Job creation and hiring must take place, foreclosures remain manageable, and real estate related loan modifications be successful, not to mention the government must continue to be involved and support the transition from the public to the private sector. As long as we remain on the path of recovery, a slow growth environment is not necessarily a negative for Corporate Credit (See Exhibit 4).

Exhibit 4: Credit Performance in Various GDP Environments
(Quarterly Median US IG Excess Returns vs. Real GDP Cohorts)

AAM Corp Credit 1-14 4

This “slow growth” environment should result in good old fashioned merger and acquisition activity, innovation to differentiate, and industry participant bifurcation where industries are cleansed of weak operators that benefited from the earlier days of easy money. We are seeing the latter in the Finance sector, as hundreds of small banks and other weak financial institutions like CIT have failed. Our approach for 2010 is not an unfettered “grab for yield” as many others are proposing, but a prudent “invest in growth,” which we believe will be a winning strategy over a longer period of time. Security selection remains critical, although we do not expect 2010 to be a year of high idiosyncratic risk like we have seen in previous years (e.g., LBO phenomenon). Therefore, both the industry and security calls are important.

Specifically, as it relates to industries, we continue to advocate sectors such as: (1) Banks and Insurance, including owning select subordinated securities of stronger banks given the right structure and economics, (2) commodity based cyclical industries and those related to them, and (3) defensive consumer based sectors like Food and Beverage, as opposed to Homebuilding/Building products. We are cautious on industries and companies that face growth obstacles over the near-to-intermediate term, making them more susceptible to shareholder friendly actions and event risk. At an industry level, this includes REITs, Media, Telecom, and Utilities. Specific industry and company related commentary that fall within these categories is included on page 3.

In summary, we expect the investment grade Corporate bond sector to post positive excess returns in 2010 driven by carry and spread tightening, as spread compression continues among industries and ratings.

Supplemental Commentary


Finance

Insurance

Insurance, like Banks, is a sector that continues to face challenges but we believe offers investors compensation for the risk. Like all Financial sectors, Insurance spreads continue to be wide of their historic average relative to other Industrial/Utility sectors. The OAS of the Barclays insurance segment of the Index was 250 bps at year-end 2009, or 155% and 180% of the Utility and Industrial sectors, respectively vs. historic averages of 115% and 119%, respectively. We can support the stronger credits in the Life and P&C sectors given the improvements that have been made, regulatory support shown, and the recovery that is underway at the macro and market levels.

The U.S. life insurers raised approximately $10 billion of capital in 2009 to manage downward rating migration and capital pressure from investment asset write-downs. The U.S. P&C insurers experienced lower catastrophe losses and improved investment portfolios in 2009, but still face heavy competition and decreased premium levels. Reinsurers in the U.S. and Bermuda performed strongly in 2009, but the sector’s strong equity position and its ability to access the capital markets will be tested if a large catastrophe event occurs. The U.S. health insurance sector continues to be hurt by weak economic conditions and the ongoing uncertainty regarding health care reform.

Commodity Related Sectors

Metals & Mining

In 2010, we expect commodity prices to remain off the lows of early 2009. We anticipate a general improvement in demand as consumption grows in emerging markets. The pace of recovery will depend on how certain challenged global end markets recover, including automotive and commercial construction. Many companies in the sector have improved their liquidity positions as debt and equity markets re-opened in 2009. Most of the larger more diversified companies entered 2009 with strong balance sheets, helping stem some of the pressure from free cash flow leakage. We also continue to expect consolidation of the industry in 2010, as the larger, more diversified companies buy the more specialized, lower rated companies. We expect issuance to be light/moderate in 2010 depending on M&A activity.

Energy

In 2010, we believe oil should be in the $65 – $70 per barrel range and natural gas should approximate $5 per thousand cubic feet.  As a result, we have a positive view of the credit fundamentals for the independent and oil field service segments.  We believe that in a $70 oil and $5 gas environment, the vast majority of the energy sector should be able to fund capital expenditures and dividends internally.  However, we believe total debt will increase in the sector in 2010, due to debt-funded share repurchase activity and M&A related issuance.  Additionally, refinancing activity in the Energy sector is expected to exceed $5 billion in 2010.  We expect ConocoPhillips to be an active refinancer with more than $1.4 billion maturing in the second quarter of 2010.

Consumer Defensive

Food & Beverage

In 2010, we expect the Food & Beverage industry to perform well fundamentally. Consumers continued to spend their dollars on food and beverage products despite the deep global recession. Having said that, we expect consumers to remain focused on price and there are numerous cases of “trading down” from premium brands.   Diversification and economies of scale for investment grade companies in this sector help to alleviate pressure from changing consumer activity. Overall, we would expect a very minor pick-up in consumption as the global economy recovers. We are focused on those companies with strong brands that have (Anheuser-Busch Inbev), or are expected to (Kraft), engage in M&A activity and intend to capitalize on the new issuance that will be needed to fund those deals. We expect to see consolidation in this industry with the potential transaction between Kraft and Cadbury serving as the catalyst. We anticipate a moderate amount of issuance for the sector in 2010.

Growth Obstacles

Electric Utilities

We have a negative view of the Electric Utility sector in 2010 given the defensive characteristics of the industry, the capital requirements necessary in the next several years and political threats (EPA pollutant rules, Cap and Trade legislation, etc). We believe that the credit profiles for much of the sector could deteriorate moderately as the sector in aggregate will be free cash flow negative. We expect that issuance in 2010 should be in the $50 billion range and would not be surprise if some issuers pre-funded their 2011 requirements given the low interest rate environment.


This information is developed using publicly available information, internally developed data and outside sources believed to be reliable.  While all reasonable care has been taken to ensure that the facts stated and the opinions given are accurate, complete and reasonable, liability is expressly disclaimed by AAM and any affiliates (collectively known as ‘AAM’), and their respective officers and employees.  Any opinions and/or recommendations expressed are subject to change without notice.

This information is distributed to recipients including AAM, any of which may have acted on the basis of the information, or may have an ownership interest in securities to which the information relates.  It may also be distributed to clients of AAM, as well as to other recipients with whom no such client relationship exists.  Providing this information does not, in and of itself, constitute a recommendation by AAM, nor does it imply that the purchase or sale of any security is suitable for the recipient.

December 2, 2009 by

After a long run of positive excess returns, the Corporate Index posted a modestly negative month of excess returns in November, -8 bps (basis points) per Barclays. This was mainly due to the poor performance of hybrids, specifically relating to banks that received state aid in Europe. Excluding hybrids, the Index would have posted +4 bps. The OAS of the Index closed the month at 207 bps, 189 bps excluding hybrids.

Economic data was once again the focus for investors, and one topic in particular that garnered attention was the small business sector of the U.S.. There are a couple of often used measurements for the health and sentiment of this sector. First, is the quarterly Business Employment Dynamics (BED) survey from the Bureau of Labor Statistics, which reports job creation and destruction by firm size albeit at a considerable (8-month) lag. The data collection started in 1992 and shows that approximately one-third of the job growth since that period was due to the small business sector. However, in the initial stage of economic recoveries, the percentage is larger. Thus far, the BED survey is not signaling a proportionally higher retrenchment in jobs in the small business sector vs. medium and large, but again, the survey is dated.

A more forward looking measure of small business sentiment is the NFIB optimism survey, which has collected data since 1973. The recent data continues to show improvement after a low of 81 posted in March 2009 (Note: The lowest reading for the Index was 80.1 in April 1980), but absolute sentiment and conditions remain very weak. The last number reported on November 10 for October 31, 2009 was 89.1. There are many interesting points to highlight. Notably, in the 1980-1982 recession, the Index was below 90 for one quarter. In this recession, its been below 90 for six quarters. Moreover, levels below 90 were also seen in 1974 when Treasury yields were 7-8% and rising, the Bank Prime loan rate ranged from 9-12%, and BBB Corporate bond yields were 10+%.[1]

Many point to the inability to obtain credit as the reason for small business struggles, although the data does not necessarily point to it as the primary reason. The Federal Reserve’s senior loan officer survey shows an improvement in tightening standards for commercial and industrial loans (C&I) for small firms, although very few banks eased standards.   The NFIB survey also reported that 29% of small businesses reported all of their borrowing needs met (for reference, 36% reported the same in 2006-2007) vs. 9% who reported problems obtaining desired financing (6-7% in 2006-2007). And, a modest 4% said that financing and interest rates were their “most important problem” as opposed to 33% that cited poor sales, 22% taxes, and 11% government regulations and red tape. As one would expect, interest rates were a much bigger factor pre-1990 when 10-35+% of respondents reported this as their main issue. This compares to “poor sales” as a main issue, which was never this high. We are not saying that tight credit conditions are not one of many problems plaguing small businesses, but it is not the main problem or problems for that matter. The lack of demand for credit is more likely due to the record low levels of capital spending (current and expected), decreasing inventory stocks and prices and thus, sales and profits.

Lastly, what does all of this mean for unemployment and GDP? The current NFIB data shows that a seasonally adjusted net-negative one percent of owners plan to create new jobs. We did a simple regression, using the NFIB data, quarterly change in U.S. real GDP, U.S. initial jobless claims, and U.S. unemployment. What we found is although the NFIB data is a very good leading indicator and therefore, statistically significant for each variable, it is not a good predictor of the ultimate value due to the lack of explanatory power. The R-squared in each regression never exceeded 35% despite adjusting for time lags, etc. As Exhibit 1 shows, the time lag between the trough of the NFIB Index and the peak of unemployment in recessionary periods ranges from three years to less than one.

Exhibit 1: Small Business Optimism and Unemployment

Source: Bloomberg

The conclusion we draw is that the availability of credit alone will not fix the small business problem nor should it. We continue to believe that U.S. consumers and businesses have seen the abyss and do not want to return. This means savings rates will remain higher and businesses more liquid and conservative. This should support a reduction in capacity and therefore, consolidation, a near term negative for job creation. What does this mean for the Corporate Bond market? We believe it supports Investment Grade spreads in general, as large businesses get stronger and investors consider it an attractive investment relative to more risky assets that are more exposed to lower tier, weaker firms and have rallied considerably this year.

This information is developed using publicly available information, internally developed data and outside sources believed to be reliable.  While all reasonable care has been taken to ensure that the facts stated and the opinions given are accurate, complete and reasonable, liability is expressly disclaimed by AAM and any affiliates (collectively known as ‘AAM’), and their respective officers and employees.  Any opinions and/or recommendations expressed are subject to change without notice.

This information is distributed to recipients including AAM, any of which may have acted on the basis of the information, or may have an ownership interest in securities to which the information relates.  It may also be distributed to clients of AAM, as well as to other recipients with whom no such client relationship exists.  Providing this information does not, in and of itself, constitute a recommendation by AAM, nor does it imply that the purchase or sale of any security is suitable for the recipient.

[1] Federal Reserve – https://www.federalreserve.gov/releases/h15/data.htm

November 2, 2009 by

The demand for Corporate bonds, especially those with wider spreads, continues. The excess return for October (Barclays Corporate Bond Index – “Index”) was 89 basis points (bps) or 73 bps, excluding hybrids. Finance outperformed Utilities and Industrials, posting 162 bps of return vs. 56 bps and 47 bps respectively. The OAS was 206 bps at month-end compared to 555 bps at year-end 2008. Over the last 20 years, the low point (OAS) was 51 bps in July 1997, ranging from Utilities at 38 bps to Industrials at 58 bps.   The yield at that time for the Index was 6.61%, very close to the 20 year mean of 6.74%. The yield for the Index at 10/28/09 was 4.78%, exemplifying the very low rate environment that we are in today.

A lot has changed since 1997. The size of the Index measured by the amount outstanding ($)has changed, growing 135% since 1997, while the number of issues has been reduced by 22% since 1997. This reflects the larger, more liquid deals that facilitate trading and hence, lead to more volatility. The participants in the Corporate market have also changed with a greater number of hedge funds and other trading oriented firms looking to Corporate bonds for investment opportunities (Exhibit 1). Oddly, two things have not changed. First, the credit rating of the Index remains A2/A3, and second, the primary sector composition is virtually the same.

Exhibit 1
AAM Corp Credit 11-09 1
Note: Alternative buyers reflect the percent change in asset increase annually; Insurance is as % of the total holders of Corporate and Foreign bonds. Sources: Federal Reserve Flow of Funds, Thomsen Financial Platinum Database, ABS Alert Van Hedge Fund Advisors International, Hedge Fund Intelligence, Bloomberg, Dealogic’s CP Wave, Merrill Lynch Survey.

Change and specifically, volatility become evident if one splits the last 20 years into decades. Table 1 shows the volatility of Corporate spreads over a 20 year period. Simply, the last 10 years have been less rewarding for bondholders than the prior 10.   The annualized total return over the first 10 years for investors in the Index was 8.31% vs. 6.51% over the last 10. And, as you see below, the risk/reward has certainly been less favorable especially for Financials.

TABLE 1 1989-2009 1989-1999 1999-2009
OAS – Mean Corporate 170 84 176
(bps) Industrials 169 93 173
Utilities 173 71 179
Financials 172 90 176
OAS – Std Deviation Corporate 113 23 114
Industrials 89 25 89
Utilities 103 19 103
Financials 156 35 159
OAS/Std Dev Corporate 2 4 2
Industrials 2 4 2
Utilities 2 4 2
Financials 1 3 1

Source: Barclays

Putting the past behind us, the more important question is what can we expect over the next 10 years? Even though spreads have tightened considerably this year, we note that many sectors have not even approached the tights over the last two years let alone the last 10. It is evident from the graph (“Exhibit 2”) below that given the economic and government/fiscal uncertainty, the Corporate bond market continues to demand payment for sectors that are more vulnerable. We believe this higher dispersion around the mean will persist in the near-to-intermediate term or at least until the economy begins to improve organically.

Exhibit 2 AAM Corp Credit 11-09 2

The message rings clear to us. Spread volatility has increased and with default risk expected to remain high over a longer time period[note]Bank of America Merrill Lynch “From Matterhorn to Matanuska” 9/16/2009 – Predictions include: twin default peaks in late 2009and a lower peak in late 2012, a slower rate of improvement from the peak in 2012, cumulative defaults reaching 40% vs. 30% in previous cycles, and a slower return to below average default rates, specifically taking 7-8 years to fully play out vs. the 5-year normal cycle duration.[/note], credit selection is critical. We continue to believe investing defensively and not solely reaching for the highest yielding asset today is critical in this environment for both total return and principal and interest preservation. In 2010, we believe there will be periods of spread widening given our expectation for muted GDP growth, as the government stimulus wanes. Consequently, we generally favor sectors that will benefit from demand overseas, government support, and inventory restocking while avoiding those that are susceptible to event risk or heavily dependent on housing, commercial real estate and/or discretionary consumer spending.


This information is developed using publicly available information, internally developed data and outside sources believed to be reliable.  While all reasonable care has been taken to ensure that the facts stated and the opinions given are accurate, complete and reasonable, liability is expressly disclaimed by AAM and any affiliates (collectively known as ‘AAM’), and their respective officers and employees.  Any opinions and/or recommendations expressed are subject to change without notice.

This information is distributed to recipients including AAM, any of which may have acted on the basis of the information, or may have an ownership interest in securities to which the information relates.  It may also be distributed to clients of AAM, as well as to other recipients with whom no such client relationship exists.  Providing this information does not, in and of itself, constitute a recommendation by AAM, nor does it imply that the purchase or sale of any security is suitable for the recipient.

October 1, 2009 by

The corporate bond market posted another positive month of excess returns (79 basis points for Barclays Corporate Bond Index). Spread tightening continues in all broad sectors with Finance outperforming, as compression continues between Finance and Utilities/Industrials (Exhibit 1). However, like the equity market, the corporate market has softened recently, as the economic data has been weaker than expected and headlines about unemployment, foreclosures, and budget deficits persist, reminding all of us that a strong recovery is not a “sure thing.” Unlike the consensus of a “V” shaped recovery, we continue to position portfolios for a “U” shaped recovery. We remain concerned with the consumer, housing (both commercial and residential), the government’s role (i.e., exit strategy), and the strength of a recovery on the back of businesses that face more stringent regulation and the prospect for higher taxes, direct and indirect.

Exhibit 1

AAM Corp Credit 10-09 2

Source: Barclays Capital Market Analytics

Business investment, not consumer spending, has been cited as the source for near term GDP growth not only for the U.S., but for many other countries as well. Economists focus on the inventory drawdown or “output gap” that exists and the positive effects the inventory re-build will have on GDP growth and inflation. We also look to other sources of business investment, mergers and acquisitions (M&A) and capital spending, and note the very low levels at which they are at today and the cash that is available (Exhibit 2). A “U” shaped recovery lends itself to M&A, as companies need to consolidate to accelerate growth. Therefore, we believe this will increase, especially in low/no growth industries such as Finance, Telecommunications, Media, and Consumer Products. Capital spending is more difficult to forecast given management’s reluctance to invest in a weak global economy. We expect industries that are commodities based, like Energy and Metals and Mining, to increase capital spending given the demand from Asia and other higher growth countries.

We anticipate less investment being made in special dividends and share repurchases due to the competing investment opportunities that exist, as more companies are looking to sell or shed assets and at the same time, acquisition multiples are lower and financing is still relatively cheap.

Exhibit 2

AAM Corp Credit 10-09 1

This outlook keeps us positive on business led growth, which should help temper the negative drag from the consumer and withdrawal of government spending. However, recognizing the importance of both the consumer and government in this recovery, it also keeps us defensive and highly selective with credits and industries.

This information is developed using publicly available information, internally developed data and outside sources believed to be reliable.  While all reasonable care has been taken to ensure that the facts stated and the opinions given are accurate, complete and reasonable, liability is expressly disclaimed by AAM and any affiliates (collectively known as ‘AAM’), and their respective officers and employees.  Any opinions and/or recommendations expressed are subject to change without notice.

This information is distributed to recipients including AAM, any of which may have acted on the basis of the information, or may have an ownership interest in securities to which the information relates.  It may also be distributed to clients of AAM, as well as to other recipients with whom no such client relationship exists.  Providing this information does not, in and of itself, constitute a recommendation by AAM, nor does it imply that the purchase or sale of any security is suitable for the recipient.

  • « Go to Previous Page
  • Page 1
  • Interim pages omitted …
  • Page 9
  • Page 10
  • Page 11
  • Page 12
  • Go to Next Page »

Get updates in your inbox.

  • Investment Strategies
    • Investment Grade Fixed Income
    • Specialty Asset Classes
  • Our Clients
    • Client Experience
    • Sample RFP Download
  • Insights
    • Video
    • Webinar
    • News
    • Podcasts
  • About
    • Our Team
    • Contact
    • Client Login

Disclaimer: Asset Allocation & Management Company, LLC (AAM) is an investment adviser registered with the Securities and Exchange Commission, specializing in fixed-income asset management services for insurance companies. Registration does not imply a certain level of skill or training. This information was developed using publicly available information, internally developed data and outside sources believed to be reliable. While all reasonable care has been taken to ensure that the facts stated and the opinions given are accurate, complete and reasonable, liability is expressly disclaimed by AAM and any affiliates (collectively known as “AAM”), and their representative officers and employees. This report has been prepared for informational purposes only and does not purport to represent a complete analysis of any security, company or industry discussed. Any opinions and/or recommendations expressed are subject to change without notice and should be considered only as part of a diversified portfolio. A complete list of investment recommendations made during the past year is available upon request. Past performance is not an indication of future returns. This information is distributed to recipients including AAM, any of which may have acted on the basis of the information, or may have an ownership interest in securities to which the information relates. It may also be distributed to clients of AAM, as well as to other recipients with whom no such client relationship exists. Providing this information does not, in and of itself, constitute a recommendation by AAM, nor does it imply that the purchase or sale of any security is suitable for the recipient. Investing in the bond market is subject to certain risks including market, interest-rate, issuer, credit, inflation, liquidity, valuation, volatility, prepayment and extension. No part of this material may be reproduced in any form, or referred to in any other publication, without express written permission. *All figures shown are approximate and subject to change from quarter to quarter. **The accolades and awards highlighted herein are not statements of any advisory client and do not describe any experience with or endorsement of AAM as an investment adviser by any such client.

Copyright © 2024 AAM | Privacy and Disclosures

  • LinkedIn
  • YouTube