Market summary
The Investment Grade (IG) Corporate bond market (per Bloomberg Barclays Index) struggled in the third quarter, as spreads widened. Excess returns over Treasuries were slightly negative at -0.2%, but with the Treasury yield rally, total return was 3.1%. The IG market outperformed the S&P Index, which returned 0.9% and High Yield market (per Bloomberg Barclays Index) at 1.1%.
The risk asset rally in the first half of the year started to stall in the third quarter, as investors became more concerned with the economy. As the probability for recession has increased, so have risk premiums for weaker credits. This was exemplified in the third quarter by weakness in the IPO market (Renaissance IPO Index -10.1%), small caps (Russell 2000 Index -2.6%), and CCCs (Bloomberg Barclays CCC -1.8 %). The leveraged loan market has struggled of late as well. While credit remains available as reflected by the strong demand in September for new issue IG credit and weekly data from banks, the weakness in these higher risk segments of the markets coupled with projected GDP growth are not constructive for spreads in the near term.
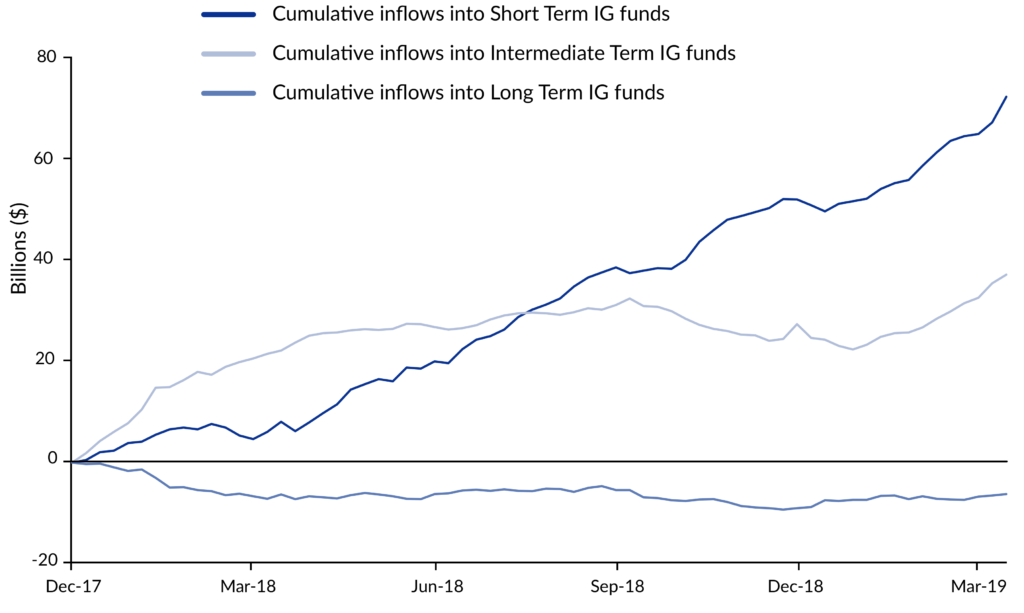
IG corporate credit spreads have been supported by very strong technicals, and we expect this to continue in the near term. Demand for USD bonds as measured by ETF and foreign buying has increased this year, and net debt issuance (i.e., supply) is at a post-crisis low. M&A activity has slowed despite very compelling financing costs for companies, which reflects uncertainty in the C-Suite regarding global growth and domestic policies, a situation that is unlikely to abate as we enter an election year. This makes it more likely that issuance remains low in 2020 and debt leverage for companies stable/improving, in addition to keeping fixed investment (capital spending) depressed.
Market outlook
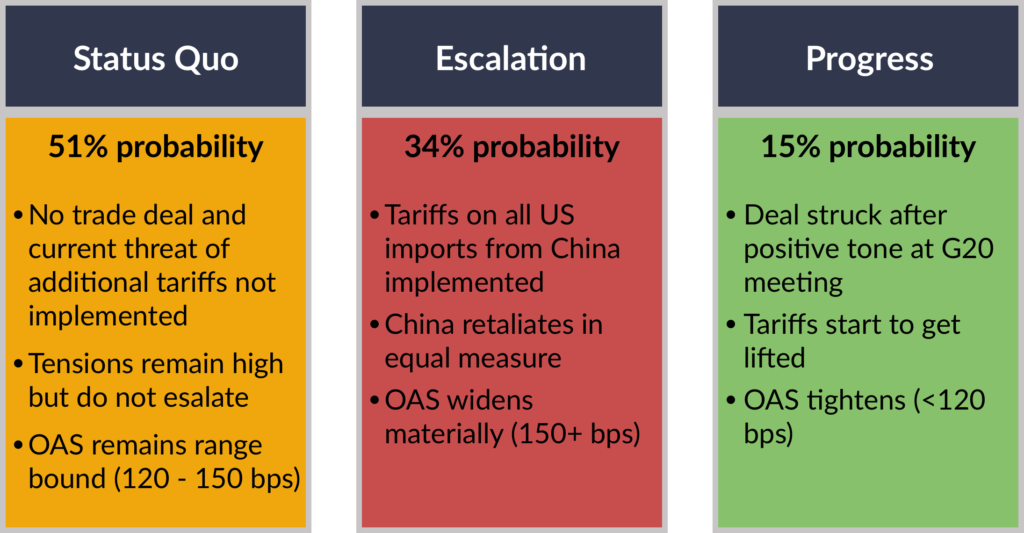
For the fourth quarter of 2019, we expect central banks to remain dovish, but the trajectory of economic growth remains concerning. The risks to the downside for U.S. GDP growth have increased with: (1) disappointing ISM reports and leading indicators that point to further downside (2) softening business confidence which suggests investment growth could slow further, and (3) slowing job creation and hours worked with top line pressures increasing cost cutting rhetoric. However, positive data points include the stabilization in China manufacturing PMI and a rebound in the U.S. housing market. A more constructive tone towards trade is helpful, but we remain skeptical that this issue will be resolved before the election.
In summary, due to very strong technicals, current spreads reflect stronger fundamentals than those that exist today or that we anticipate in the near term. The heightened level of uncertainty and the expansion and resulting debt created post financial crisis alongside challenging demographics diminish growth potential. Low rates have worked to fuel investment and capacity, and as expectations are revised and lower growth rates are accepted, we would expect to see that start to rebalance and impact demand. This means we would expect risk to reprice in this next phase of the cycle and defaults to creep higher. While we would expect spreads to widen before fundamentals improve, as the cycle plays out, we recognize timing of this is difficult.
We entered October with a neutral opinion on the IG Corporate bond sector given our view that technicals would remain supportive and we would avoid a recession in the near term. As spreads have rallied this month in reaction to the potential trade agreement with China, we are selling BBB rated credits that have outperformed. We are recommending a defensively positioned Corporate portfolio given the increased economic risks and lack of appropriate risk premiums (industry, credit quality, and maturity). We are in a position to add risk when spreads become more attractive and continue to take advantage of attractively priced opportunities.
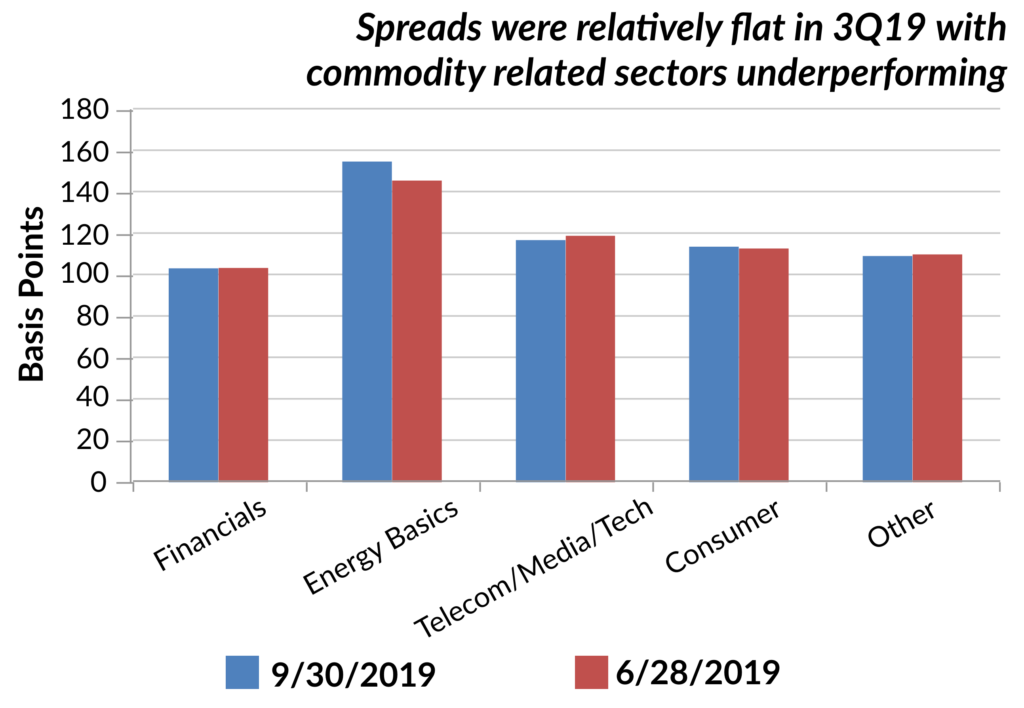
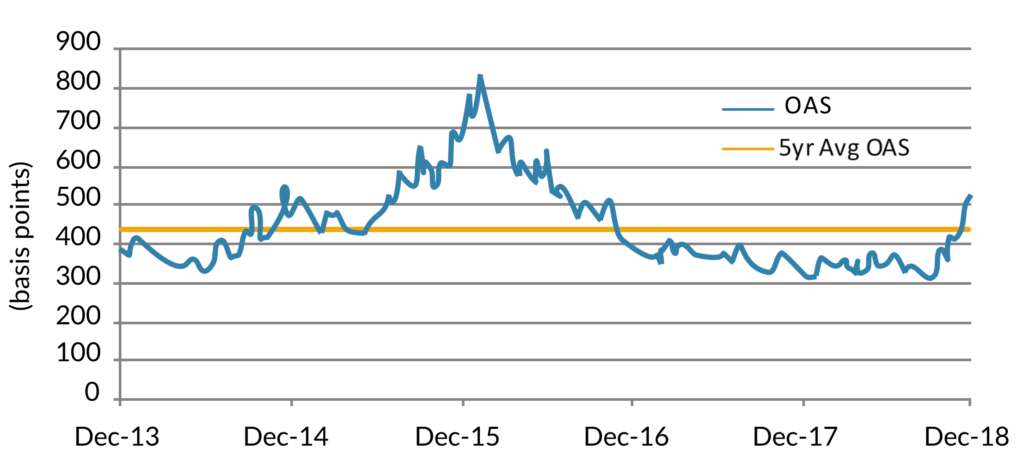
Figure 1
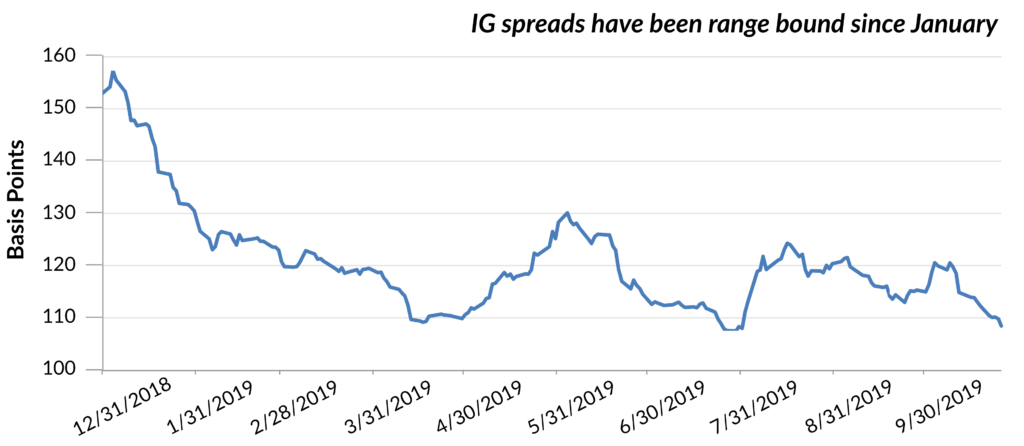
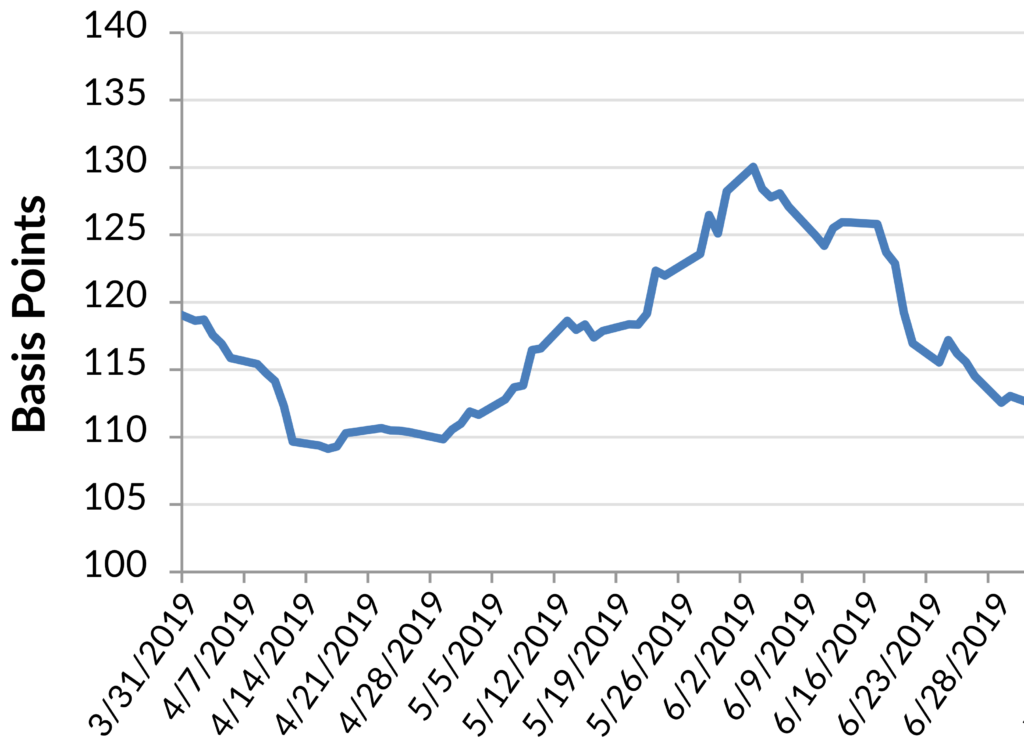
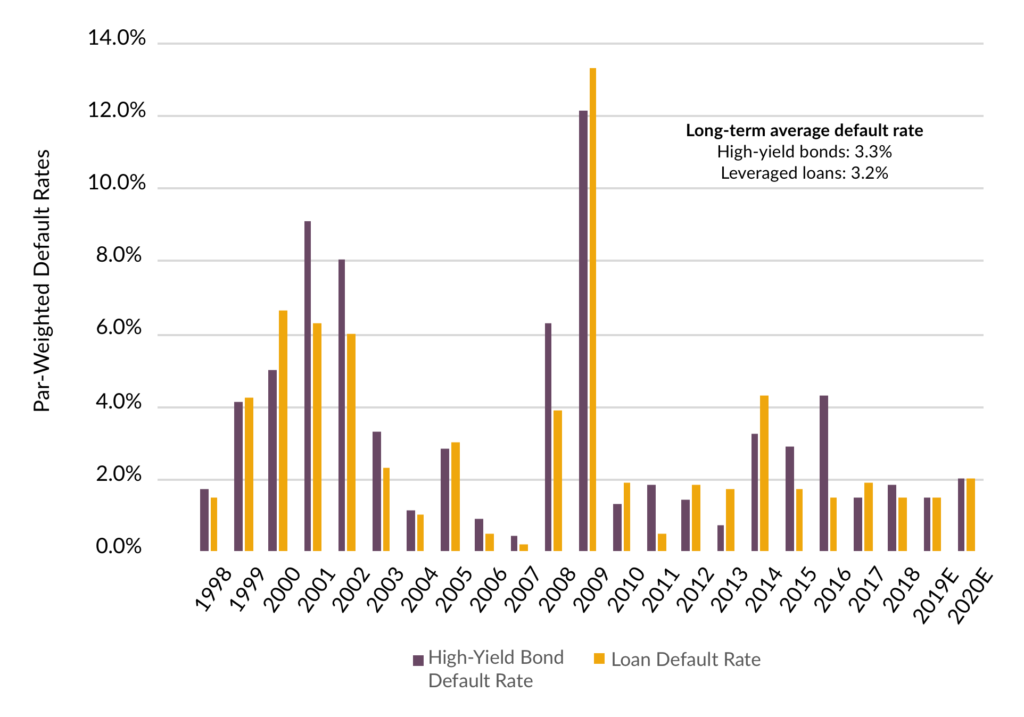
Figure 2