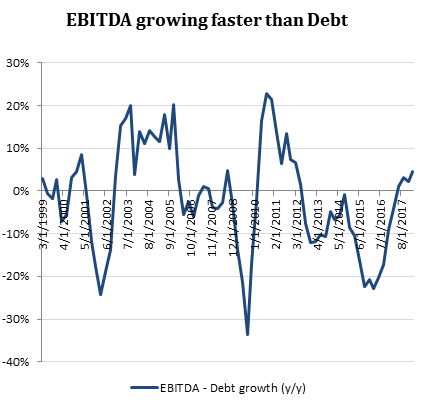
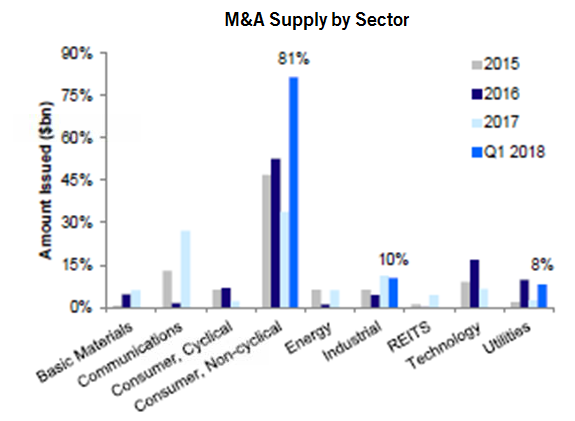
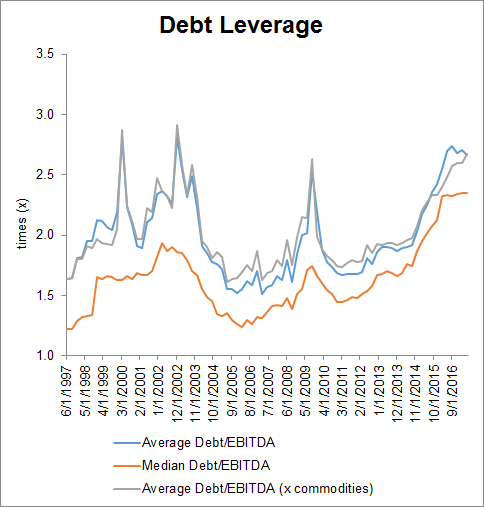
Post tax reform, investors expected debt supply would decline. Year-to-date, gross debt issuance is on track to be 8% lower than 2017, as companies are working down debt used to fund acquisitions and/or higher interest costs and the new tax law are discouraging debt financed share repurchases. But despite higher rates of EBITDA growth, debt leverage has declined very little. To work their way out of higher levels of debt leverage, companies need growth to continue at these higher rates or shareholders will see less return via curtailed share repurchase programs or, worse yet, dividends.
With debt leverage as high as it is today, credit ratings are at risk of falling if an economic slowdown occurs earlier than expected. We believe about 5-10% of the Investment Grade (IG) market is at risk of falling to high yield (HY) if a recession occurs in the next 12-24 months. This is expected to have a meaningful impact on portfolio performance given the spread widening and potential other costs for investors who hold “index like” portfolios or those with a higher level of credit risk.
Why has leverage increased?
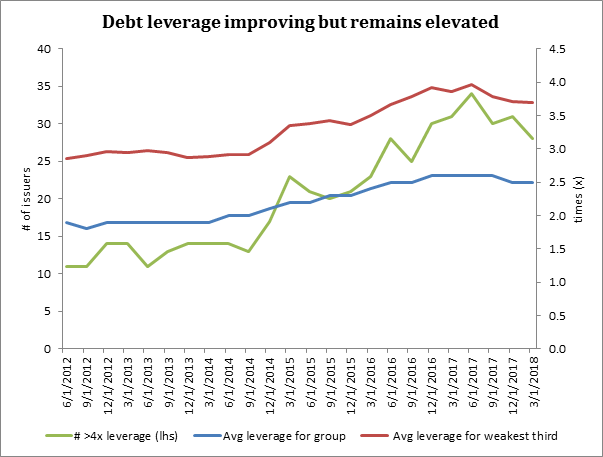
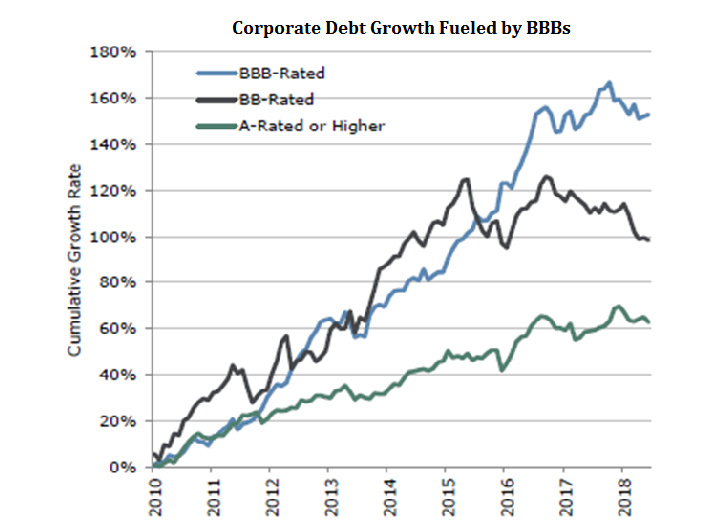
In 2009, the number of firms with more than 3.5x debt-to-EBITDA leverage doubled versus 2005 due to the contraction in EBITDA caused by recessionary conditions. Companies worked to improve their balance sheets by 2012. After this, as economies stabilized (albeit at relatively low growth rates) and debt costs were extremely low, companies added debt at a fairly aggressive pace. The majority of this debt was added to fund: (1) acquisitions in order to reduce expenses and add businesses with growth potential and (2) share repurchase programs to enhance shareholder return (and likely meet performance targets for management teams). Today, there are more firms with leverage in the 2-3.5x range, commensurate with BBB ratings, and fewer firms with leverage less than 1x, which is typically reflective of AA or AAA ratings. Unless interest rates meaningfully increase, we do not expect companies to return to the days of pristine balance sheets.
Exhibit 1: Composition of Debt Leverage for Non-Financial Companies
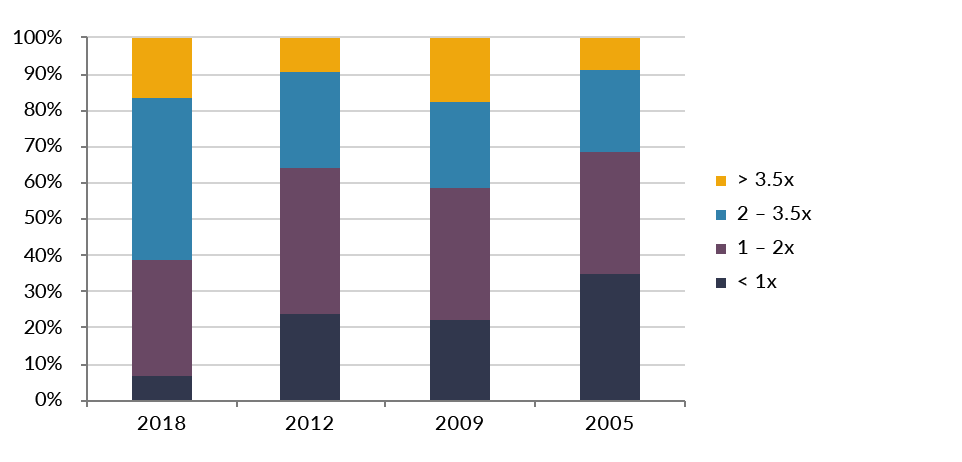
(Includes over 350 IG issuers as of 6/2018, excluding Utilities, Financials, Autos and Construction Machinery); Leverage is measured as: Debt/EBITDA(x) and percentages based on issuer count.
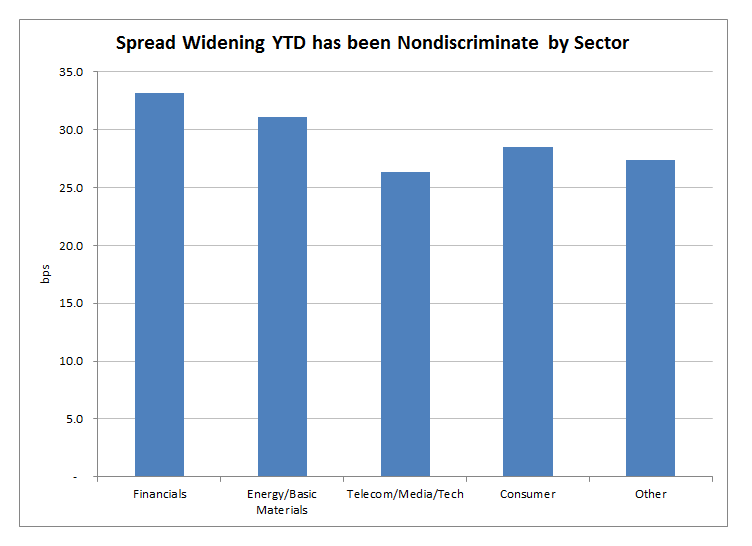
Are some industries safer than others?
Looking at the issuers in the market today, excluding those with naturally high leverage such as Utilities, Financials, and companies with Captive Finance companies, we note that the number of issuers with elevated leverage is similar to 2009. While we recognize the increase in BBB rated debt in the marketplace, we note that many firms that have increased debt leverage commensurate with weak BBB ratings (i.e., leverage greater than 3.5x) are consumer related, which should have less cyclical cashflows. That said, these firms are relying on growth and, for some, asset sales to reduce debt over the near to intermediate term. This strategy will be placed at risk if the economy slows materially and/or asset values fall, as we witnessed in October with the drop in the stock market. Therefore, even the most “defensive” credits are not immune to downgrade risk.
Exhibit 2: Highly Leveraged IG Issuers by Sector vs. Prior Cycle
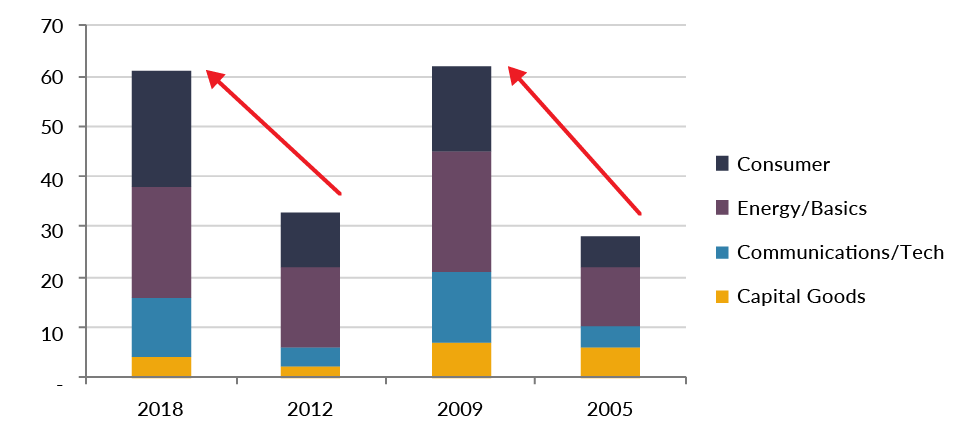
(Includes over 350 IG issuers as of 6/2018, excluding Utilities, Financials, Autos and Construction Machinery) “Highly leveraged” = firms with Debt/EBITDA exceeding 3.5x
What is the downgrade risk to portfolios?
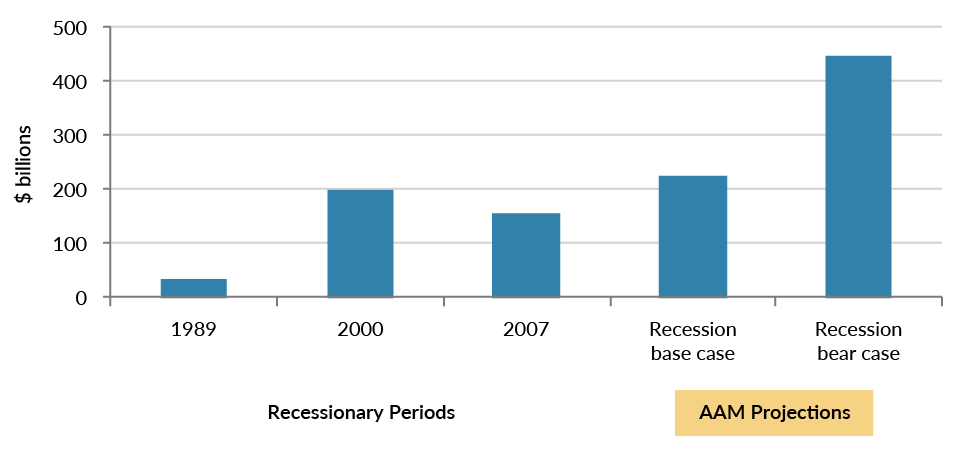
Today, as we review this list of approximately 60 issuers with elevated debt leverage, we estimate about one third will be downgraded to high yield if a recession were to occur in the next one to two years. Adding Financials to our analysis, we believe the sectors and issuers most vulnerable if a recession were to occur are low BBB rated and, in the REIT, Finance and asset management sectors as well as low BBB rated subordinate debt. Utilities are not likely to be materially impacted. In total, we estimate $225 billion is at risk of falling to high yield with $445 billion as a bear case estimate (which includes low BBB rated subordinated bank debt, Charter, Ford and GM). That would imply 5-10% of the IG market falling to high yield. That is not outsized relative to the total IG or HY market versus prior recessionary periods. S&P states on average 5% of U.S. companies rated BBB have been downgraded to high yield, increasing in recessionary periods with 8% in 2009 and 9% in 2002.*
Exhibit 3: Downgrades from IG to HY ($B)
What is the impact?
While 5-10% appears to be relatively immaterial as a percentage of the IG market, it is material to the holder of the securities when they become HY rated especially if that holder is an insurance company.
First, the risk of default meaningfully increases when a bond falls to HY (from an average of 21 bps to 78 bps from BBB to BB respectively per S&P*), which requires an increase in the credit spread to compensate for that risk. In a period of increased risk of default, low quality IG bonds are not the only ones to widen. The correlation in Fixed Income is high, which means widening will occur in all rating categories to various degrees (e.g., A/higher credits may widen 50 bps vs. BBBs that widen 100-300bps). This will have an impact on the market value of the entire Corporate bond portfolio.
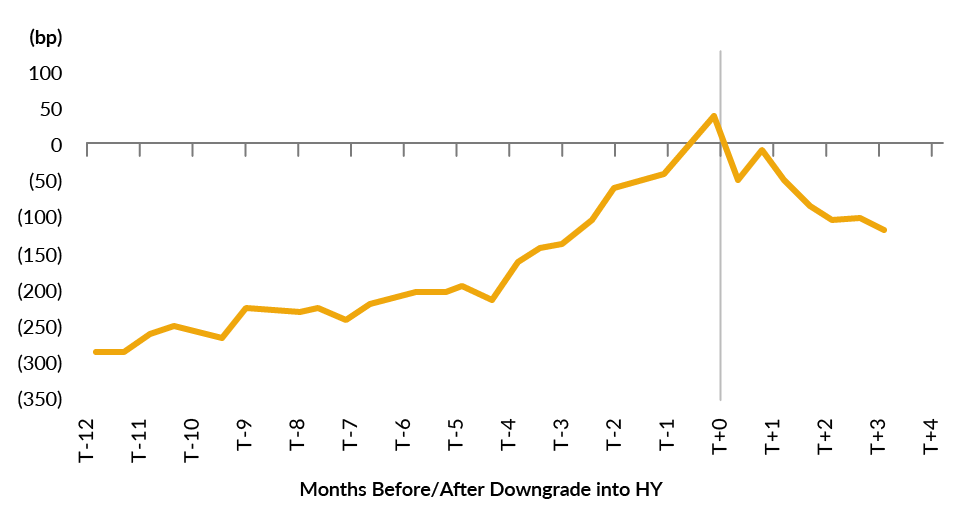
As it relates to the bonds that fall to HY, not only will spreads widen due to increased default risk, but they will widen for a period of time due to a supply and demand imbalance (see Exhibit 4). Many investors are forced to sell debt that falls to HY due to portfolio restrictions and/or guidelines. Exhibit 4 shows the typical pattern when an issuer is downgraded to HY. Spreads widen over 300 bps and then tighten from the point of being downgraded as supply and demand normalizes.
Now, what does this mean for a portfolio? Assuming a portfolio holds 10 year maturities with 50% in Corporate bonds, of which 5-10% are downgraded to HY, that would imply a fall in portfolio market value of approximately 1%. The widening in the other A and BBB bonds would add to that market value loss. Diversification in the portfolio is important, and this analysis assumes issuer weightings in the portfolio that are commensurate with the Corporate market as reflected by the Bloomberg Barclays Corporate Index.
In addition to these economics, there are rating agency and/or regulatory implications for insurance companies. Both RBC and BCAR will be negatively impacted by an increase in high yield holdings. This is especially true for companies with Equity holdings, as an increase of downgrades is likely to coincide with a sell off in the Equity market, will impacting capital levels. Moreover, life companies will be subject to higher asset valuation reserve (AVR) balances for HY bonds (exponential). Depending on current capital levels, meaningful downgrades to HY could place a strain on surplus for some insurers, particularly in the P&C space. This would be suboptimal since surplus is being impacted at a time when presumably investment and potentially business related opportunities are more plentiful.
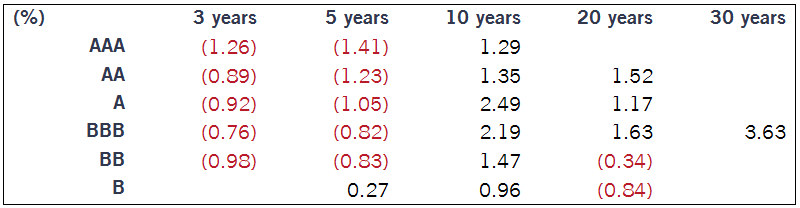
Exhibit 4: Cost of Downgrade: Fallen Angels
Is this risk being priced into the market?
Despite recent spread widening, it is clear that the difference in spread between issuers rated BBB vs. high yield is at multi-year tights. We believe now is the time to position the portfolio to avoid credits at risk of being downgraded (see sample of issuers in table below). We have been reducing our BBB exposure and are avoiding credits we believe are at risk of falling to high yield.
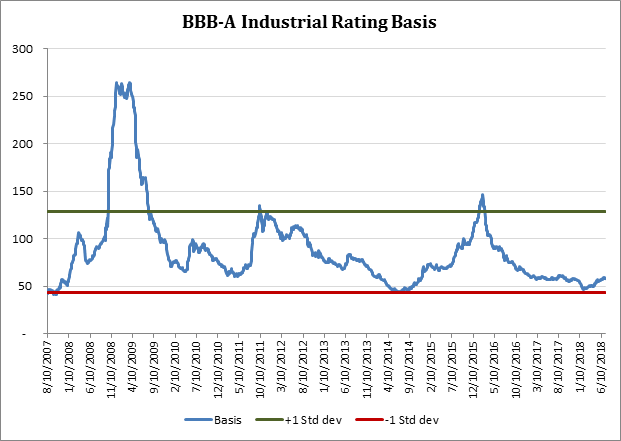
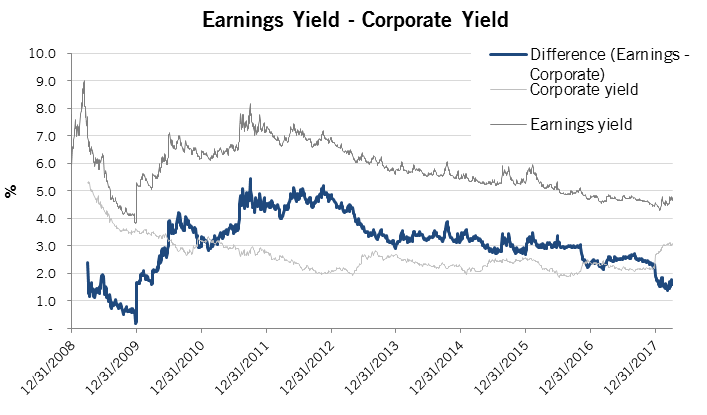
Exhibit 5: BBB and BB Spread Differential
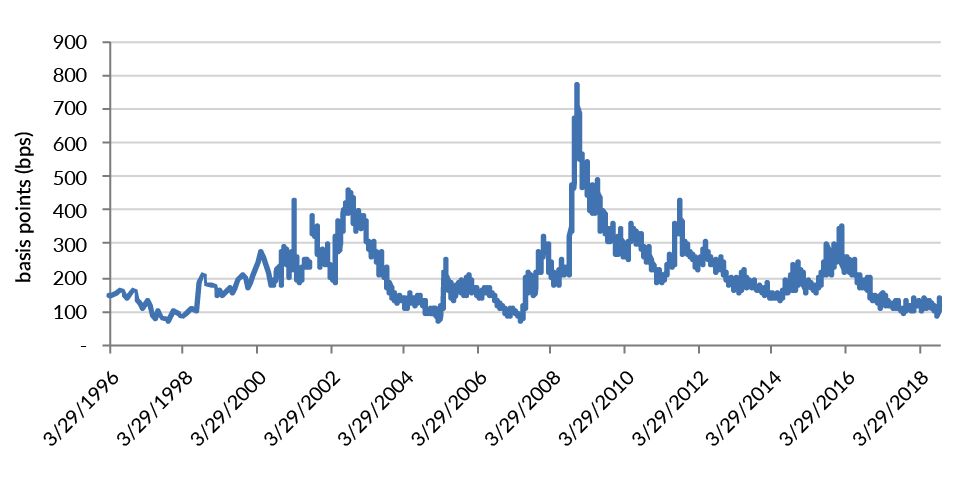
Source: AAM, Bloomberg Barclays Index as of 10/26/2018 (Corporate Index vs. BB High Yield Index)
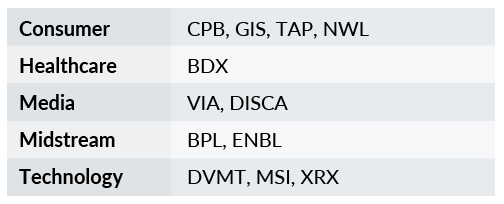
Sample of Credits at Risk
*S&P Report: Per S&P, the ‘BBB’ long-term, one-year weighted average default rate (since 1981) is 0.21%, less than a third of the one-year weighted averaged default rate for the ‘BB’ category (0.78%). CreditTrends: When The Cycle Turns: As U.S.’BBB’ Debt Growth Sparks Investor Concern, Near-Term Risks Remain Low Jul 25, 2018 Diane Vazza, Managing Director, New York