• Skip to primary navigation
  • Skip to main content
  • Skip to footer
AAM CompanyTransparent Logo

AAM Company

AAM Company Website

  • Investment Strategies
    • Investment Grade Fixed Income
    • Specialty Asset Classes
  • Clients
    • Our Clients
    • Client Experience
    • Download Sample RFP
  • Insights
    • Video
    • Webinars
    • Podcasts
    • News
  • About
    • Our Team
    • Events
  • Login
  • Contact Us
Contact

Corporate Credit View

April 22, 2015 by

Fallen Angels Expected to Increase

By Elizabeth Henderson, CFA
Director of Corporate Credit

Elizabeth Henderson

[toc]

Volatility increased this quarter with investment grade credit spreads widening 16 basis points versus Treasuries in the second quarter.  The main drivers of this widening included Greece, China, and increased merger and acquisition (M&A) activity.  M&A activity in the second quarter was the highest in twelve years.  We highlighted all of these issues in last quarter’s newsletter (The Top Five Issues That Will Affect Corporate Credit Spreads Today).

This quarter, we discuss the deterioration in investment grade credit fundamentals and what that means for investors when growth contracts and default risk increases.   We believe this will become a critical issue over the near-to-medium term.

Credit Quality Deterioration

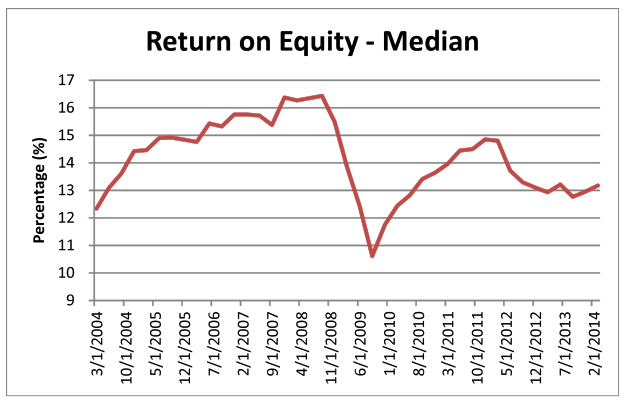
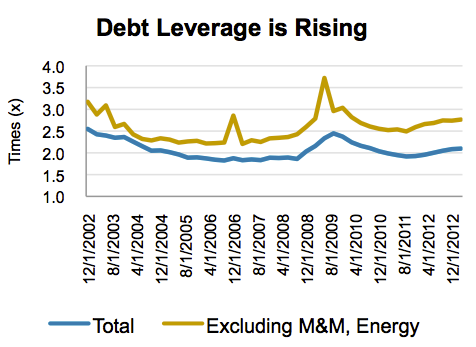
We have witnessed a marked decline in credit quality since mid-year 2014, as commodity prices have declined and debt has increased to fund shareholder returns and M&A.  When measuring the debt/EBITDA leverage of about 400 nonfinancial, nonutility investment grade credits and isolating the bottom third each quarter (defined as those with the highest debt leverage), leverage is approaching 4x, which is quite high considering the economy is still expanding.  As seen in Exhibit 1, leverage has increased when the economy contracts, resulting in increased downgrades to high yield.  While the rating agencies claim to assign ratings that reflect performance through an economic cycle, this has not generally proven to be the case.

Exhibit 1: Rating Downgrades to High Yield Expected to Increase

AAM Corp Credit Spring-2014 1

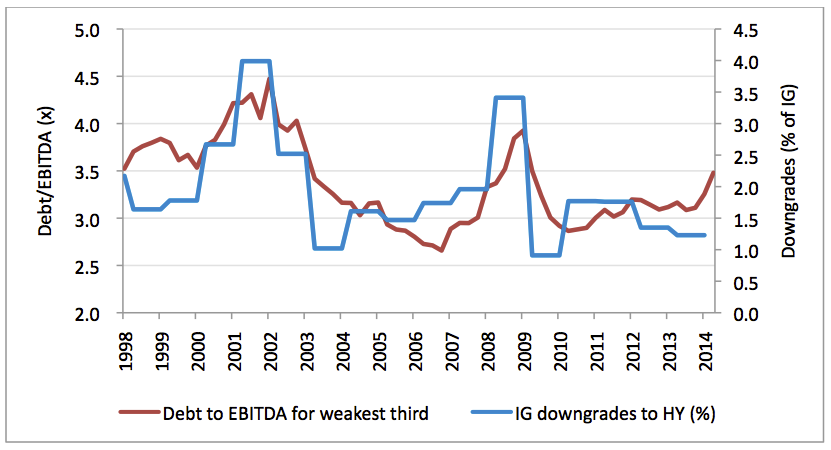
Sources: Leverage – AAM (Includes over 400 nonutility and nonfinancial companies); Downgrades – S&P 2014 “Annual Global Corporate Default Study and Rating Transitions,” Diane Vazza, April 30, 2015

Ratings Risk and Defaults

Simply, leverage is increasing and we expect rating actions to follow. As one would expect, increased leverage has been positively correlated with the percentage of investment grade companies that have defaulted, as shown in Exhibit 2.

Exhibit 2: Investment Grade Defaults Increase as Ratings Migrate Lower

AAM Corp Credit Spring-2014 2

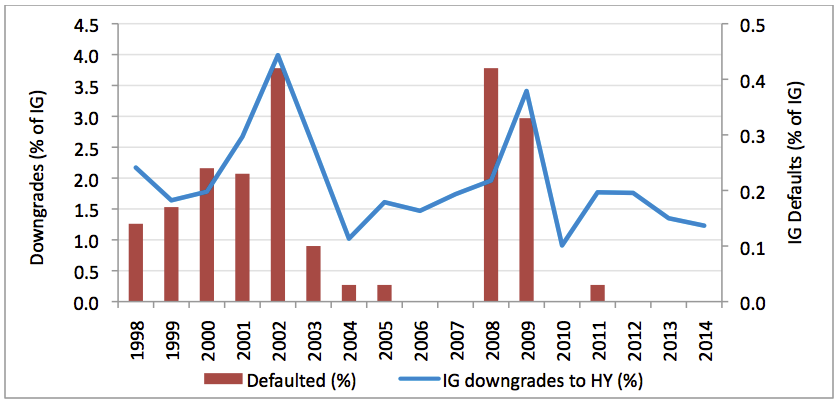
Source: Standard & Poor’s 2014 “Annual Global Corporate Default Study And Rating Transitions,” Diane Vazza, April 30, 2015

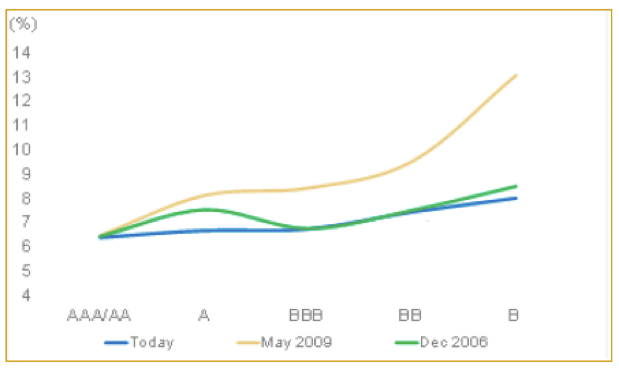
The first question to ask is “are investors getting paid for the risk?”  Our answer is “no,” we do not believe investors in low investment grade rated securities are being appropriately compensated.  As Exhibit 3 shows, a one notch downgrade into high yield should result in a one percentage point increase in spread versus Treasuries.  That has a material impact on the pricing of that security, and the default risk increases as well.

Exhibit 3: Rating Risk is Not Reflected in BBB- Securities

AAM Corp Credit Spring-2014 3

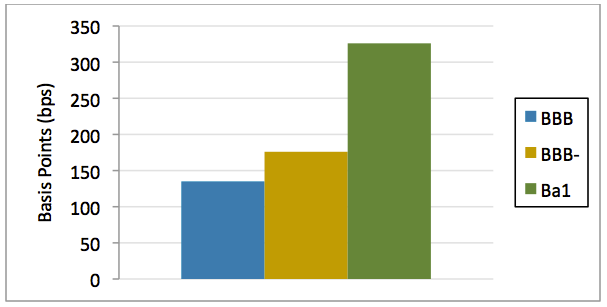
Source: AAM using five year maturities for BBB and BBB- rated securities; Barclays OAS for Ba1 rated securities with a duration of 4.8. 

Market Liquidity

The second question becomes “if investors are not getting paid for the risk, can they simply sell the security?”  Our answer is “it depends.”  In the equity market, if an investment analyst believes the stock will underperform, the stock can be sold into the marketplace.  The corporate bond market is an over-the-counter market, which means dealers act as intermediaries, quoting where bonds can be sold or purchased.  Regulators have made it more onerous for these intermediaries to hold positions due to increased capital requirements and tighter risk limits, resulting in a much smaller secondary debt market (Exhibit 4).  The decline from $280 billion in 2007 to a low of approximately $20 billion in 2014 is remarkable.

Exhibit 4: Net Primary Dealer Positions in Corporates, Commercial Paper, and MBS ($B)

AAM Corp Credit Spring-2014 4

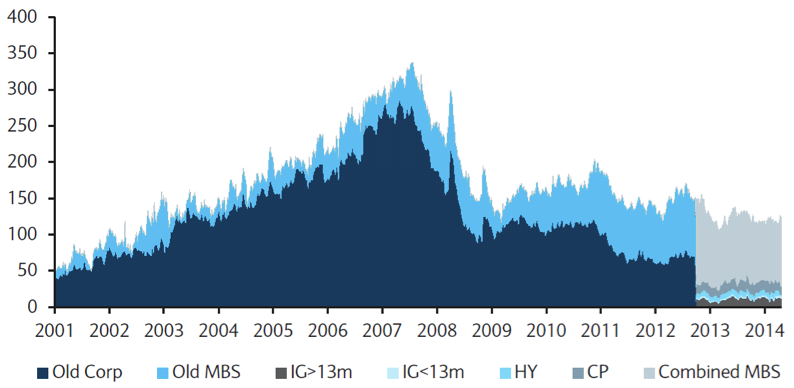
Source: Federal Reserve, Bloomberg, Barclays Research

While the secondary debt market has fallen in size, the amount of debt outstanding has increased, as interest rates have declined (Exhibit 5).  Where dealers used to control 4-5% of the market, they control less than 0.5% today.

Exhibit 5:  U.S. Investment Grade Corporate Debt Market ($MM)

AAM Corp Credit Spring-2014 5

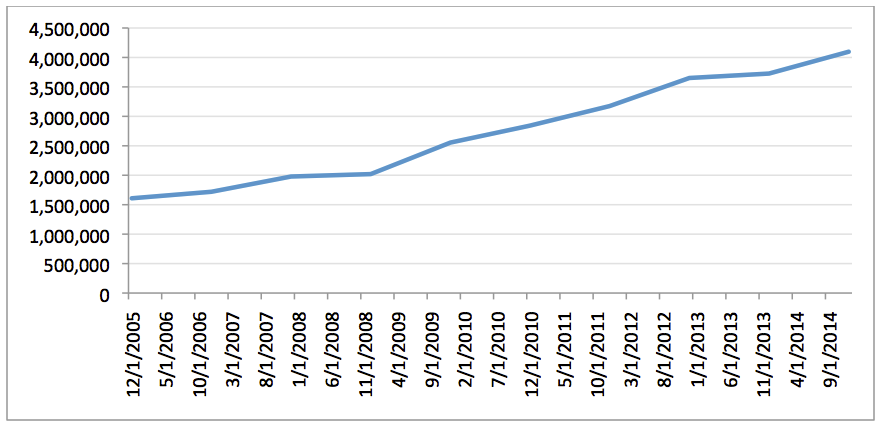
Source:  Barclays Corporate Index, AAM

The illiquidity of the corporate bond market has caught the attention of the Federal Reserve and has been the topic for many financial reporters.  Although many investment managers have talked about developing electronic trading platforms, they have failed to penetrate the market.  According to the Financial Times[note]Michael Mackenzie “Search for liquidity tests corporate bond market,” Financial Times, November 4, 2014, accessed July 20, 2015, https://www.ft.com/cms/s/0/9ee487fa-4e43-11e4-adfe-00144feab7de.html#axzz3gYs9Ufrj.[/note], Greenwich Associates, a consultancy, estimates that 16% of institutional trading of investment-grade bonds is done via electronic platforms.  And, while electronic trading is gaining some traction, it has involved smaller sized trades (i.e., less than $1 million) versus $5 million and higher.

Summary

Therefore, the bond market’s illiquidity may present challenges to larger managers who want to execute on the ideas originated by their investment staff.   At AAM, our size allows us to be nimble and gives our portfolio managers the opportunity to execute on the ideas our team originates.  We believe as the cycle matures and rating downgrades increase, smaller managers have a greater ability to differentiate and to outperform their larger peers.

Elizabeth Henderson, CFA
Director of Corporate Credit

For more information about AAM or any of the information in the Corporate Credit View, please contact:

Colin Dowdall, CFA, Director of Marketing and Business Development

colin.dowdall@aamcompany.com

John Olvany, Vice President of Business Development

john.olvany@aamcompany.com

Neelm Hameer, Vice President of Business Development

neelm.hameer@aamcompany.com

Disclaimer: Asset Allocation & Management Company, LLC (AAM) is an investment adviser registered with the Securities and Exchange Commission, specializing in fixed-income asset management services for insurance companies. This information was developed using publicly available information, internally developed data and outside sources believed to be reliable. While all reasonable care has been taken to ensure that the facts stated and the opinions given are accurate, complete and reasonable, liability is expressly disclaimed by AAM and any affiliates (collectively known as “AAM”), and their representative officers and employees. This report has been prepared for informational purposes only and does not purport to represent a complete analysis of any security, company or industry discussed. Any opinions and/or recommendations expressed are subject to change without notice and should be considered only as part of a diversified portfolio. A complete list of investment recommendations made during the past year is available upon request. Past performance is not an indication of future returns.

This information is distributed to recipients including AAM, any of which may have acted on the basis of the information, or may have an ownership interest in securities to which the information relates. It may also be distributed to clients of AAM, as well as to other recipients with whom no such client relationship exists. Providing this information does not, in and of itself, constitute a recommendation by AAM, nor does it imply that the purchase or sale of any security is suitable for the recipient. Investing in the bond market is subject to certain risks including market, interest-rate, issuer, credit, inflation, liquidity, valuation, volatility, prepayment and extension. No part of this material may be reproduced in any form, or referred to in any other publication, without express written permission.


October 15, 2014 by

Investment Grade Corporate Credit Remains Resilient Despite Heightened Volatility

By Elizabeth Henderson, CFA
Director of Corporate Credit

Elizabeth Henderson

[toc]

Market volatility has increased, and although investment grade corporate bonds outperformed riskier asset classes such as high yield (-1.9%) during the third quarter, spread volatility increased modestly.

In this newsletter, we support our near term outlook for corporate credit by focusing on two important drivers of expected performance for the fourth quarter 2014: energy prices and consumer spending. We expect spreads to tighten over the near term, as U.S. GDP growth meets or exceeds expectations and as oil prices stabilize. We also expect the negative market technicals we experienced in September to reverse. Lastly, we close the newsletter with a brief discussion of the private placement market. The biggest near term risk to our forecast is a retrenchment by the consumer due to Ebola concerns.

Corporate credit spreads widened due to falling commodity prices and technical pressure

Corporate credit spreads widened 13 basis points (bps) (Exhibit 1) in the third quarter with the majority of the widening taking place in September. Market volatility increased due to the uncertainties regarding the timing of Federal Reserve interest rate increases, geopolitical issues, the Ebola virus, and the impact slowing European and China growth will have on company fundamentals. Specifically, in regard to the Investment Grade (IG) Corporate bond market, we believe spread widening was driven more by: 1) lower commodity prices, affecting the Energy and Metals and Mining sectors, and 2) weaker market technicals. The expected supply of bonds increased due to a larger than expected amount of new bonds issued by companies in September ($70 billion for the first eight days in September versus a monthly estimate of $100 billion) as well as the threat of selling as a result of the changes at PIMCO.   In early October, spreads stabilized with demand increasing from mutual funds. However, entering mid-October, Treasury yields are falling and spreads are increasing in reaction to weaker than expected economic data and Ebola concerns.

Exhibit 1

AAM Corp Credit Fall-2014 1

Source: Barclays, AAM


Exhibit 2: Weekly mutual fund net flows in HG credit funds

AAM Corp Credit Fall-2014 2

Source: BofA Merrill Lynch Global Research, EPFR

The IG Corporate market generated 0.2% total return (-0.8% excess return) in the third quarter, as represented by the Barclays Corporate Index. As investors fled to higher quality securities, BBB rated securities generally underperformed (Exhibit 3), widening the basis between A and BBB rated Industrial securities from 44 bps at the end of the second quarter to 50 bps. Spread volatility picked up slightly in the third quarter, but still remains very low at 6 bps year-to-date.

Exhibit 3

AAM Corp Credit Fall-2014 3

Source: Barclays, AAM (YTD as of 10/9/14)

Last quarter, we wrote that we believed defensive, not bearish, positioning was appropriate given the low spread levels and increasing idiosyncratic risks. One can see the benefits of a more defensive portfolio, as shown by Exhibit 4, detailing the number of tickers that had excess returns greater or less than the mean. It is clear that last month’s performance was driven by a number of mid-to-low BBB credits, mainly in the Energy and Metals and Mining sectors.

Exhibit 4

AAM Corp Credit Fall-2014 4

Source: Barclays, AAM

Economic growth is accelerating from a weather driven first half of the year

Third quarter GDP for the U.S. is estimated at 3%, and domestic economic data has surprised to the upside in the third quarter. Importantly, the JOLTS (Job Openings and Labor Turnover) survey continues to report a higher level of job openings, now on par with what we experienced in 2001 (Exhibit 5). The rate at which employees quit their jobs (“quit rate”), a measure analyzed by the Fed, continues to lag. We note that the correlation between job openings and quit rate is quite high (0.8, using data since 2000); therefore, one could expect the quit rate to increase. Based on a regression analysis, about one third of wage growth can be explained by the quit rate with a correlation of 0.6. We continue to watch these measures closely since rising wage growth at a time of weak worldwide economic growth would negatively impact credit quality and result in wider spreads. We would expect rising wage growth to positively impact domestic economic growth, helping offset overseas weakness.

Exhibit 5

AAM Corp Credit Fall-2014 5

Source: Bureau of Labor Statistics

In terms of economic growth in the fourth quarter of 2014, we expect consumer spending to accelerate, buoyed by higher savings and net worth, available credit, lower gasoline and food prices, rising consumer confidence as well as an improving job market. Risks to this forecast include increased geopolitical risk, unfavorable weather, and/or an increase in Ebola cases in the U.S. or surrounding countries.

In addition to the consumer’s contribution to growth in the fourth quarter, we see positive signs for continued growth in the industrial segment with rail car loadings continuing to climb throughout the year (Exhibit 6).

Exhibit 6

AAM Corp Credit Fall-2014 6

Source: Association of American Railroads, AAM

AAM expects oil prices to stabilize and the price of natural gas to decrease

 Our oil forecast of $90 – $95/barrel for WTI over the near term is based on three key items: worldwide consumption, supply and the marginal cost producer (oil sands in Canada and the Bakken Shale). Our forecast of consumption is based on a regression of worldwide oil consumption and GDP since 1970. The International Monetary Fund (IMF)’s worldwide GDP estimate for 2015 is 3.8%, which suggests worldwide oil consumption should increase by about 3% or about 3 million barrels to more than to 95 million barrels per day.

Incremental worldwide supply in 2015 will come from the Bakken Shale in North Dakota, the Permian Basin in west Texas, the Eagle Ford Shale in south Texas (+1.5 million barrels per day) and western Canada (0.4 million barrels per day); potential disruptions in Libya, along with declines in Russia, Mexico and the North Sea should largely offset the production increase in North America.

To meet the 95 million barrels per day of demand in 2015, we believe production from places like the Bakken Shale and the oil sands in Canada will be necessary. We believe that production from those regions require about $90-$95 per barrel to generate a 10% return   (Exhibit 7).

­­ Exhibit 7

AAM Corp Credit Fall-2014 7

Note: Reserves determine bubble size.

Source: Wood Mackenzie (August 2014), Barclays Research

Our forecast for Henry Hub Natural Gas is $4.00 per MMBtu (million British thermal units). We believe 2015 natural gas demand will be approximately flat with 2014 levels based on a normalized weather pattern (less consumption). Our demand forecast is based on a regression of natural gas consumption and weather degree days (population weighted days above and below 65 degrees Fahrenheit) since 2003. This regression suggests that 83% of the variability in natural gas consumption is determined by weather degree days. Weather degree days (consumption) are 2.5 standard deviations above the long term mean. We believe a reversion to the mean should result in lower demand. Supply remains very abundant. Productivity of 221 million cubic feet per day per rig is 18% greater than 2013 and 52% greater than its three year average.

This forecast results in a bias towards more “oily” Energy credits (vs. natural gas). Recently, we changed our fundamental outlook for the Oil Field Service and Contract Drillers to Negative due to three main reasons. First, the increased supply of rigs concurrent with a decrease in deep water rig demand is causing the daily rental rate for rigs to drop.   This is a result of major oil companies focusing more on return on capital employed instead of growth. Secondly, Brazil is unlikely to soak up the excess supply of rigs given the uncertainty in Brazilian economic policy. Lastly, activist shareholders are involved in this sector and will continue to pressure management to generate returns for shareholders at a time when stock prices are at multi-year lows.   Spreads widened in this sector, and are currently at levels last seen versus the broad Corporate market in April 2013 when shareholder activists entered the sector, creating uncertainty. We are not ready to buy on this dip since the weakness is fundamentally driven, and we expect it will take time to repair.

Private Placement Market Update

After a slow first half, deal flow has picked up in the private placement market. Generally, we continue to believe we are not getting compensated appropriately for the credit and liquidity risk and/or delayed funding, which is becomingly increasingly common. We recommended one deal that we believe offers at least 100 bps of value versus the comparable public credit, compensating investors for the structural risks and illiquidity.

Outside of private placements, we analyzed less liquid new issues in the public market that were small or had structural nuances. We believed many deals priced with yields too low for the risks assumed, recommending only a few.

Written by:

AAM Corporate Credit Research Team

For more information about AAM or any of the information in the Corporate Credit View, please contact:

Colin Dowdall, CFA, Director of Marketing and Business Development

colin.dowdall@aamcompany.com

John Olvany, Vice President of Business Development

john.olvany@aamcompany.com

Neelm Hameer, Vice President of Business Development

neelm.hameer@aamcompany.com

Disclaimer: Asset Allocation & Management Company, LLC (AAM) is an investment adviser registered with the Securities and Exchange Commission, specializing in fixed-income asset management services for insurance companies. This information was developed using publicly available information, internally developed data and outside sources believed to be reliable. While all reasonable care has been taken to ensure that the facts stated and the opinions given are accurate, complete and reasonable, liability is expressly disclaimed by AAM and any affiliates (collectively known as “AAM”), and their representative officers and employees. This report has been prepared for informational purposes only and does not purport to represent a complete analysis of any security, company or industry discussed. Any opinions and/or recommendations expressed are subject to change without notice and should be considered only as part of a diversified portfolio. A complete list of investment recommendations made during the past year is available upon request. Past performance is not an indication of future returns.

This information is distributed to recipients including AAM, any of which may have acted on the basis of the information, or may have an ownership interest in securities to which the information relates. It may also be distributed to clients of AAM, as well as to other recipients with whom no such client relationship exists. Providing this information does not, in and of itself, constitute a recommendation by AAM, nor does it imply that the purchase or sale of any security is suitable for the recipient. Investing in the bond market is subject to certain risks including market, interest-rate, issuer, credit, inflation, liquidity, valuation, volatility, prepayment and extension. No part of this material may be reproduced in any form, or referred to in any other publication, without express written permission.


July 11, 2014 by

Market Summary: Be Defensive, Not Bearish

By Elizabeth Henderson, CFA
Director of Corporate Credit

Elizabeth Henderson

[toc]

AAM hosted its biannual client conference last month. A popular question was “Is corporate credit overvalued?” To benefit those who missed the conference, we decided to share our answer in this quarter’s AAM Corporate Credit View as well as how we are positioned for the risks ahead.

Corporate Credit Continued to Perform Well in the Second Quarter

Corporate credit spreads tightened 7 basis points (bps) in the second quarter, supported by dovish comments from the Federal Open Market Committee (FOMC), constructive domestic economic data, and persistent low market volatility.  Similar to the first quarter, the Investment Grade corporate market generated 2.8% total return (0.66% excess return) in the second quarter, as represented by the Barclays Corporate Index. BBB rated securities generally outperformed, narrowing the basis between A rated Industrial securities from 60 bps at year-end 2013 to 44 bps. Comparing credit spreads to credit fundamentals such as leverage over time, we consider BBB rated securities fairly valued (Exhibit 1). Moreover, spread volatility has been minimal (6 bps YTD), thus OAS-to-spread volatility remains above average.   We expect this low level of volatility to persist for the next quarter, which is supportive for spreads.

Exhibit 1: Spreads have tightened while leverage has increased

AAM Corp Credit Summer-2014 1

Source: Barclays, CapitalIQ, AAM


Market Technicals Remain Supportive for Spreads

Demand remains very strong for Investment Grade securities. The secondary market continued to benefit from positive fund flows, and new issues remained oversubscribed with little concession versus outstanding securities. We are starting to see an increasing number of infrequent issuers with more credit risk (e.g., small REITs, Baidu) issue debt at negative concessions to their secondary spreads. And, issuers are taking advantage of investors’ quest for yield by issuing 50 year debt with minimal additional spread.

Long end maturities performed better in the second quarter, but intermediate (7-10 year) debt continued to outperform. Importantly, JP Morgan revised its forecast for fixed income supply down from $712 billion to $562 billion (vs. 2013’s actual of $864 billion) due mainly to lower supply of structured products and high yield. Investment Grade corporate supply is tracking ahead of forecast, but issuance in the second half may underwhelm if companies pushed forward their issuance due to lower than expected rates. Issuance to fund mergers and acquisitions (M&A) is increasing, and we expect this to support the level of issuance next year.   However, outside of Investment Grade corporates, we do not expect issuance in other fixed income sectors to materially increase. This strong technical is driving spreads and should remain supportive for corporate credit.

Economic Growth Remains Muted

Economic data improved in the second quarter but remained in line with expectations. Given inflation targets set by the European Central Bank and the Bank of Japan, we could be entering a period when the U.S. is tightening monetary policy while Europe and Japan are easing. This has implications for the U.S. Dollar and thus, commodity prices. China remains committed to its GDP target of 7% and continues to be accommodative. We believe it will be difficult for U.S. GDP growth to exceed 3%, as consumers feel the effects of rising gasoline and electricity prices along with rising food and rent costs.

We Expect Management Teams to Pursue Mergers & Acquisitions and Add Leverage to Boost ROE

Little has changed in credit fundamentals in the second quarter except for management teams’ willingness to pursue M&A. Return on equity (ROE) has fallen post crisis (Exhibit 2) despite increasing margins, debt leverage, and share repurchases due to the low level of revenue growth. Revenue growth for the median firm is approximately 2 percentage points lower than it was before the recession. As you would expect, firms get more aggressive in the latter part of the credit cycle, willing to accept financial risk and stretching to produce the returns shareholders expect. In 2007, M&A deal volume was high and few deals were equity financed. Year-to-date, the dollar volume of deals financed with stock is high due to the very large deals that have been announced. But, on a deal volume basis, it doesn’t look as favorable with a high proportion funded with debt and/or cash. Our expectation is for the number of deals to increase and financing to be more cash based.

Exhibit 2: ROE continues to fall

AAM Corp Credit Summer-2014 2

Source: AAM, Capital IQ (Universe includes 435 Industrial companies

We believe event risk will be the main contributor to credit rating downgrades and spread widening over the next 12 to 24 months. We expect the downgrades to mainly come from companies leaving the single-A category, moving into the BBB-category, as there is little difference from a cost of capital standpoint (Exhibit 3), and companies continue to have access to the Investment Grade market. While that is not great for performance for that particular issuer, with the potential for prices to fall 1-6%, we believe it will remain relatively contained.

Exhibit 3: Weighted Average Cost of Capital (WACC) curve is relatively flat

AAM Corp Credit Summer-2014 3 

Source: Morgan Stanley, Yieldbook, Bloomberg

The sectors listed in Exhibit 4, we believe are more vulnerable to event risk (e.g., M&A, increasing leverage) and the commensurate degree of spread widening. Assuming we are correct with the projected spread widening, we would still expect the market to generate modestly positive excess returns, as the income associated with 55% of the market that is not vulnerable to event risk offsets the spread widening of the sectors below.

Exhibit 4: Spread Widening Risk is Higher in Growth Challenged Sectors

AAM Corp Credit Summer-2014 4

Source: Barclays, AAM; SWR = Spread widening risk; est = estimate)

Regulatory Oversight Should Prevent a Large LBO

What would be detrimental to the Investment Grade market is a large leveraged buyout (LBO). While we would not be surprised to see select LBOs like we did last year, we are not expecting a large deal like we saw in 2006-2007 because of increased regulatory involvement. Regulators are not allowing the banks to underwrite secured loans with more than six times debt to earnings because they do not believe it is good for the economy. And, while nonbank financial institutions are happy to pick up that business, they don’t have the balance sheets to fund large deals (>$20 billion).

Spreads are Fully Valued but Reflect The Cost of Liquidity and Credit Loss

Exhibit 5: OAS remains within one standard deviation of its 20 year mean

AAM Corp Credit Summer-2014 5

Source: Barclays, AAM

We recognize that spreads are at the low end of the range historically (Exhibit 5). This reflects the lower level of systemic risk and uncertainty and the very strong technical bid with fixed income supply half its pre-crisis level. Corporate default rates are expected to remain low over the near term. Citigroup’s strategist states that using the worst 10 year default period for credit and a 40% recovery assumption, the data suggests High Grade bond spreads would be just 32 bps. That assumes they only reflect expected losses from defaults. Of course they should be wider because of other risks such as liquidity, which has increased post financial crisis. We estimate the cost of market liquidity to be approximately 35 bps, bringing the OAS floor to 67 bps. This compares to a market OAS at June 30, 2014 of 99 bps. The additional 32 bps is

We recognize that spreads are at the low end of the range historically (Exhibit 5). This reflects the lower level of systemic risk and uncertainty and the very strong technical bid with fixed income supply half its pre-crisis level. Corporate default rates are expected to remain low over the near term. Citigroup’s strategist states that using the worst 10 year default period for credit and a 40% recovery assumption, the data suggests High Grade bond spreads would be just 32 bps. That assumes they only reflect expected losses from defaults. Of course they should be wider because of other risks such as liquidity, which has increased post financial crisis. We estimate the cost of market liquidity to be approximately 35 bps, bringing the OAS floor to 67 bps. This compares to a market OAS at June 30, 2014 of 99 bps. The additional 32 bps is compensating investors for volatility, which given a market duration of 7, assumes it falls 1 bps from the current level[note]Note: We are assuming investors require sufficient income to compensate for a one standard deviation move in OAS. Therefore, a market duration of 7 and OAS standard deviation of 5 would require 35 bps of spread to break even over 12 months if OAS widened one standard deviation. The same applies to the cost of liquidity. The bid ask spread is 5 bps on average, and given a duration of 7, investors would need 35 bps of income to offset this cost over a 12 month timeframe.[/note]. We believe this is a reasonable assumption given where we are in the credit cycle (Exhibit 6), but it leaves little room for further spread tightening.

Exhibit 6: Standard deviation is expected to remain low over the near term

AAM Corp Credit Summer-2014 6

Source: Barclays, AAM

Position the Portfolio Defensively, Using Credit and Sector Selection

In conclusion, over the near term, we expect spreads to stay in this narrow band. The downside risks that would likely result in spread widening include a sudden move in rates, an exogenous shock, or a large LBO. Upside risks include better economic data or unexpected deleveraging by companies. Market technicals are benefitting spreads and are likely to continue to do so over the near term. Credit quality is good today and systemic risk is low, and even though spreads are tight, they are wide of the cost of liquidity and loss given default and compensate investors for the expected low level of volatility. We are not recommending portfolio managers upgrade the quality of their portfolios because we expect more ratings migration down from A to BBB than we do from BBB to BB. Case in point, after a failed merger with Syngenta, Monsanto decided to increase its leverage, resulting in ratings falling from A1/A+ to A3/BBB+. Monsanto’s spreads widened more than 25 bps. We believe it’s more prudent to be selective or defensive in this environment, not bearish.

­­­­­

Private Placement Market Update

We have participated in the private placement market in the first half of 2014. Currently, we are seeing frothiness in that market as well as project loans. The grab for yield has resulted in aggressive pricing and terms with investor demand outpacing supply. Volume is tracking lower than 2013, as issuers are increasingly accessing the European corporate market after the spread tightening that has materialized over the last couple of years. Therefore, we are investing selectively in this asset class as well.

For more information about AAM or any of the information in the Corporate Credit View, please contact:

Colin Dowdall, CFA, Director of Marketing and Business Development

colin.dowdall@aamcompany.com

John Olvany, Vice President of Business Development

john.olvany@aamcompany.com

Neelm Hameer, Vice President of Business Development

neelm.hameer@aamcompany.com

Disclaimer: Asset Allocation & Management Company, LLC (AAM) is an investment adviser registered with the Securities and Exchange Commission, specializing in fixed-income asset management services for insurance companies. This information was developed using publicly available information, internally developed data and outside sources believed to be reliable. While all reasonable care has been taken to ensure that the facts stated and the opinions given are accurate, complete and reasonable, liability is expressly disclaimed by AAM and any affiliates (collectively known as “AAM”), and their representative officers and employees. This report has been prepared for informational purposes only and does not purport to represent a complete analysis of any security, company or industry discussed. Any opinions and/or recommendations expressed are subject to change without notice and should be considered only as part of a diversified portfolio. A complete list of investment recommendations made during the past year is available upon request. Past performance is not an indication of future returns.

This information is distributed to recipients including AAM, any of which may have acted on the basis of the information, or may have an ownership interest in securities to which the information relates. It may also be distributed to clients of AAM, as well as to other recipients with whom no such client relationship exists. Providing this information does not, in and of itself, constitute a recommendation by AAM, nor does it imply that the purchase or sale of any security is suitable for the recipient. Investing in the bond market is subject to certain risks including market, interest-rate, issuer, credit, inflation, liquidity, valuation, volatility, prepayment and extension. No part of this material may be reproduced in any form, or referred to in any other publication, without express written permission.


March 17, 2014 by

[toc]

Welcome

We welcome a new format for our Corporate Credit View, replicating our popular AAM Newsletter. Each quarter, we will feature an Investment Grade Corporate bond market summary, discuss changes in credit fundamentals as well as newsworthy developments, highlight sectors we find attractive or particularly unattractive, and close with comments regarding the private placement market.

Market Summary: Credit Market Stays Healthy Through Tough Winter

By Elizabeth Henderson, CFA
Director of Corporate Credit

Elizabeth Henderson

The Investment Grade Corporate market generated solid performance in the first quarter 2014, with spreads tightening and Treasury yields falling, generating 2.94% total return (0.70% excess return) year-to-date for the Barclays Corporate Index. Industrial BBB rated securities generally outperformed, narrowing the basis between A rated securities from 60 at year-end 2013 to 52 basis points (bps). Volatility has been minimal, with spreads widening 7 bps during the emerging market sell off in late January, and then retracing to close 8 bps tighter year-to-date.   The market OAS has moved inside our target for 2014; therefore, we expect performance for the remainder of the year to be driven by income rather than spread tightening.

Technically, demand remains very strong for Investment Grade securities. The secondary market has benefited from positive fund flows, and new issues continue to be well oversubscribed with little concession versus outstanding securities.

The biggest change year-to-date has been the performance across the curve. Last year, short and long end spreads outperformed; whereas this year, intermediate (7-10 year) spreads have outperformed. We believe this reflects investors’ relatively benign expectations for rising interest rates after the move last year and the weak economic data received year to date. Credit curves have changed (5-year to 10-year spreads have flattened while 10-year to 30-year spreads have steepened), and we expect long end demand will increase for corporate spreads once 30-year rates increase. Rate expectations for mid-year 2014 have been modified down by 30-50 bps vs. the start of the year.

Rate expectations reflect weaker U.S. economic data, arguably due to the harsh winter, while data from China has disappointed as well. The weakness in China partly reflects the reforms put in place by the new regime, affecting Investment Grade companies to various degrees. The Chinese government has not been spending at the pace it once was on technology, nor is the wealthy on cars, apparel and even wine.   Even though Chinese Premier Li Keqiang ruled out major stimulus after weak trade data this week, the government has announced tax breaks for small firms to hasten infrastructure spending, benefitting the rail sector and other under developed or invested areas. The government has the resources to support/stimulate GDP growth, but has to be cautious given the rapid increase in local debt. Despite the soft U.S. quarter and the negative data from China, the expectation for 2014 worldwide GDP growth has stayed firm at 2.81% today vs. 2.83% on December 31, 2013 per Bloomberg (reflects the consensus).

Corporate merger and acquisition activity has increased, with the number of deals up 10% per Bloomberg year-over-year. The vast majority has occurred in the U.S. (20% year-over-year) vs. Europe (3%) and Asia Pacific (1%). Approximately half the activity has been in the Communications and Consumer NonCyclical sectors, seeking to benefit from increased economies of scale and/or cost cutting.

After analyzing 2013 results, credit metrics remained healthy. Capital spending was weaker in the fourth quarter, but the projection for 2014 improved. We expect the companies in our investment grade universe to increase spending close to 5% vs. 2013. This compares to the expectation for much stronger spending for companies in the S&P 500 Index. Industries such as Healthcare, Aerospace/Defense, and Technology represent a larger portion of the S&P 500 vs. the Investment Grade Corporate bond market. These sectors are expected to grow capital spending more than 6% in 2014. Sectors that are expected to pull back capital spending this year include: Integrated Energy, Metals & Mining, and Construction Machinery.

In general, we have been advocating BBB securities vs. A rated for the attractive risk adjusted income. In 2013, nonfinancial BBB credit fundamental improvement exceeded that for A rated credits, as did U.S. credits vs. those domiciled outside the U.S. (highlighted in Exhibit 1). We note EBITDA margins remained stagnant year over year, and unless revenue growth improves this year, companies will remain highly focused on costs.

As shown in Exhibit 2, margins for commodity based companies reflect falling oil and metals prices while transportation companies have benefited from shale production in the U.S. as well as technology improvements. Consumers are spending more on big ticket items and leisure, benefitting the more cyclical companies (e.g., autos, hotels) vs. noncyclical (e.g., food, household products).

Exhibit 1
Fundamental Comparison of NonFinancial companies in 2013 vs. 2012
A/better BBB U.S.U.S. Non U.S.
Revenue growth 1% 3% 3% 1%
EBITDA growth 1% 5% 5% -1%
Free Cash Flow growth up sd up dd up dd down dd
Leverage +0.1x +0.1x
Cash/Debt +1 ppt +0.1x flat flat
Capex/Revenues flat +2 ppts +2 ppts flat
Dividends/CFO +1 ppt flat flat +1 ppt
M&A/CFO -5 ppts -1ppt +1 ppt -6 ppts
Net Share repurchase/CFO +4 ppts -2 ppts -3 ppts flat
-2 ppts +2 ppts

 Source: AAM, CapitalIQ using a subset of approximately 550 companies

Legend: ppt = percentage point; sd = single digits; dd = double digits; x + times

Exhibit 2
EBITDA Margins 12/31/2013 12/31/2012

10 year

Maximum

10 year

Average

Basics 18.6% 18.8% 24.3% 20.3%
Capital Goods 15.1% 14.3% 15.3% 14.5%
Communications 30.3% 27.9% 32.1% 30.3%
Energy 15.5% 16.8% 21.1% 17.7%
Cyclicals 12.3% 11.3% 13.7% 11.1%
Noncyclicals 15.6% 15.7% 16.8% 15.9%
Technology 24.7% 25.2% 25.2% 22.0%
Transportation 28.7% 26.9% 28.7% 23.9%
Electric 29.2% 29.4% 29.4% 26.9%
Gas 30.4% 32.2% 32.2% 26.1%

Source: AAM, CapitalIQ using a subset of approximately 550 companies

Sector Highlights: Media NonCable

By Elizabeth Henderson, CFA
Director of Corporate Credit

Elizabeth Henderson

We took advantage of steeper 10-year to 30-year credit curves (Exhibit 3) and relatively wider spreads in the Media sector after companies increased their leverage targets last year. Over the near term, we expect capital structures to remain stable and television/cable networks to benefit from affiliate fee contract increases of 7-8% and a healthy advertising market. The world’s largest advertising agency’s (WPP) CEO commented at a recent conference that advertising in the U.S. and Western Europe was stronger than they had expected during February and March, resulting in revenue growth of 6%, outpacing their 3% target expected for 2014. Original content continues to be in demand from traditional buyers as well as nontraditional buyers such as Amazon and Yahoo. We prefer media credits with production studios, conservative management teams and networks with strong brands. While we acknowledge the risk to the networks if the distributors (e.g., Comcast (CMCSA)/Time Warmer (TWC), Direct TV (DTV)/DISH) consolidate, we view that as a risk over the intermediate term.   Credits we favor include: Omnicom, WPP, Time Warner Inc. and Fox.

Original content continues to be in demand from traditional buyers and non-traditional buyers

Exhibit 3

AAM Corp Credit Spring-2014-2 3

Energy Services

By Patrick J. McGeever, CFA
Senior Analyst, Corporate Credit

Patrick J. McGeever

The Oilfield Services (OFS) subsector continues to be among the widest trading in the investment grade universe with a quarter-end OAS of 139 bps versus 105 bps for the broad Industrial sector. Notably, the OFS subsector includes both contract drillers such as Ensco, Transocean, Noble Drilling and Diamond Offshore as well as service companies such as such as Schlumberger, Halliburton and Baker Hughes. The capital intense contract drillers comprise about 50% of the market value of the OFS subsector and they currently provide about 50 bps of incremental yield to the very high quality service credits. As Exhibit 4 shows, investors can pick up yield relative to BBB Industrials across the curve by owning contract drillers.

Exhibit 4

AAM Corp Credit Spring-2014-2 4

Source: AAM (Spread Master & Final Industrial Matrix), Bloomberg

We believe there are several reasons that the contract drillers are providing yields greater than similarly rated Industrials. First, there is concern regarding a large amount of new rigs entering the market in the next several years, which could put pressure on drilling rig rental rates. Secondly, there is a fear that the Independents, Integrateds, and state run oil companies may reduce drilling activities and focus on better returns. Additionally, the largest market for deep-water drilling rigs is Brazil, where drilling activities have slowed in the past 18 months.

We believe these headwinds are short term in nature and that structural support for deep-water drilling remains intact. First, we believe that strong oil and international gas prices are sustained by world economic growth of more than 3%. Secondly, we believe the concern about excess supply of rigs will ease as some new rigs replace older rigs rather than add to overall supply. Finally, given the reforms of the energy market in Mexico, we believe substantial incremental deep-water activity could begin in the latter half of 2015.

Domestic Banks

By N. Sebastian Bacchus, CFA
Senior Analyst, Corporate Credit

N. Sebastian Bacchus

As part of the Dodd-Frank Act, U.S. banks with more than $50 billion in assets are required to undergo annual stress tests and a review of their capital plans (i.e., dividend/buy-back plan) administered by the Federal Reserve.  The stress test measures the ability of banks to withstand a hypothetical economic and market downturn while maintaining minimum Tier 1 capital ratios.  Results of the stress test were released March 21, 2014 with 29 of 30 banks under review passing on a quantitative basis (Zions Bancorp was the lone failure).  This was followed by release on March 25, 2014 of the Comprehensive Capital Analysis and Review (CCAR) which is also administered by the Federal Reserve and takes into account the results of the stress test and the proforma impact of the dividend and buybacks requested.  In contrast to the stress test, five banks had their capital plans rejected (most notably Citigroup, but also HSBC North America, RBS Citizens, Santander USA and Zions).  Additionally, several banks including Bank of America were told to revise their capital plan submissions before they were approved.

The rejection of Citi’s capital plan was surprising (and embarrassing) to management, which had been working to overcome past stumbles in the CCAR process.  The Federal Reserve noted that the rejection was due to qualitative rather than quantitative reasons (Citi exceeded the stress test minimum capital requirements).  Although details of the stress test and CCAR, as well as specifics of the rejected capital plan were not released by the Federal Reserve, they did note qualitative concerns about Citi’s ability to model losses in its foreign subsidiary loan books in an extreme stress case.  This deficiency was apparently identified in previous years and the regulator felt that sufficient progress was not made in addressing the situation.

Private Placement Market Update

By Hugh R. McCaffrey, CFA
Senior Analyst, Corporate Credit

Hugh R. McCaffrey

Private placement deal volume was down 25% year-to-date as of March 31, 2014 vs. the same period last year[note]Anthony Napolitano, “Parsons Takes $250 Million Out of the Market,Private Placement Monitor, vol. 26 (2014), no. 48, page 6.[/note]. The expectation is that volume picks up over the course of the year. Cross border transactions accounted for the majority (approximately 60%) of the issuance, which is unlikely to persist.   We continue to find private placements attractive, but remain selective, avoiding deals we consider NAIC 3 quality that are being marketed as NAIC 2. Project finance issuance has been predominantly Latin American with deals from Peru, Chile, and Mexico.

For more information about AAM or any of the information in the Corporate Credit View, please contact:

Colin Dowdall, CFA, Director of Marketing and Business Development

colin.dowdall@aamcompany.com

John Olvany, Vice President of Business Development

john.olvany@aamcompany.com

Neelm Hameer, Vice President of Business Development

neelm.hameer@aamcompany.com

Disclaimer: Asset Allocation & Management Company, LLC (AAM) is an investment adviser registered with the Securities and Exchange Commission, specializing in fixed-income asset management services for insurance companies. This information was developed using publicly available information, internally developed data and outside sources believed to be reliable. While all reasonable care has been taken to ensure that the facts stated and the opinions given are accurate, complete and reasonable, liability is expressly disclaimed by AAM and any affiliates (collectively known as “AAM”), and their representative officers and employees. This report has been prepared for informational purposes only and does not purport to represent a complete analysis of any security, company or industry discussed. Any opinions and/or recommendations expressed are subject to change without notice and should be considered only as part of a diversified portfolio. A complete list of investment recommendations made during the past year is available upon request. Past performance is not an indication of future returns.

This information is distributed to recipients including AAM, any of which may have acted on the basis of the information, or may have an ownership interest in securities to which the information relates. It may also be distributed to clients of AAM, as well as to other recipients with whom no such client relationship exists. Providing this information does not, in and of itself, constitute a recommendation by AAM, nor does it imply that the purchase or sale of any security is suitable for the recipient. Investing in the bond market is subject to certain risks including market, interest-rate, issuer, credit, inflation, liquidity, valuation, volatility, prepayment and extension. No part of this material may be reproduced in any form, or referred to in any other publication, without express written permission.


October 17, 2013 by

Investment Grade Bond Market Performance Summary

In the third quarter of 2013, investment grade corporate bond spreads staged a nice comeback with significant tightening starting at the beginning of July. This performance was caused by the stability in interest rates and slower outflows from bond mutual funds, the result of dovish comments out of the Federal Reserve and in-line economic data. The OAS of the corporate market was 141 at the end of September, which was unchanged compared to the beginning of this year. Since mid-July, spreads have remained fairly stable as we have successfully moved through a host of key market risks, including the prospect of military action in Syria, FOMC (Federal Open Market Committee) action regarding QE tapering, and emerging market growth concerns. Most recently, all eyes have been on the dysfunctional political system in Washington DC, specifically the government shut down and the lack of a resolution regarding the debt ceiling. In typical fashion, a temporary solution was reached on these issues. We expect these same issues to creep up again next year as lawmakers simply pushed back the deadlines.    Healthy corporate balance sheets along with a stable, albeit low rate of top line growth against a strong technical backdrop should allow for moderate spread tightening for the rest of the year. We believe the recent situation in Washington will, in effect, reduce the chances of tapering this year as positive economic data points are lacking and the impact of the government shutdown on consumer and business spending remains even more clouded. Therefore, our base case scenario is that rates will remain in a range which should keep corporate bond investors placated.

Investment Grade Fundamental Review- Steady as She Goes

As we enter into the third quarter of 2013 earnings season, we believe investors will refocus on corporate fundamentals. While we are clearly off the peak established in 2010, corporate balance sheets and cash flow remain healthy. Exhibit 1 looks at the fundamentals of over 400 industrial, investment grade companies. For the past four quarters, free cash flow, share repurchase activity, and leverage (debt/EBITDA) are unchanged. Corporations are in a holding pattern with spending/leverage until they have more conviction of top line growth. We expect EBITDA to grow in the mid-to-low single digits in 2013, with similar growth in 2014. This should help improve leverage slightly, as we don’t expect companies to focus on outright debt reduction in the near term. Also, we would expect free cash flow to improve, which likely results in more aggressive share repurchase activity. Cash and short term investments as a percentage of total debt was 35% at the end of the second quarter in 2013. This has been a very stable metric, ranging between 32% and 37% since the fourth quarter of 2009. In addition, we may see some upside to earnings for those companies that are exposed to Europe, as that region begins to show positive growth.

Exhibit 1: Consolidated FinancialsAAM Corp Credit 3Q2013 1
Source: CapitalIQ

Corporate Bond Market Technical Analysis – Set Up Nicely for the Rest of 2013

Gross new issuance in the third quarter of 2013 was $244 billion, an 8% increase over the second quarter of 2013. However, the current quarter included the massive $49 billion deal from Verizon. Without Verizon, the third quarter total would be $195 billion or a 13% decrease from the second quarter. A decrease in issuance is not unexpected since the summer months of July and August are typically quiet. However, with concerns regarding an approaching Fed taper, and commensurate higher interest rates, issuers were more active this September with $136 billion in gross issuance, including the Verizon deal. The YTD total for gross issuance stands at $717 billion versus an estimate for 2013 of $850 billion. We believe issuance will slow in the fourth quarter of 2013 to a more typical level of approximately $165 billion, pushing issuance for 2013 to $880 billion.

The active issuance in September resulted in wider new issue concessions. The average deal concession for September was 9 basis points (bps), which was up from the August average of 7 bps. However, the last few days of September saw concessions average approximately 11 bps. The last time concessions were at these levels was the first week of July, which hit the peak for 2013 of 24 bps.

Upon further review of new issue in 2013, we notice an interesting difference in tenor. Year-to-date, 19% of all investment grade corporate deals have been 30-year maturities. This is higher than the 16% in 2012 and the 2009 – 2012 average of 15%. Despite greater long end supply, the 10-to-30 year spread curve has flattened approximately 10 to 12 bps since the start of the year as shown in Exhibit 2. Issuers have been more than happy to satisfy the demand for higher yields from insurance companies and pension funds, which has increased as interest rates experience less volatility while inching higher.

Secondary volumes have also been robust this year. Year-to-date, customers have bought and sold $1.8 trillion of investment grade corporate bonds, a 13% increase from the same year-to-date period in 2012. So far in 2013, investors have been net buyers of corporates to the tune of $15 billion. At this point last year, investors had net purchased $9 billion. However, investors net sold $6 billion in September which was most likely used to pay for the heavy new issue calendar. Investor appetite for long end paper can also be seen in the secondary volumes. Meanwhile, two and three year maturities saw heavy demand in the third quarter of 2013, but most of the demand occurred during July and August, as investors parked cash anticipating heavy new issuance in September. While investors were net sellers of corporates in September across all maturities, the demand for the long end materialized once again during the first two weeks of October. Also, we also expect demand for 10-year maturities to increase as 5 to 10-year spread curves are historically steep as illustrated in Exhibit 2.
Exhibit 2
AAM Corp Credit 3Q2013 2
Source: Barclays

Written by:

Michael Ashley
Senior Research Analyst
Corporate Credit

Disclaimer: Asset Allocation & Management Company, LLC (AAM) is an investment adviser registered with the Securities and Exchange Commission, specializing in fixed-income asset management services for insurance companies. This information was developed using publicly available information, internally developed data and outside sources believed to be reliable. While all reasonable care has been taken to ensure that the facts stated and the opinions given are accurate, complete and reasonable, liability is expressly disclaimed by AAM and any affiliates (collectively known as “AAM”), and their representative officers and employees. This report has been prepared for informational purposes only and does not purport to represent a complete analysis of any security, company or industry discussed. Any opinions and/or recommendations expressed are subject to change without notice and should be considered only as part of a diversified portfolio. A complete list of investment recommendations made during the past year is available upon request. Past performance is not an indication of future returns.

This information is distributed to recipients including AAM, any of which may have acted on the basis of the information, or may have an ownership interest in securities to which the information relates. It may also be distributed to clients of AAM, as well as to other recipients with whom no such client relationship exists. Providing this information does not, in and of itself, constitute a recommendation by AAM, nor does it imply that the purchase or sale of any security is suitable for the recipient. Investing in the bond market is subject to certain risks including market, interest-rate, issuer, credit, inflation, liquidity, valuation, volatility, prepayment and extension. No part of this material may be reproduced in any form, or referred to in any other publication, without express written permission.

July 11, 2013 by

Second Quarter 2013

  • Spread Widening in June Wipes Out Performance for the First Five Months
  • Market Technicals are Supportive in the Near Term
  • Credit Fundamentals are Moderating and Rating Downgrades are Increasing
  • Increased Share Repurchase and Merger & Acquisition Activity is Expected
  • AAM Expects Spread Tightening in the Second Half of 2013
Investment Grade Corporate Bond Spreads Widened in June

Investment grade corporate spreads tightened from 141 basis points (bps) at year-end 2012 to 130 bps in mid-May, as investors sought additional yield versus Treasuries after Treasury rates fell on the premise of a sluggish domestic economy and QE3 extending in 2014 (Exhibit 1). Concurrently, the European Central Bank indicated a willingness to become more accommodative and the Central Bank of Japan deployed a massive monetary stimulus. That technical support changed when the Federal Open Market Committee (FOMC) minutes were released in late May and the Fed Chairman spoke in June, stating “that if the Fed’s updated economic forecasts out today are correct, the FOMC may moderate purchases later in 2013 and end them around mid-2014 if the economic data warrants it.” As Treasury yields increased approximately 100 bps from their low points in May, spreads widened 20 bps, a relationship that has historically been negatively correlated. The volatility in the Treasury market increased the volatility in many other markets around the world (equities, currencies, commodities, and fixed income), resetting prices and resulting in negative total returns. Emerging markets have been hit especially hard, as liquidity is withdrawn and China’s growth expectations are reset lower.

Exhibit 1

AAM Corp Credit 2Q2013 1

Source: Barclays Capital, AAM

Exhibit 2
Excess Returns YTD (bps) Total BBB A
Industrials -70 -50 -99
Utilities 13 25 -5
Finance 35 123 1
Corp Index -27 -3 -46

The Investment Grade Corporate market underperformed Treasuries in the first half of 2013 per Barclays by 0.27% because of the performance in June (-1.18% bps excess return). The Finance sector has outperformed this year along with BBB rated non-Industrials (Exhibit 2). Investors have looked to Finance and Utilities versus the more event risk prone Industrial sectors. Industrial bonds with long maturities have performed particularly poorly (-1.58% YTD 6/30), as investors recognize the lack of spread protection in the face of increased volatility. Since June 25, the increased yields have enticed buyers on the long end, driving performance (20 bps tighter versus 11 bps tighter for Barclays Corporate Index) especially for high quality issuers.

Technicals are Supportive for Spreads in the Near Term

Technical pressure was a cause of the widening in Corporate bonds, as Exchange Traded Funds (ETF) and mutual funds experienced outflows ($1.5 billion, $871 million, respectively), at a level last seen in October 2011 when European concerns were pulling down the markets. Broker dealer inventories of corporate bonds had increased in May and market volatility was increasing, leaving them unable to absorb the redemptions and resulting in wider spreads. These wider spreads did ultimately entice buyers as evidenced by the net buying of $5 billion in the secondary market during June. New issue volume was very low ($35 billion), but for the new issues that came to market, deals were oversubscribed and attractively priced. We believe the net selling by broker dealers in June leave inventories very light. With supply expected to be seasonally low in July and August and coupon income of $57 billion/month, spreads are poised to tighten even if modest outflows continue.

Credit Fundamentals are Moderating Mid-Point in the Cycle

We monitor the performance of over 500 global investment grade industrial and utility companies. Our analysis points to credit fundamentals that are at the mid-point in the cycle. Starting with the balance sheet, one can see that leverage is rising (Exhibit 3) for Industrials and Utilities. The drop in commodity prices has caused leverage to increase for commodity based firms due to falling cash flows as well as increased debt. From a gross debt perspective, companies have moderate capacity to increase leverage without affecting their debt ratings. However, cash balances remain very high (Exhibit 4). Despite a significant percentage being held overseas, this cash gives firms financial flexibility to weather periods of uncertainty, make acquisitions, or buyback stock. We believe this is also a good indicator of how management teams feel about the economy and market opportunities.

Exhibit 3       
AAM Corp Credit 2Q2013 3
Exhibit 4

AAM Corp Credit 2Q2013 4

Source:  AAM, Capital IQ (Universe includes 546 Utility and Industrial companies)

Operating margins have deteriorated for the commodity companies and have stalled for others (Exhibit 5). This is due to a reduction in revenue growth, as global economic growth cools (Exhibit 6). Note the same trend emerged in late 2004 before growth was reignited by leverage from the housing sector. Therefore, management teams are still very concerned about growth. This appears to be the case for small businesses as well. In the latest National Federation of Independent Business (NFIB) small business survey, more firms reported sales declining and the net percentage of owners expecting higher real sales volume fell three percentage points to 5% of all owners. Moreover, government related issues (taxes, regulation, and insurance) and poor sales were reported as the single most important small business problem for 67% of firms. All of these issues have an impact on net income. This is likely the reason that only net 7% of NFIB participating firms were planning to hire in June.

Exhibit 5

AAM Corp Credit 2Q2013 5

Exhibit 6

AAM Corp Credit 2Q2013 6

Source: AAM, Capital IQ (Universe includes 546 Utility and Industrial companies)

How have companies invested their operating cash? Exhibit 7 deconstructs the main uses of operating cash flow: capital spending, dividends, share repurchases net issuance, and mergers and acquisitions (M&A) net asset sales. Capital spending is up from about 50% to 60%, a level usually experienced in a recession as operating cash flow declines. We believe companies have spent more on capital during this economic cycle due to unique incentives, namely lower interest rates and tax breaks. As an aside, the accelerated depreciation allowance expires this year, which will cause cash taxes to increase and free cash flow to fall. Dividends are fairly even at about 20%. The last two are worth noting. Share buybacks are in line with levels midway through an economic cycle. As an aside, this percentage increased after 2004, as margins stalled and leverage started to increase. Similarly, M&A activity has been fairly modest despite the low interest and growth rates. We believe this has a lot to do with the volatility in the markets and the uncertainties that exist from a government and regulatory standpoint that makes forecasting return on investment difficult.

Exhibit 7

AAM Corp Credit 2Q2013 7

What do we expect over the next 12 months? We are not expecting a material increase in the rate of dividends despite a clamoring for income. The rate has increased and is now approaching levels typically seen around a recession, as net income falls (Exhibit 8).

Exhibit 8

AAM Corp Credit 2Q2013 8

We do believe companies will increase stock repurchase and M&A activity (Exhibits 9 and 10). Although interest rates have increased, they remain low in historic terms. We expect cash and debt to be used to fund this activity, especially for firms that have benefitted the most from accelerated depreciation. We continue to largely avoid the sectors and credits that are vulnerable to this activity, namely those that are growth challenged and under leveraged (i.e., Telecommunications, Aerospace Defense, Consumer Products, and Technology).

Exhibit 9     
AAM Corp Credit 2Q2013 9
Exhibit 10
AAM Corp Credit 2Q2013 10
Exhibit 11

AAM Corp Credit 2Q2013 11

Exhibit 12

AAM Corp Credit 2Q2013 12

With the gap between the cost of equity versus the cost of debt historically high, management teams are incentivized to use their balance sheets to fund growth. Also, the weighted average cost of capital (WACC) curve is historically flat in investment grade (Exhibit 11 and 12), resulting in a small cost for sliding down the ratings scale.

That trend has started. The ratio of upgrades to downgrades fell at Moody’s to 0.89 times in the first five months of 2013, which is the lowest since the first five months in 2009. It peaked at 1.55 times in 2010[note]Matt Robinson, “Ratings Ratio Worst Since 2009 as Profits Slow” Bloomberg, June 26, 2013, accessed June 28, 2013, https://www.bloomberg.com/news/2013-06-26/ratings-ratio-worst-since-2009-as-profits-slow-credit-markets.html[/note]. In general, we continue to prefer BBB versus A rated securities, as investors are not getting paid for this downgrade risk. The gap is between BBB and A rated Industrials is attractive at over 80 bps versus our target of 50 bps (prior cycle minimum was 27 bps). We continue to believe security selection will become a more important driver of returns, as we move into the second half of the credit cycle.

AAM Expects Performance from Corporate Bonds in the Second Half

We had expected spreads to remain fairly stable in the second quarter with economic activity expected to be largely the same as the first quarter and then slowly picking up over the second half. Although GDP growth for the second quarter is expected to be only 1.6% versus the 1.8% in the first quarter (Bloomberg economic consensus), the Fed changed the technical dynamics with the talk of tapering, causing spreads to widen in June. We have been skeptical of the Fed’s ability to withdraw stimulus given the muted growth of the business sector, making it difficult to support a meaningful decline in the unemployment rate. That said, with payrolls growing at a rate of 150,000 to 200,000, the market’s expectation is for the Fed to taper later this year, possibly in September.

Spreads have been tightening since June 25 with the relative stabilization in rates. In our view, the two likely paths are constructive for corporate credit: (1) The Fed is right and economic growth accelerates which is positive for Corporate fundamentals, namely revenue growth or (2) The Fed is wrong and growth remains subdued causing the Fed to remain accommodative and demand for Corporate bonds to continue as a yield alternative to Treasuries. Therefore, we remain constructive on overall corporate credit.

Written by:

Elizabeth Henderson, CFA
Director of Corporate Credit

Disclaimer: Asset Allocation & Management Company, LLC (AAM) is an investment adviser registered with the Securities and Exchange Commission, specializing in fixed-income asset management services for insurance companies. This information was developed using publicly available information, internally developed data and outside sources believed to be reliable. While all reasonable care has been taken to ensure that the facts stated and the opinions given are accurate, complete and reasonable, liability is expressly disclaimed by AAM and any affiliates (collectively known as “AAM”), and their representative officers and employees. This report has been prepared for informational purposes only and does not purport to represent a complete analysis of any security, company or industry discussed. Any opinions and/or recommendations expressed are subject to change without notice and should be considered only as part of a diversified portfolio. A complete list of investment recommendations made during the past year is available upon request. Past performance is not an indication of future returns.

This information is distributed to recipients including AAM, any of which may have acted on the basis of the information, or may have an ownership interest in securities to which the information relates. It may also be distributed to clients of AAM, as well as to other recipients with whom no such client relationship exists. Providing this information does not, in and of itself, constitute a recommendation by AAM, nor does it imply that the purchase or sale of any security is suitable for the recipient. Investing in the bond market is subject to certain risks including market, interest-rate, issuer, credit, inflation, liquidity, valuation, volatility, prepayment and extension. No part of this material may be reproduced in any form, or referred to in any other publication, without express written permission.


  • « Go to Previous Page
  • Page 1
  • Interim pages omitted …
  • Page 3
  • Page 4
  • Page 5
  • Page 6
  • Page 7
  • Interim pages omitted …
  • Page 12
  • Go to Next Page »

Get updates in your inbox.

  • Investment Strategies
    • Investment Grade Fixed Income
    • Specialty Asset Classes
  • Our Clients
    • Client Experience
    • Sample RFP Download
  • Insights
    • Video
    • Webinar
    • News
    • Podcasts
  • About
    • Our Team
    • Contact
    • Client Login

Disclaimer: Asset Allocation & Management Company, LLC (AAM) is an investment adviser registered with the Securities and Exchange Commission, specializing in fixed-income asset management services for insurance companies. Registration does not imply a certain level of skill or training. This information was developed using publicly available information, internally developed data and outside sources believed to be reliable. While all reasonable care has been taken to ensure that the facts stated and the opinions given are accurate, complete and reasonable, liability is expressly disclaimed by AAM and any affiliates (collectively known as “AAM”), and their representative officers and employees. This report has been prepared for informational purposes only and does not purport to represent a complete analysis of any security, company or industry discussed. Any opinions and/or recommendations expressed are subject to change without notice and should be considered only as part of a diversified portfolio. A complete list of investment recommendations made during the past year is available upon request. Past performance is not an indication of future returns. This information is distributed to recipients including AAM, any of which may have acted on the basis of the information, or may have an ownership interest in securities to which the information relates. It may also be distributed to clients of AAM, as well as to other recipients with whom no such client relationship exists. Providing this information does not, in and of itself, constitute a recommendation by AAM, nor does it imply that the purchase or sale of any security is suitable for the recipient. Investing in the bond market is subject to certain risks including market, interest-rate, issuer, credit, inflation, liquidity, valuation, volatility, prepayment and extension. No part of this material may be reproduced in any form, or referred to in any other publication, without express written permission. *All figures shown are approximate and subject to change from quarter to quarter. **The accolades and awards highlighted herein are not statements of any advisory client and do not describe any experience with or endorsement of AAM as an investment adviser by any such client.

Copyright © 2024 AAM | Privacy and Disclosures

  • LinkedIn
  • YouTube