Political Risk is Rising
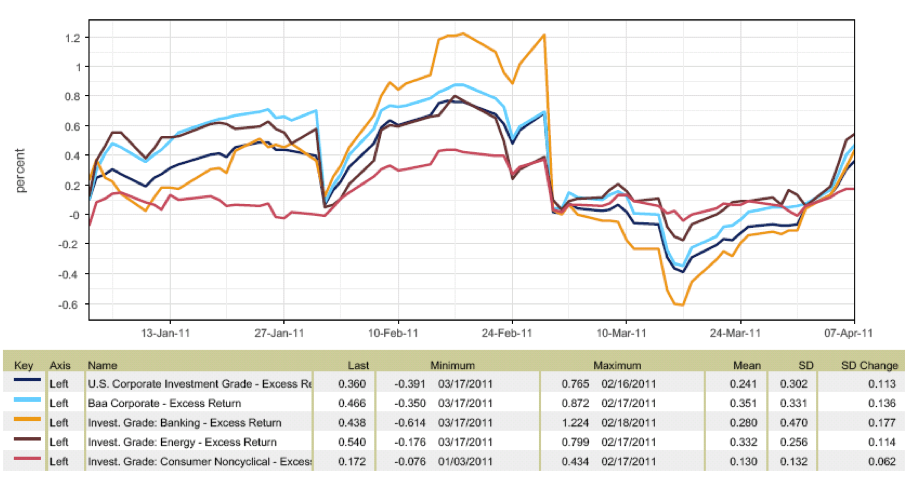
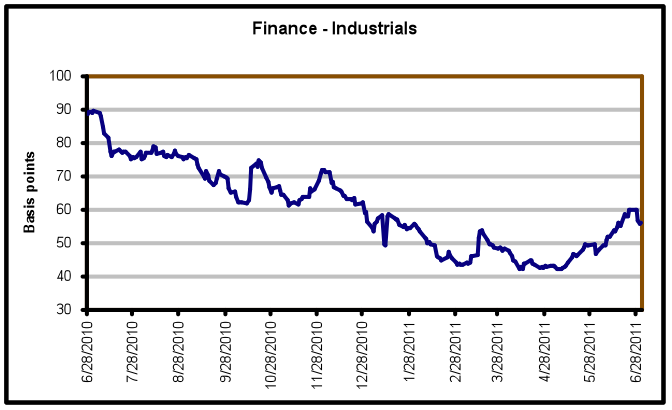
What an ugly month! The Barclays Corporate Index posted -333 basis points (bps) of excess return in August, wiping out the positive return that had been generated through July, leaving -241 bps of excess return year-to-date. Spreads widened in all sectors with Cyclical Industrials and Financials underperforming more defensive sectors. The shedding of risk assets was also evident in the widening of the differential between A and BBB rated credits (see Exhibit 1). The spread widening was concurrent with falling Treasury yields (62 bps for the 10-year in August) after the downgrade of the US Treasury’s AAA rating by Standard & Poor’s and the sharp fall and subsequent volatility of the equity market. After many weaker than expected economic reports and a slower recovery of the consumer after such a sharp contraction of net worth, economists revised their GDP estimates lower. Equally important was the increasing uncertainty of the resolution of the debt crisis in Europe, resulting in losses for bank equities and widening bond spreads as investors feared a repeat of 2008.
Exhibit 1
Source: Credit Suisse LUCI Index, 7-10 year maturities
We are more concerned about the near term political risk surrounding Europe than we are a U.S. recession, but both are troublesome for credit investors. A lower-than-expected growth outlook has caused the Federal Reserve to extend its timeline for very low rates to 2013, and the resulting flatness of the curve (LIBOR to 2-year Treasury) is weighing on bank profitability. Analysts have been busily revising down their expectations for earnings in 2012, but not to the degree the equity market is expecting. That said, even though corporate fundamentals are very strong today, a recession (especially one that is mired in another banking crisis) would be problematic for lower quality credits and those relying on capital markets or bank (mainly European) funding. The spread widening in high yield (160 bps in August vs. 55 bps of widening for Investment Grade) reflects this risk.
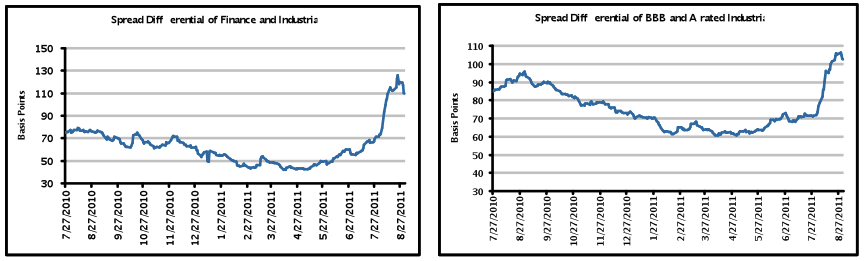
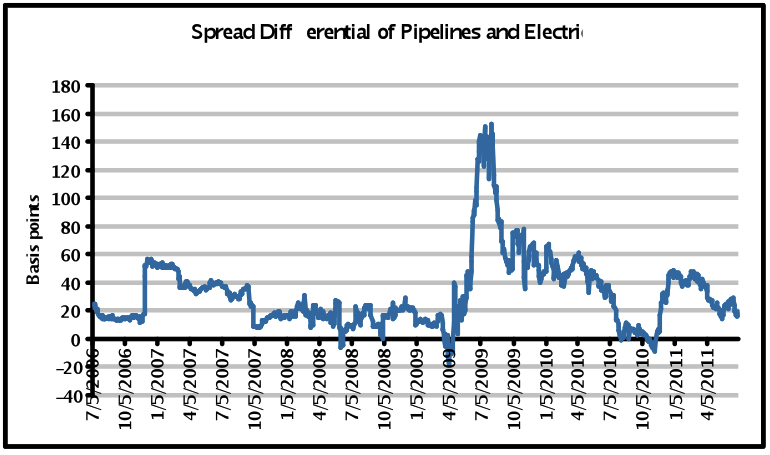
The warning signs raised over the last two months have tempered our optimism for excess returns this year. Although we had cited weak economic growth and sovereign risk as two of four main headwinds for 2011, the Beaufort Wind Force Scale is registering more of a strong gale than breeze. At current spread levels, we believe there are opportunities to both add and reduce various credits and sectors, but overall, believe spreads fairly reflect near term risk. New issue concessions were attractive once again during August, reflecting a secondary market that was illiquid and uncertain. This opportunity is likely to return in September given the expectation for heavy new issuance and headlines from Europe. An area we believe will continue to be highly volatile and vulnerable to downside risk is the European credit sector, namely Banks, Telecoms, and Utilities. Despite the spread widening in that sector (see Exhibit 2), we continue to avoid credits in the European Union (EU) periphery and have been reducing our exposure to financials in Europe outside of the periphery due to the increased systemic risk.
Exhibit 2
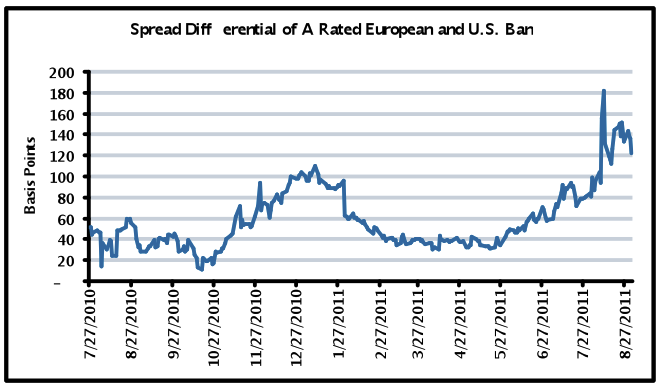
Source: Credit Suisse LUCI Index, 7-10 year maturities
The health of the European bank sector is inextricably linked to the health of the Euro area sovereigns. In contrast to the United States, the European banking sector is far more concentrated amongst a handful of large national champions, and the transmission of credit from investors to borrowers takes place more so through bank lending than through corporate and government bond markets. Because the European banking system is so integral to the funding of persistent deficits of Euro area sovereigns, questions about the solvency and liquidity of peripheral Euro area sovereigns (i.e., Greece, Portugal, Ireland, Spain, Italy) must lead to similar questions about the banks.
The origin of the sovereign crisis engulfing the Euro area has its roots in the 1992 Maastricht Treaty on European Union, and subsequent monetary union in 1999. While the union created a common monetary system and policy (set and implemented by the European Central Bank/ECB), fiscal policies were still set at the national level. Although the potential for (and likelihood of) divergent fiscal and debt profiles of the Euro area nations was clearly evident from the outset, sovereign debt investors made little distinction between the various sovereign issuers over the first decade of the monetary union’s existence (despite the obvious differences in fiscal health and relative debt burdens between stronger and weaker members of the union). This was partly a function of investors belief that no individual member would be allowed to fail (despite a “no bail-outs” clause in the Treaty). As well, European banks had a strong regulatory incentive to purchase sovereign debt (see Exhibit 3) as Basel capital rules assigned a much lower risk weighting to sovereign debt than to other credit exposures (and this classification is maintained under the Basel III regime that will go into effect in 2013).
Exhibit 3
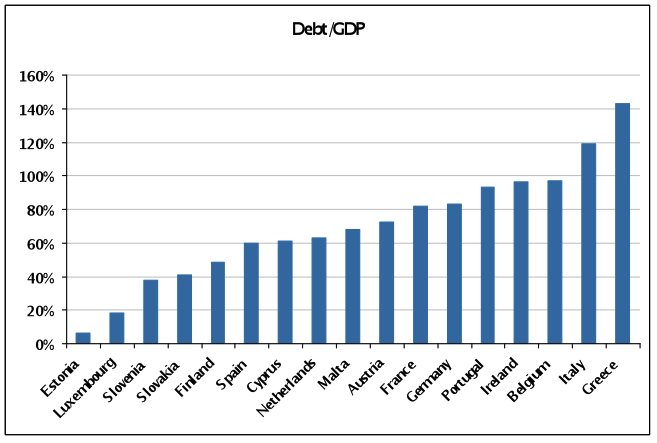
Source: European Central Bank
Beginning in late 2009, the market increasingly perceived the deterioration of the fiscal positions of various sovereigns in the Euro area as unsustainable, and began to make distinctions between the weaker peripheral sovereigns and the rest of the Euro area members. The process began with Greece which ultimately lost access to funding markets and was saved from default/restructuring through an aid package provided jointly by the EU and the International Monetary Fund (IMF) in May 2010. While it was hoped that this sign of commitment on the part of the EU to avoid a disorderly restructuring would serve to restore market confidence in the broader Euro sovereign market, the market successively forced Ireland and Portugal to seek similar bail-outs from the EU over the course of 2010 and the first half of 2011, culminating in a second request for aid from Greece in June 2011. A second, comprehensive aid package, a Greek debt restructuring, and flexible EU-wide liquidity facility were agreed to by the Euro area finance ministers in July 2011. However, sovereign debt markets immediately reflected their disappointment with the new liquidity facility (European Financial Stability Facility/EFSF) by forcing up the yields on Spanish and Italian sovereign debt, thereby forcing those nations to resort to the ECB to support their sovereign debt markets through secondary bond market purchases.
The inability of the EU to restore the confidence of the markets results from the failure to address the underlying imbalances between the seventeen national economies (rather than just addressing liquidity issues). While all of the peripheral Euro area sovereigns have instituted structural reform programs to address inefficiencies in their economies (particularly with regard to labor markets, taxation and ease of doing business) as well as fiscal austerity programs to eliminate budget deficits and reduce overall debt loads, the Euro area as a whole suffers from a shortage of credibility. In the absence of a credible enforcement mechanism for austerity measures, sovereign investors reasonably question why nations that have never shown fiscal rectitude in the past will suddenly reform themselves. However, the imposition of oversight by the EU would likely lead to domestic political opposition on the grounds that such oversight represents a forfeit of sovereignty (and the imposition of painful austerity measures lends such populist appeals all the more weight).
In the face of such intractable debt overhangs, the question of why struggling indebted sovereigns don’t just restructure their debt naturally arises. However, because of the European bank sector’s regulatory preference over the past decade for sovereign debt, the EU banks suddenly faced the prospect of write-downs on their substantial sovereign holdings that had previously been treated (and reserved for) as risk free assets (see Exhibit 4). The European bank sector’s credit issues are further exacerbated by the rapid expansion in cross-border banking within the EU in the decade following monetary union (examples include German Landesbank commercial real estate lending in Ireland, French bank acquisitions in Italy and Greece and United Kingdom (UK) residential mortgage lending in Spain). As a result, a restructuring of any one sovereign (i.e., Greece) would immediately render that nation’s bank sector insolvent and result in large write-downs for banks from other countries. As the sovereign debt crisis has moved from the smaller to the larger peripheral sovereigns, the implications for the entire European banking sector become more serious.
Exhibit 4
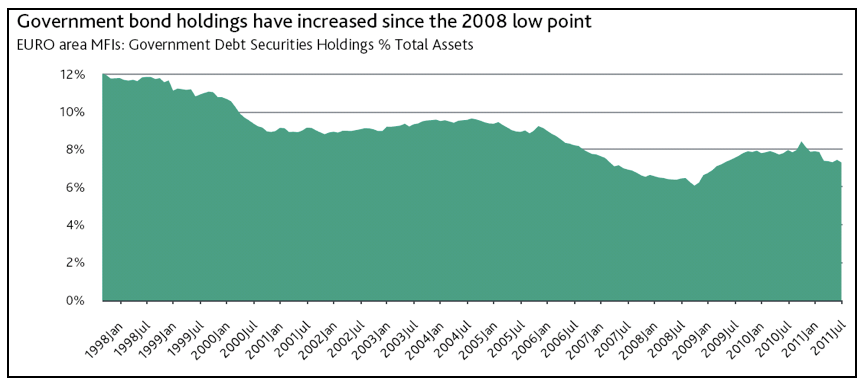
Source: European Central Bank
Faced with the prospect of having to bail out the entire European banking sector (with total assets of €41 trillion, well in excess of Euro area GDP of €11 trillion), or providing a liquidity life line to struggling peripheral sovereigns in return for promises of fiscal reform, the EU has opted to take the latter approach. Calls for issuance of a common “Eurobond” jointly and severally guaranteed by all Euro area members have been rejected by both Germany and France on the grounds that such a program in the absence of greater fiscal integration and reform would merely export the fiscal weakness of the periphery to the core of the Euro area. As a result, the Euro area is faced with the prospect of several years of painful fiscal adjustment on the periphery, and a likely continued need for substantial purchases of Italian and Spanish bond purchases by the ECB (as these two sovereigns’ refinancing needs are too large to be met by the EFSF). In the face of such a prospect, sovereign investors are justifiably unsettled by the potential for growing political resistance within the periphery to painful fiscal adjustments, and the potential for increasing inflation expectations with regard to the Euro as a result of the substantial volume of bond purchases that the ECB could be forced to undertake from Italy and Spain.
In the face of uncertainty about the ultimate resolution of the Euro area sovereign crisis, liquidity in the bank wholesale funding markets has begun to tighten. This is most notable in widening spreads in the secondary market for unsecured European bank bonds and a near complete halt in new issue market for European bank debt since July 2011. At the same time, Euribor (a measure of the cost of short term bank borrowing) has begun to rise (see Exhibit 5), signaling challenges in raising funding in the interbank and money markets. While liquidity conditions are not nearly as bad as they were in the wake of the collapse of Lehman Brothers in September 2008, the trend is worrying, as European banks are much more dependent on wholesale funding than the more deposit rich US banks. However, there are a number of factors that leave the sector as a whole in a better position to weather the funding disruptions than in 2008. Most notably, the sector has considerably reduced leverage and has substantially extended the duration of outstanding wholesale funding over the past three years. Additionally, European banks hold substantially larger amounts of liquid assets than they did heading into fall of 2008. As a result, there is much less of an immediate need to replace maturing funding, as the banks can either run down their balance sheets liquidity pools to redeem debt, or replace maturing unsecured debt with secured funding using the same liquid assets as collateral.
Exhibit 5
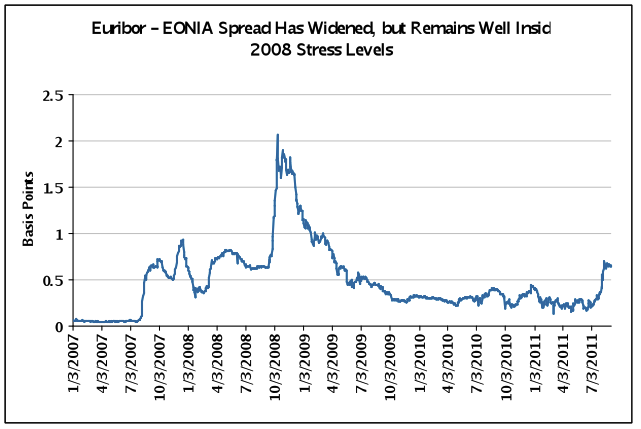
Source: Bloomberg
Finally, the ECB has increasingly asserted itself as the lender of last resort to the European bank sector; a role that it was previously hesitant to embrace. The ECB has been utilizing its standard monetary policy operations (Main Refinancing Operation/short-term repo and the Marginal Lending Facility/ECB equivalent of the discount window) as well as non-standard monetary tools established in response to the 2007/2008 financial crisis (long-term repos, outright securities purchases and foreign currency swap lines) to provide liquidity support to stressed parts of the European banking sector (see Exhibit 6). Beginning in mid-2010, the ECB progressively began to provide unlimited funding to the Greek, Irish and Spanish savings bank sectors, as well as engaging in purchases of those countries sovereign debt. The ECB has also shown considerable flexibility in the collateral it deems acceptable, thus further increasing the liquidity available to stressed bank sectors. As the sole authority for monetary creation and policy implementation, the ECB has unlimited capacity to provide liquidity to both individual banks and sovereigns, although capacity for the same would ultimately be constrained by inflationary pressures that would ultimately arise from such actions (and which has engendered considerable resistance from various members of the EU; most notably Germany).
Exhibit 6
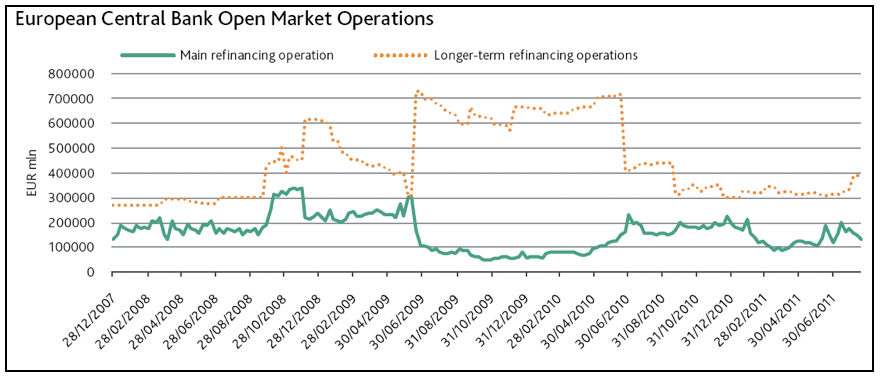
Source: European Central Bank
The combination of stronger liquidity profiles and lower leverage within the broad European bank sector heading into the sovereign crisis, as well as the increasing support provided by the ECB gives comfort that the sector is not in danger of an imminent liquidity crisis. Within that context, the strongest banks domiciled within the strongest and most supportive core EU nations remain fundamentally sound from a credit perspective. However, until the underlying questions about the Euro area’s ability to achieve greater fiscal integration are answered and the creditworthiness of its weaker peripheral members is resolved, the investment performance of the European banking sector will be plagued by wider overall trading levels and episodic bouts of volatility. In the near-term, the parliamentary approval process for the new Greek bail-out (unanimous approval required) and the recapitalization of the Spanish savings bank sector are possible political triggers to further volatility. In the intermediate-term, the national elections in France and Germany in 2012, as well as the ability to the peripheral sovereigns to maintain their austerity programs and achieve targeted economic growth levels will be key trends to follow. The challenges the EU faces in achieving a consensus on the future form of the Union (both political and economic), and the protracted time line of the EU’s current approach, argue for a very cautious stance with regard to ongoing investments in the sector.
Written by:
Elizabeth G. Henderson, CFA
Director of Corporate Credit
Sebastian Bacchus, CFA
Vice President, Corporate Credit
Disclaimer: Asset Allocation & Management Company, LLC (AAM) is an investment adviser registered with the Securities and Exchange Commission, specializing in fixed-income asset management services for insurance companies. This information was developed using publicly available information, internally developed data and outside sources believed to be reliable. While all reasonable care has been taken to ensure that the facts stated and the opinions given are accurate, complete and reasonable, liability is expressly disclaimed by AAM and any affiliates (collectively known as “AAM”), and their representative officers and employees. This report has been prepared for informational purposes only and does not purport to represent a complete analysis of any security, company or industry discussed. Any opinions and/or recommendations expressed are subject to change without notice and should be considered only as part of a diversified portfolio. A complete list of investment recommendations made during the past year is available upon request. Past performance is not an indication of future returns.
This information is distributed to recipients including AAM, any of which may have acted on the basis of the information, or may have an ownership interest in securities to which the information relates. It may also be distributed to clients of AAM, as well as to other recipients with whom no such client relationship exists. Providing this information does not, in and of itself, constitute a recommendation by AAM, nor does it imply that the purchase or sale of any security is suitable for the recipient. Investing in the bond market is subject to certain risks including market, interest-rate, issuer, credit, inflation, liquidity, valuation, volatility, prepayment and extension. No part of this material may be reproduced in any form, or referred to in any other publication, without express written permission.
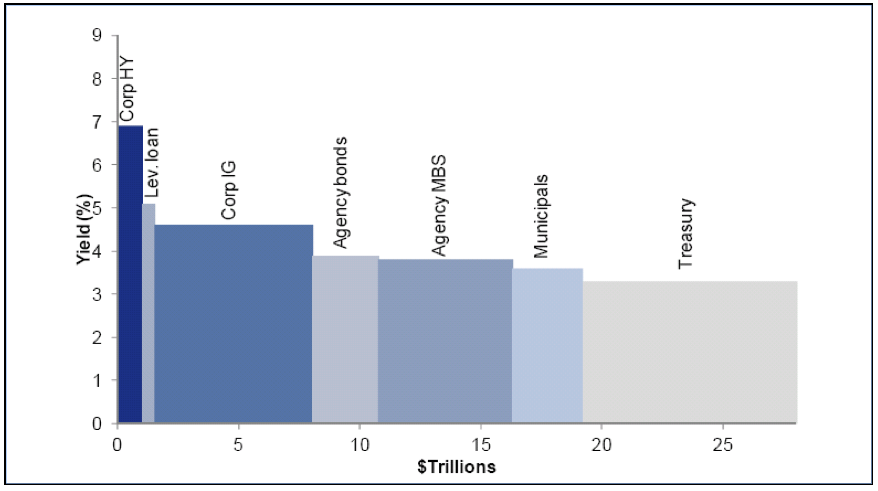
 Source: Barclays, AAM
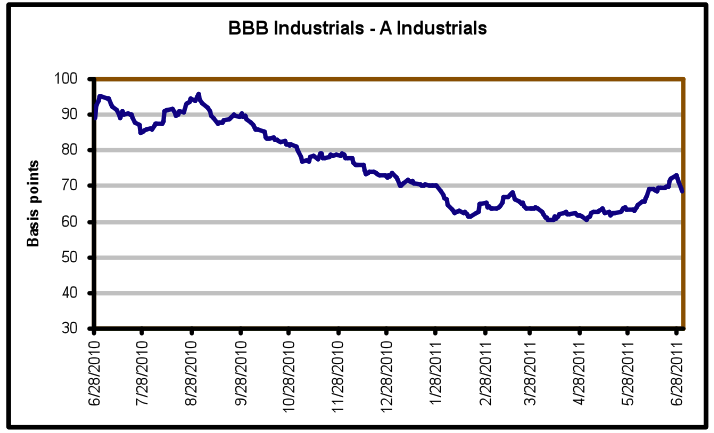 Source: Barclays, AAM
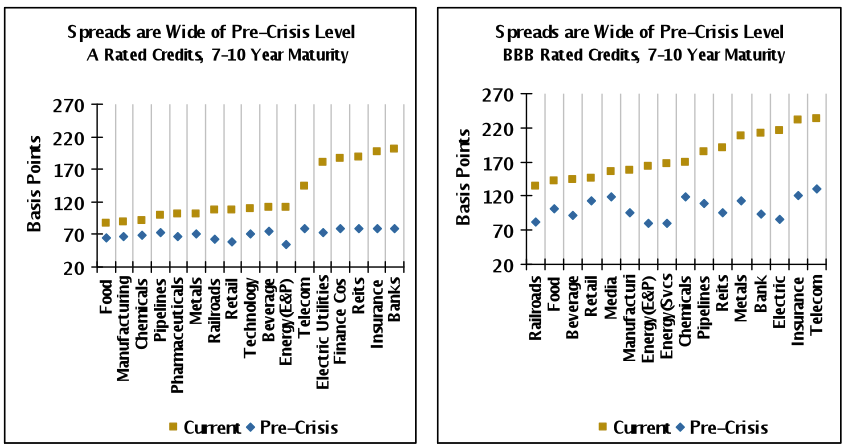

 Source: Bloomberg