Too Far Too Fast?
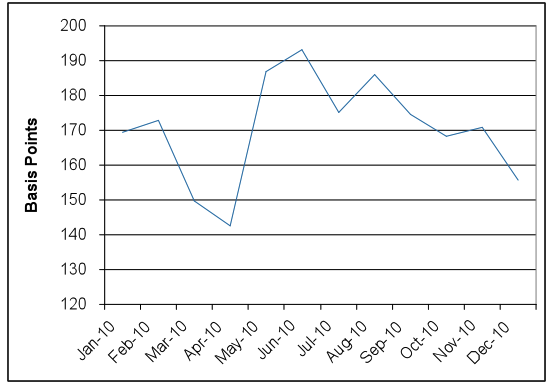
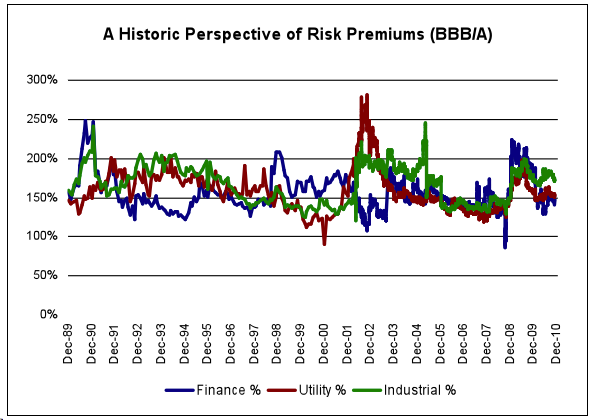
As equity markets sell off due to concerns about global growth, whether it be from the disaster in Japan, rising oil prices or political unrest, the Corporate market has been relatively resilient. The correlation between the two markets has been above average, breaking down over the last month. The Corporate market’s Option Adjusted Spread (OAS) as of March 14, 2011 as represented by the Barclays Capital Corporate Index, has widened 2 basis points (bps) from the minimum in mid-February. Year-to-date, the OAS is 15 bps tighter, producing 137 bps of excess returns (107 bps excess return for Industrials, 103 bps for Utilities, 193 bps for Finance). The lower rated credits are outperforming (177 bps of excess return for BBB rated credits vs. 129 bps for A rated credits). We had expected this type of performance for the year and have achieved a significant amount in the first two months. Spreads of higher quality Industrial credits are very close to their minimums reached in 2006. We would not be surprised to see spreads widen in March, as global growth estimates are revised lower and investors shun nuclear related credits.
Economic data has largely met or exceeded expectations, reflected in rising Gross Domestic Product (GDP) and Earnings Per Share (EPS) estimates. Earnings season has been largely positive as well with all nine of ten broad sectors (Utilities disappointed) surprising to the upside (sales and earnings per share). The National Federation of Independent Business (NFIB) small business survey, to which we pay particular attention, continues to show an improving trend. Consumer confidence is increasing despite stagnant wages and job creation. The unemployment rate is falling mainly due to the number of workers dropping out of the labor force, perplexing many economists.
Focus has moved from the backward looking data to the turmoil in the Middle East and Japan, causing investors and likely management teams to rescind and reflect on the fragility of the global economy. In fourth quarter earnings calls, management teams were largely cautiously optimistic for 2011, expecting modest GDP growth. The risks to their forecasts are not immaterial, as the uprising in the Middle East resulted in the price of oil moving 16% from $90.77/bbl to $105.25/bbl from the start of February to March 7, 2011 before the earthquake in Japan. Deutsche Bank economists estimate that if oil reaches $150/bbl over a sustained period of time, global GDP could contract 50-60% from the current estimate for 2011 of 4.3%. They are assigning a 10-15% probability to that scenario[note]Peter Hooper and Thomas Mayer, “Oil and the Global Economy: Measured Impact,”Global Economic Perspective, Deutsche Bank, March 3, 2011[/note]. Bank of America Merrill Lynch believes if oil goes above its historic peak of $150/bbl on a sustained basis, a global recession becomes a real risk and at $200/bbl, it is almost certain.[note]Ethan Harris and Alberto Ades, “An Oil Shock to the Global Economic Forecast,”Global Economics, Bank of America Merrill Lynch, March 8, 2011[/note]
Our forecasts assume oil remains in a $80-100/bbl range, which is manageable for the economy and particularly constructive for the Energy sector, to which we are favorably disposed (See Exhibit 1). With Libya off line, the oil utilization rate (demand/supply), increases from 92% to 93.5%. If unrest emerged in Saudi Arabia, oil would spike, as the utilization rate would exceed 100%. In this environment, we would expect Corporate credit spreads to widen materially due to the fear of a slowdown in world growth. Similarly, Credit Suisse’s economists are forecasting a 1 percentage point reduction in global GDP growth from the disaster in Japan in a worst case scenario (0.2% is their central case)[note]Garthwaite, Andre, “Further comments on the impact of Japan,”Credit Suisse, Global Equity Strategy, March 15, 2011[/note]. Whether it’s the unrest in the Middle East or the uncertainty in Japan, both highlight the vulnerability of GDP to events that are very difficult to predict.
Exhibit 1
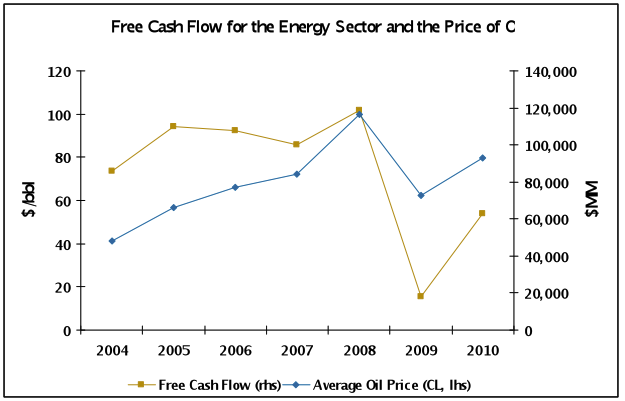
Source: Bloomberg; 2010 adjusted for BP’s cash obligations related to the oil spill
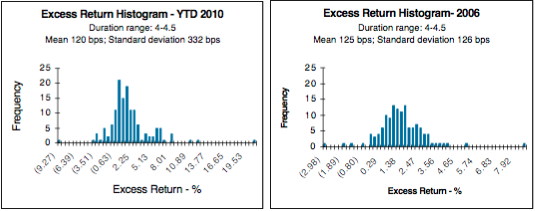
Accordingly, until there is more clarity, analysts have been unable or perhaps unwilling to model the effect of higher input costs on margins due to the number of uncertainties – i.e., level and duration of input prices, price increases for final goods, cost reductions, end user demand (See Exhibit 2).
Exhibit 2
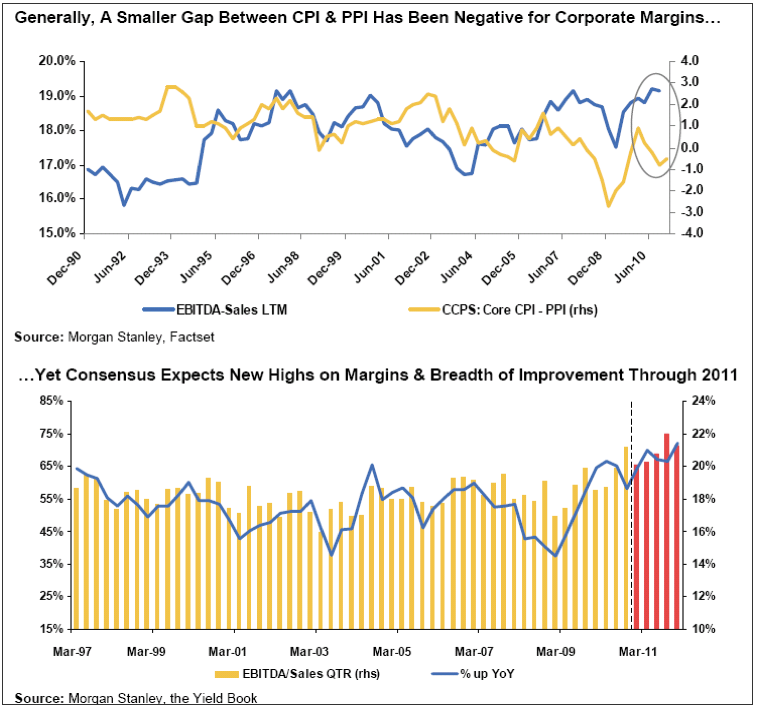
While companies claim they intend to raise prices frequently in small percentage increments and absorb the remainder via cost savings programs, we question firms’ abilities to meaningfully reduce costs from current levels and raise prices when consumers are still deleveraging. Positively, some firms do believe they will be able to raise prices, as noted in the NFIB March 2011 small business survey, with 21% of owners (net seasonally adjusted) planning to raise prices in the future.
The Corporate market has performed well year-to-date, and we would not be surprised to see spreads widen in March. The reverberations of the financial crisis are still being felt with GDP growth rates vulnerable to exogenous shocks. We believe 2011 will look much like 2010, as these shocks cause investors to question economic stability. Spreads have tightened and while we consider them to be largely fair but vulnerable to near term widening, we expect them to be range bound as the technical environment is very positive for spreads. In a time of uncertainty, Corporate credit is a good investment alternative, and when supply is relatively tight as it is today, it is difficult for many to invest in the sector.
Disclaimer: Asset Allocation & Management Company, LLC (AAM) is an investment adviser registered with the Securities and Exchange Commission, specializing in fixed-income asset management services for insurance companies. This information was developed using publicly available information, internally developed data and outside sources believed to be reliable. While all reasonable care has been taken to ensure that the facts stated and the opinions given are accurate, complete and reasonable, liability is expressly disclaimed by AAM and any affiliates (collectively known as “AAM”), and their representative officers and employees. This report has been prepared for informational purposes only and does not purport to represent a complete analysis of any security, company or industry discussed. Any opinions and/or recommendations expressed are subject to change without notice and should be considered only as part of a diversified portfolio. A complete list of investment recommendations made during the past year is available upon request. Past performance is not an indication of future returns.
This information is distributed to recipients including AAM, any of which may have acted on the basis of the information, or may have an ownership interest in securities to which the information relates. It may also be distributed to clients of AAM, as well as to other recipients with whom no such client relationship exists. Providing this information does not, in and of itself, constitute a recommendation by AAM, nor does it imply that the purchase or sale of any security is suitable for the recipient. Investing in the bond market is subject to certain risks including market, interest-rate, issuer, credit, inflation, liquidity, valuation, volatility, prepayment and extension. No part of this material may be reproduced in any form, or referred to in any other publication, without express written permission.

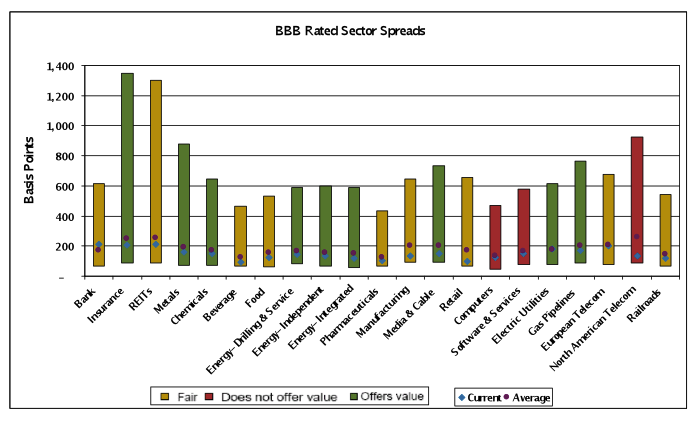 Source: Credit Suisse LUCI Index, 08/02/02 – 1/31/11, 7 – 10 year maturities Note: The bars represent the minimum to maximum spread range for the period.
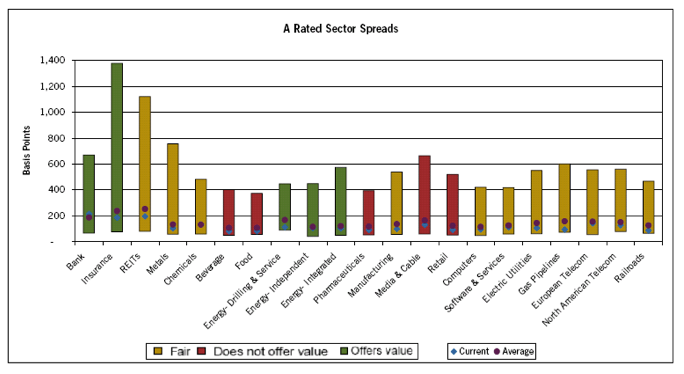 Source: Credit Suisse LUCI Index, 08/02/02 – 1/31/11, 7 – 10 year maturities Note: The bars represent the minimum to maximum spread range for the period.
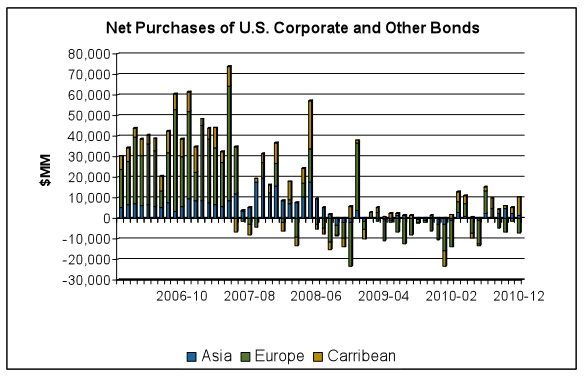 Source: Department of the Treasury