• Skip to primary navigation
  • Skip to main content
  • Skip to footer
AAM CompanyTransparent Logo

AAM Company

AAM Company Website

  • Investment Strategies
    • Investment Grade Fixed Income
    • Specialty Asset Classes
  • Clients
    • Our Clients
    • Client Experience
    • Download Sample RFP
  • Insights
    • Video
    • Webinars
    • Podcasts
    • News
  • About
    • Our Team
    • Events
  • Login
  • Contact Us
Contact

Corporate Credit

August 10, 2012 by

Keeping It Simple

  • Corporate Bond Market Outperformed Treasuries in July
  • Near Term Outlook Uncertain with Politics in the U.S. and Europe
  • Cost Cuts are Likely in the Near Term as Gross Margins are Compressing
  • Simple Business Models Look Attractive

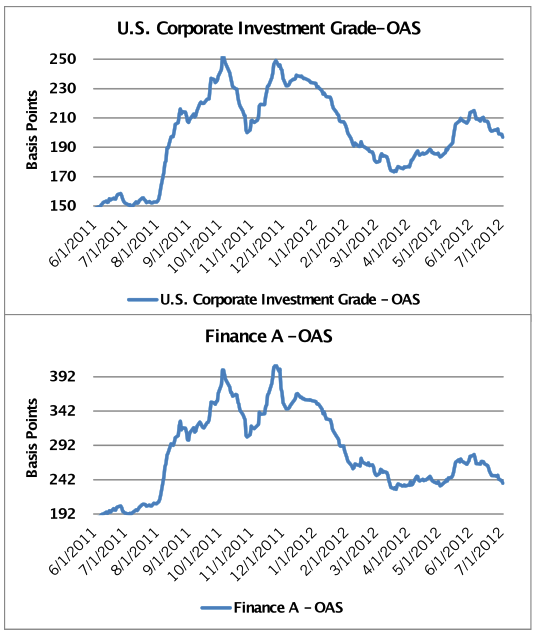
Investment Grade Corporate Bond Spreads Continue to Tighten in July

Investment grade corporate bond performance in July was strong across all three broad sectors and rating categories. The market earned 1.62% over Treasuries in July, increasing the year-to-date excess return to 4.35% per Barclays Capital. “BBB” rated securities have earned 4.30% over Treasuries and “A” rated securities 4.69% year-to-date (1.63% and 1.68%, respectively, in July). From an industry perspective, Media-Cable outperformed in July (3.17% excess return) and Supermarkets underperformed (-1.56%). The domestic high yield market also performed well, earning 1.25% over Treasuries in July, bringing the yield for the B/BB market down to an all time historic low of less than 6%. In Europe, its Corporate market had a good month as well, earning 0.58% of excess return in July according to Barclays Capital. New issuance in all markets was fairly robust, and for most deals in the domestic investment grade market, new issue concessions remain lackluster.

Company Fundamentals are Strong but Weakening

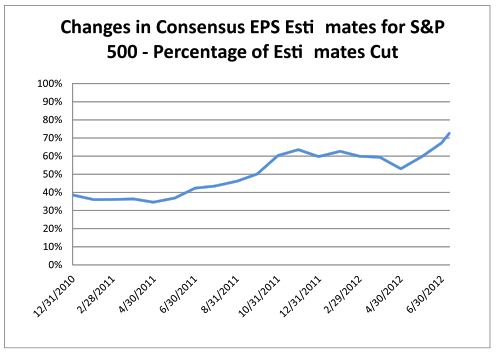
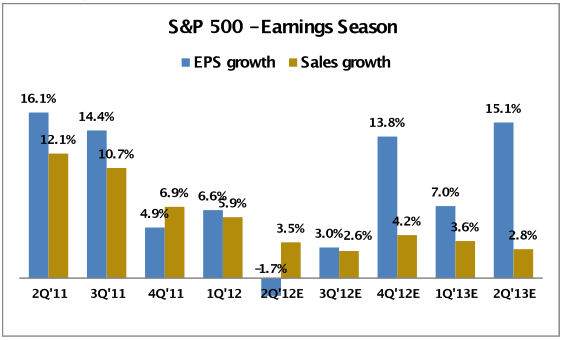
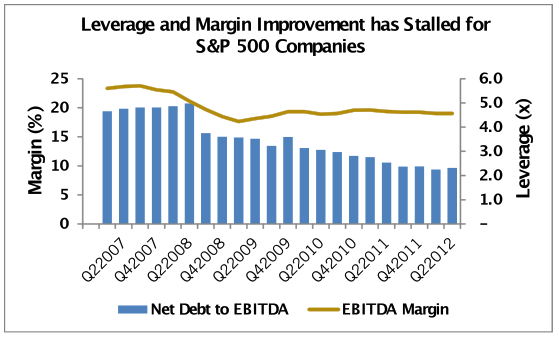
Like the equity market, the corporate bond markets benefited from central bank statements in Europe and the United States that implied willingness for further quantitative easing and economic support. After an initial wave of negative reports, earning reports came in broadly as expected with revenue surprises in Finance and Energy offset by weakness in Materials and Utilities. All sectors but Materials posted better than expected earnings in the quarter. That said, management commentary was either fairly cautious or uncertain about the second half of the year, and with the dollar continuing to fall and growth slowing worldwide, we believe management teams will look to cut costs more aggressively over the next six months. Debt leverage increased this year for the first time since second quarter 2008, as measured by net debt to EBITDA for S&P 500 companies, from 2.26x at the end of the first quarter to 2.33x at the end of the second quarter. Moreover, for 200 high yield issuers that have reported results, EBITDA growth was marginally positive (0.6% year-over-year) and revenues were up 1.5%, but Cost of Goods Sold increased 2.2.[1] This has been the trend for the S&P 500 constituents since the fourth quarter of 2011. Accordingly, we expect companies to pull back on more discretionary spending and reduce headcount and/or capital spending.

Politics will be a Drag on the Economy

The potential deterioration in consumer confidence from an election that reminds voters of domestic fiscal and economic challenges not to mention the drag on the economy if Congress does not act to raise the debt ceiling and/or prevent the fiscal cliff ($600 billion of tax increases and spending cuts due January 1, 2013), is not conducive for business related expansion. Economists are beginning to assign probabilities, recognizing the difficulty of doing so as the election is very close. Goldman Sachs recently published their thoughts on the fiscal cliff, assigning a probability of 33%. Goldman’s base case is a slight drag from fiscal policy of 1.5% in 2013 due to the payroll tax expiration and slowing government spending.[2] That is better than the 4% contraction if Congress allows us to fall off the cliff, placing the economy in a recession.

How has AAM been Investing in Corporates?    

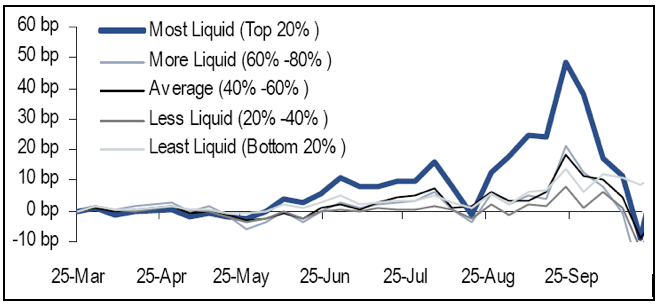
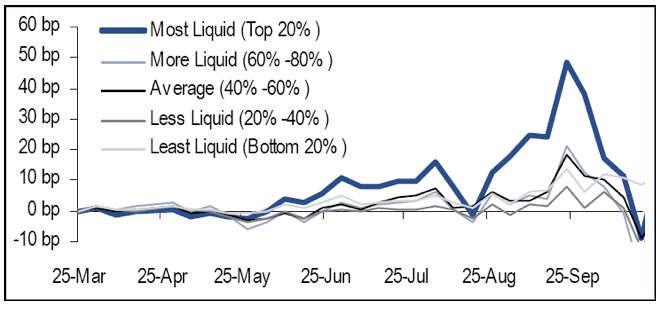
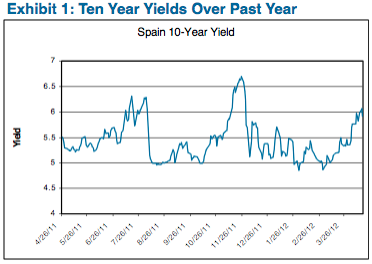
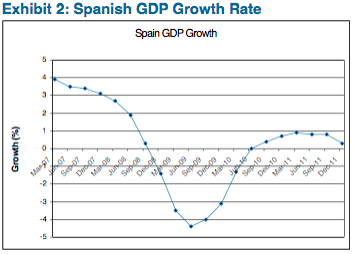
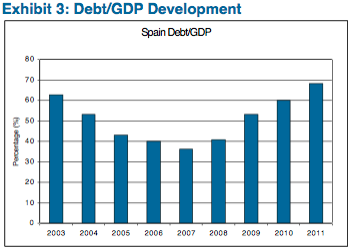
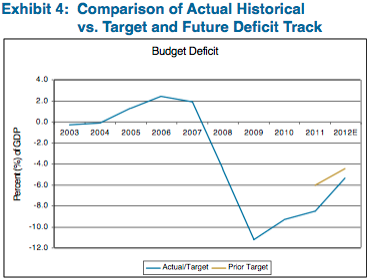
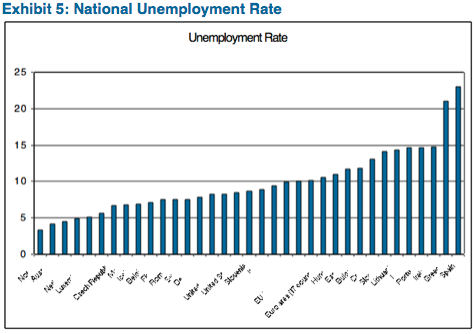
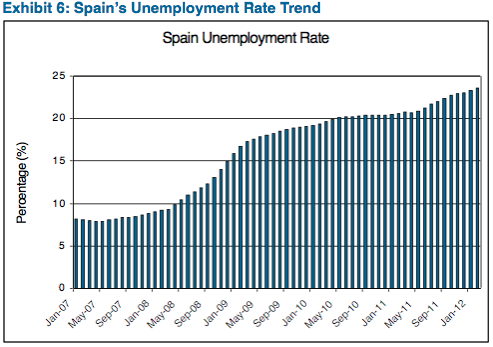
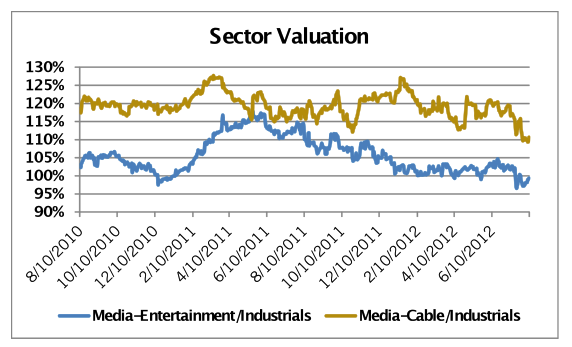
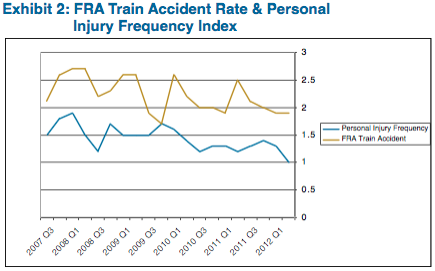
Economically, we expect growth to remain slightly positive in the U.S. for the second half and issues in Europe to resurface in early fall, expecting Spain to request assistance from the “Troika” (European Union (EU)/European Central Bank (ECB)/International Monetary Fund (IMF)), and China to continue to support its economy as growth slows. With this volatility, we expect Corporate spreads to widen, leading to a buying opportunity. Over the past month, we have been reducing our exposure to sectors and credits that are economically sensitive with spreads that are rich and vulnerable to underperformance (Exhibit 1). This includes Media related credits that have recently outperformed (Exhibit 2). We believe advertising spending could be less than the market expects as companies pull back to preserve margins and growth remains stagnant.

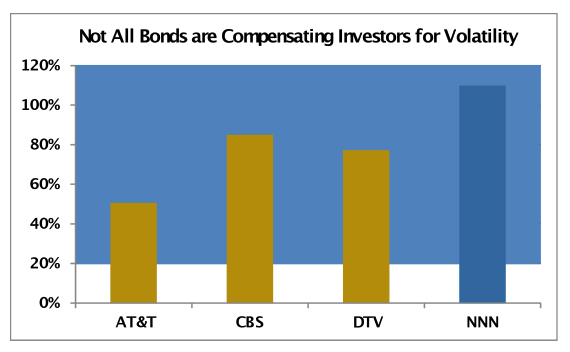
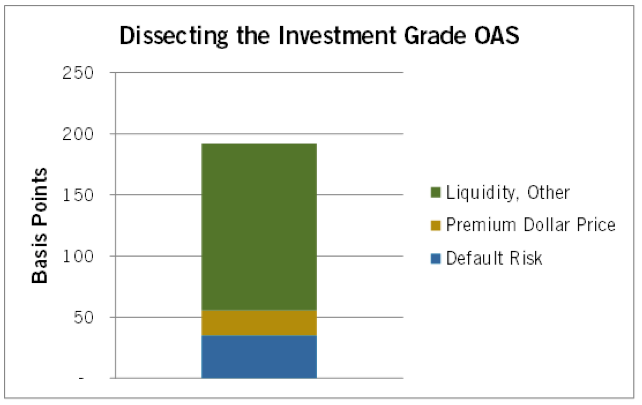
We have been selectively adding credits in the new issue market, private and public, which offer attractive yields to compensate for liquidity and size of the enterprise. In this period of market illiquidity and political complexity, we prefer investing in simple business models where one is getting paid for liquidity and business risk. As an example, National Retail Properties (NNN) issued a 10-year bond at 3.8%. It is a mid-BBB rated REIT with a $3.2 billion market capitalization. It was one of a select few that did not have to cut their dividend during the financial crisis given their prudent financial management. Their business is straightforward, managing triple-net leased retail properties. Under the triple net lease model, tenants are signed to long-term (typically 12 to 15 years) leases that include automatic rent increases and adjustments for capital improvements and taxes (all inflation/pricing risk retained by lessee). The company underwrites new acquisitions based on the attractiveness of the real estate first and foremost (ease of re-leasing, if the lessee fails), although it also carefully underwrites the lessees and typically does not enter into leases with businesses that have less than a 7 to 10 year track record. An issue size of $325 million and total public debt outstanding of $1.5 billion means this issuer is difficult to find in the secondary market.

Exhibit 1
AAM Corp Credit 8-12 1
Source: AAM, Barclays Capital as of 8/8/2012. DTV=DirecTV
Calculated as the breakeven spread (OAS/Duration) divided by Standard Deviation.

Exhibit 2

AAM Corp Credit 8-12 2
Source: AAM, Barclays Capital as of 8/9/2012

Written by:
Elizabeth Henderson, CFA
Director of Corporate Credit

Disclaimer: Asset Allocation & Management Company, LLC (AAM) is an investment adviser registered with the Securities and Exchange Commission, specializing in fixed-income asset management services for insurance companies. This information was developed using publicly available information, internally developed data and outside sources believed to be reliable. While all reasonable care has been taken to ensure that the facts stated and the opinions given are accurate, complete and reasonable, liability is expressly disclaimed by AAM and any affiliates (collectively known as “AAM”), and their representative officers and employees. This report has been prepared for informational purposes only and does not purport to represent a complete analysis of any security, company or industry discussed. Any opinions and/or recommendations expressed are subject to change without notice and should be considered only as part of a diversified portfolio. A complete list of investment recommendations made during the past year is available upon request. Past performance is not an indication of future returns.

This information is distributed to recipients including AAM, any of which may have acted on the basis of the information, or may have an ownership interest in securities to which the information relates. It may also be distributed to clients of AAM, as well as to other recipients with whom no such client relationship exists. Providing this information does not, in and of itself, constitute a recommendation by AAM, nor does it imply that the purchase or sale of any security is suitable for the recipient. Investing in the bond market is subject to certain risks including market, interest-rate, issuer, credit, inflation, liquidity, valuation, volatility, prepayment and extension. No part of this material may be reproduced in any form, or referred to in any other publication, without express written permission.

[1] Hans Mikkelsen, “Over the Hump,” Bank of America Merrill Lynch Global Research: A Credit Strategy Report (August 6, 2012): 1.

[2] Allison Nathan and Alec Phillips, “Staring Down the Fiscal Cliff,” Goldman Sachs Global Investment Research (August 8, 2012): 4-5.

July 16, 2012 by

Focus Will Be on the U.S. in the Second Half of 2012

  • Volatility has Increased in the Corporate Bond Market But is Lower than 2011
  • Expect a Lackluster Earnings Season
  • Company Fundamentals Have Plateaued
  • Performance for the Investment Grade Market in the Second Half of 2012 is Expected to be Subdued Relative to a Strong First Half

Investment Grade Corporate Bond Spreads Continue to React to Economic Concerns

Volatility has increased in the Corporate bond market, reacting to a more pessimistic worldwide economic outlook. European fears remain elevated, despite positive headlines around the last summit, and investors are questioning the growth trajectory of the U.S. for the second half of 2012. Company revenue and earnings estimates have been revised lower, and mergers and acquisition activity has slowed substantially. Positively, after a subdued May, investment grade and high yield companies, both domestically and internationally, issued new bonds. Concessions for these new issues became more attractive, reflecting the market uncertainty. Investors reduced their exposure to Corporates, and broker-dealer inventory remains very low relative to historic levels.

Exhibit 1
AAM Corp Credit 7-12 1
Sources: Barclays Capital, AAM

Since our last publication in mid May, Corporate spreads are relatively unchanged after widening in May and tightening in June. Investors earned 2.63% in addition to their return from Treasuries for Corporate bonds in the first half of 2012. The spread over Treasuries for the Corporate market is currently at its last twelve month average, trading in a 61 basis point (bp) range this year, less volatile than its 103 bps range over the last twelve months (Exhibit 1). The Financial sector has outperformed by a wide margin (582 bps of excess return over Treasuries per Barclays), followed by BBB Industrials (187 bps). Five to seven year securities have outperformed longer dated bonds (461 bps vs. 178 bps).[1]

Earnings Season Is Expected To Be Lackluster

The second quarter earnings season will be a good indication of how companies are dealing with the more challenging economic and political conditions. We note that company issued financial guidance for the second quarter is the most negative since fourth quarter 2008, and more analysts have cut guidance for 2012 earnings per share (EPS) than during the crisis last year (Exhibit 2). The strengthening of the dollar has resulted in downward revisions to estimates as well as lowered economic growth expectations.

Exhibit 2
AAM Corp Credit 7-12 2
Sources: Bloomberg, AAM

Revenue growth expecta-tions for the quarter are also the lowest since fourth quarter 2009. Margin compression is evident with revenue growth expected to exceed earnings growth after a period of margin expansion (Exhibit 3). Additionally, as shown in Exhibit 3, earnings expectations are quite high for the second half 2012 and for 2013, reflecting optimism regarding a resolution in Europe and worldwide growth. Lastly, we expect management to remain fairly guarded when communicating expectations for the second half of this year, which will not quell market fears of slower growth.

Exhibit 3
AAM Corp Credit 7-12 3
Sources: Bloomberg, AAM

At an industry level, companies are managing the expectation for slower growth differently depending on industry conditions. For instance, as we get closer to the election, analysts have been revising down capital spending estimates for Defense contractors for fear that proposed spending cuts will crimp growth in this sector. This slowdown continues into 2013 for the sector. On the other hand, the Railroad industry continues to show growth having managed through the major slowdown in coal usage that is such an important part of their business. Capital spending estimates continue to get revised higher even as GDP growth slows. This is a testament to the Rail industry and its secular advantages.

Fundamental Improvement Has Plateaued

From a bondholder perspective, the cycle of credit enhancement has ended (Exhibit 4).  The current environment of low interest rates and market volatility makes it less compelling for treasurers to continue to build cash, looking instead to increase their shareholder remuneration.  As growth continues to slow, we recognize the increased likelihood that leverage is used to generate returns for shareholders.  For most companies, we expect that to occur within their rating levels. That said, we have seen increased shareholder activism, pressuring management to be more aggressive with their balance sheets. To date, companies that have split or sold assets have generally done so without rating implications and material spread widening. We believe the market is becoming complacent by failing to recognize the deterioration of asset and cash flow protection for bondholders. We are taking a more cautious stance towards sectors that we expect will be challenged from a growth perspective, specifically Food, Defense, and Consumer Products.

Exhibit 4
AAM Corp Credit 7-12 4
Sources: Bloomberg, AAM

Due to the strong liquidity and deleveraging that has taken place, default expectations remain very low and as such, very little spread over Treasuries is required to compensate one for default risk in the investment grade market (Exhibit 5). We do not expect that to change in the near term unless an unexpected event occurs in Europe or the probability of a recession increases for the U.S.

Exhibit 5
AAM Corp Credit 7-12 5
Source: Default risk measured by Deutsche Bank (“2012 Default Study” April 16, 2012) using data from 1920, 10 year default period with 20% recovery; Barclays Capital Corporate Index as of July 13, 2012 used for total OAS and market price; AAM calculated market price premium as 1.5bps per bond point.

Macro Factors Will Continue to Drive Credit Spreads Over the Near Term with Particular Focus on the U.S.

Performing a regression analysis using economic and credit fundamental variables since 2009 to predict the Option Adjusted Spread (OAS) of the Investment Grade Corporate Index shows that approximately 80% of the variance in OAS can be explained by macro economic related variables. Adding more micro level variables (e.g., earnings revision ratio) increases this to approximately 93%. While we appreciate this relationship and apply a top down view to our credit analysis, we understand that at some point, credit spread volatility will be driven more by idiosyncratic vs. systemic risks.

Unfortunately, for the near term, we expect political and fiscal debates in the U.S. as well as events in Europe to drive spreads, keeping the market largely range bound around 200 bps. Our investment thesis remains unchanged, maintaining a more defensive Corporate portfolio. We continue to believe that Corporate bonds can produce positive returns over Treasuries in 2012; however, we do not expect the second half of the year to generate the level of excess return experienced in the first half (2.6% for the Barclays Capital Corporate Index). We anticipate a buying opportunity later in the year, when the risk of a U.S. recession increases.

Written by:

Elizabeth Henderson, CFA
Director of Corporate Credit

Disclaimer: Asset Allocation & Management Company, LLC (AAM) is an investment adviser registered with the Securities and Exchange Commission, specializing in fixed-income asset management services for insurance companies. This information was developed using publicly available information, internally developed data and outside sources believed to be reliable. While all reasonable care has been taken to ensure that the facts stated and the opinions given are accurate, complete and reasonable, liability is expressly disclaimed by AAM and any affiliates (collectively known as “AAM”), and their representative officers and employees. This report has been prepared for informational purposes only and does not purport to represent a complete analysis of any security, company or industry discussed. Any opinions and/or recommendations expressed are subject to change without notice and should be considered only as part of a diversified portfolio. A complete list of investment recommendations made during the past year is available upon request. Past performance is not an indication of future returns.

This information is distributed to recipients including AAM, any of which may have acted on the basis of the information, or may have an ownership interest in securities to which the information relates. It may also be distributed to clients of AAM, as well as to other recipients with whom no such client relationship exists. Providing this information does not, in and of itself, constitute a recommendation by AAM, nor does it imply that the purchase or sale of any security is suitable for the recipient. Investing in the bond market is subject to certain risks including market, interest-rate, issuer, credit, inflation, liquidity, valuation, volatility, prepayment and extension. No part of this material may be reproduced in any form, or referred to in any other publication, without express written permission.

[1] Barclays Capital data as of July 6, 2012.

May 30, 2012 by

A Negative Rating Forecast Adds to Pressure on Yield Starved Life Insurance Companies

Investment Grade Corporate Bond Spreads Increase

Spreads have widened to reflect the increased volatility and credit risk associated with the increased uncertainty in Europe and the implications of the JP Morgan trading loss. The corporate market underperformed Treasuries in April by 50 basis points (bps), as spreads widened 9 bps. Month-to-date as of May 21, the corporate market has underperformed Treasuries by 151 bps with spreads widening 22 bps. Importantly, we had a strong start to the year. Therefore, year-to-date as of May 21, the corporate market has outperformed Treasuries by 185 bps, generated mainly by Financials and BBB rated Industrials. This week, new deals are being priced with above average new issue concessions, a change from how the market has behaved since February.   Our expectation is for this volatility to continue, with spreads likely to widen in the near term.

Earnings season is drawing to a close and results are largely better than expected (earnings 6% and sales 2% better than expected). Management’s tone on conference calls in regard to results for the year was more cautious given the uncertainties regarding Europe and the fiscal and economic conditions in the U.S.

Rating Forecast Turns Negative

Standard & Poor’s (S&P) published its monthly Credit Trends report[1] on May 17, 2012 stating that the number of potential downgrades is at its highest since October 2010. Although as Exhibit 1 shows, this level remains below pre-recessionary periods and based largely on a methodology change in the bank sector. We have been anticipating rating downgrades for the bank sector, with S&P and Moody’s changing their methodologies. The new S&P methodology explicitly anchors bank ratings off of the sovereign and bank regulation score of that bank’s primary domicile. Similarly, Moody’s is changing its rating methodology to reflect its view that banks and brokerage firms are undergoing secular changes. Factors that Moody’s is considering for domestic banks include: a heavy reliance on wholesale funding, opacity of risk profiles and interconnectedness, and evolving regulation and business models. For European banks, the review is being driven by a difficult operating environment, weakening sovereign creditworthiness, and challenges from capital market activities. For both European and domestic banks, we expect rating downgrades to be one-to-three notches. Moody’s started by downgrading Italian banks last week, and we expect the actions to be completed by July 2012. S&P’s negative outlooks for the banks reflect the sovereign outlooks as well as counterparty risk if liquidity and funding stresses in Europe spread to the U.S.

Exhibit 1
AAM Corp Credit 5-12 1

Exhibit 2
AAM Corp Credit 5-12 2

Exhibit 2 shows that not only are Banks pressured from a ratings perspective but also Utilities and Media companies. Utility rating outlooks are negative due largely to the negative outlook/watch assigned to the respective sovereign (mainly in Europe and Japan) or low natural gas prices. The vast majority of the Media credits that are on Negative Watch/Outlook are below investment grade, and Media is a sector that suffers from a high degree of negative rating bias (Exhibit 3). Of the 32 sovereigns on the potential downgrade list, 75% are in Europe. Clearly, the ratings bias is more negative for Europe than the U.S. (Exhibit 4).

Exhibit 3
AAM Corp Credit 5-12 3
Exhibit 4
AAM Corp Credit 5-12 4

Implications for the Life Industry

The quality of the investment grade corporate bond market has fallen dramatically over the last decade (Exhibit 5). We would expect this trend to continue as long as funding costs remain so low. This places added pressure on life insurance companies that manage to an average credit quality while searching for more yield. S&P entered the year with the expectation that Treasury rates would rise (10-year Treasuries: 2.3% in 2012, 2.8% in 2013) partly driving the Stable Outlook for the industry[2].

Exhibit 5
AAM Corp Credit 5-12 5
Source: Barclays Capital

According to S&P, the average statutory net investment yield declined to about 5.20% in 2010 from about 5.75% in 2007, and we would expect that to be lower in 2012. Low interest rates continue to hamper life insurers’ efforts to obtain attractive yields on new investments. Some companies continue to marginally lower their asset quality by stretching for yield and, on the margin, investing in more risky/less liquid assets (i.e., commercial mortgages, private placements and high yield bonds).

Written by:

Elizabeth Henderson, CFA
Director of Corporate Credit

Disclaimer: Asset Allocation & Management Company, LLC (AAM) is an investment adviser registered with the Securities and Exchange Commission, specializing in fixed-income asset management services for insurance companies. This information was developed using publicly available information, internally developed data and outside sources believed to be reliable. While all reasonable care has been taken to ensure that the facts stated and the opinions given are accurate, complete and reasonable, liability is expressly disclaimed by AAM and any affiliates (collectively known as “AAM”), and their representative officers and employees. This report has been prepared for informational purposes only and does not purport to represent a complete analysis of any security, company or industry discussed. Any opinions and/or recommendations expressed are subject to change without notice and should be considered only as part of a diversified portfolio. A complete list of investment recommendations made during the past year is available upon request. Past performance is not an indication of future returns.

This information is distributed to recipients including AAM, any of which may have acted on the basis of the information, or may have an ownership interest in securities to which the information relates. It may also be distributed to clients of AAM, as well as to other recipients with whom no such client relationship exists. Providing this information does not, in and of itself, constitute a recommendation by AAM, nor does it imply that the purchase or sale of any security is suitable for the recipient. Investing in the bond market is subject to certain risks including market, interest-rate, issuer, credit, inflation, liquidity, valuation, volatility, prepayment and extension. No part of this material may be reproduced in any form, or referred to in any other publication, without express written permission.

[1] Vazza, Diane, “Bond Downgrade Potential in Emerging and Developed Markets, Including the U.S. and Europe: Stress in Europe Widens The Gap Between Potential Downgrades and Upgrades,” Standard & Poor’s Credit Trends,May 17, 2012

[2] Carroll, Matthew; “Solid Capital And Liquidity Support A Stable Outlook In The Face Of Macroeconomic Headwinds,” Standard & Poor’s U.S. Life Insurance 2012 Outlook,November 30, 2011

May 9, 2012 by

In 1827, the Baltimore and Ohio (B&O) Rail Road Company, now part of CSX Corporation, was capitalized with just $5 million. The railroad would stretch from the port of Baltimore to the Ohio River in Virginia. The B&O Rail Road moved goods from the Midwest to the East coast, putting it in competition with the transportation of goods to New York by way of the Erie Canal. The first “locomotives” were powered by a horse that walked on a treadmill which drove a series of gears and wheels. In the early 1800’s, this was considered a major advancement in technology. Today, the industry is a lot more complicated and the focus on technology and efficiency has intensified. As the world continues to grow, so will the demand for a better and more cost effective transportation system. We will explore how the North American rails have performed in recent history and will give some examples of how the industry is preparing for the future. If history is any indication of the future, we expect the railroad industry will continue to shape the development of the North American economy.


The freight railroads in North America form an integrated system with over 140,000 miles of track. Rails transport almost everything including the things that we, as consumers, rely on daily including food products that end up on our kitchen tables, coal used to generate electricity, and lumber used to build our homes. The rail system has become one of the most reliable, safest, and productive in the world. As the economy grows and goods in the U.S. become more global, the demand for cost efficient transport will increase. According to the Federal Highway Commission, U.S. freight shipments will increase from 16.9 billion tons in 2010 to 27.1 billion tons in 2040. In order to compete with other modes of transportation, including pipelines and trucks, rails will need to spend a tremendous amount of money on new and existing infrastructure. Over time, these investments have led to improved service levels which is a key ingredient for more favorable pricing.

The rails spend between 17%-20% of their revenues on capital expenditures, which is higher than most other industries. For the six largest rails in North America, this totals to about $14 billion per year. Similar to most other industries, it’s necessary for the rails to always strive to improve their competitive position and look forward to capitalize on budding opportunities. Given the industry’s financial results and other important measures of productivity/efficiency, we believe the large amount of money the industry has invested has been well spent. These business improvements can be accomplished in a number of different ways. We will start off by reviewing some specific measures of productivity and efficiency. Then we will provide some real examples of how dollars are being spent. We believe this will help explain the progress of the industry and why we continue to believe the rail industry will perform well.

Operational Performance

The major railroads report important financial and operational data on a regular basis which makes it easy to track the progress of the industry. We will explore some of this data in the next couple of pages.

Source: Bloomberg Data

Exhibit 1 shows three measures of performance for the railroad industry. The first is average train velocity (higher velocity is better). The second is dwell time, or time a railcar resides at a terminal (lower is better). The final is the average of the daily online inventory of freight cars (lower is better). As shown in Exhibit 1, for the last 40 weeks you can see that all of these measures have been going in the right direction. Better performance typically results in lower costs and higher profitability.

Source: Bloomberg Data

The graph in Exhibit 2 illustrates the industry’s attention to improving safety and minimizing the number of accidents, which is a direct result of enhanced employee training and applied leading edge technology. The personal injury frequency index is the number of reportable injuries per 200,000 man hours and the FRA (Federal Railroad Administration) train accident rate is the number of reportable train accidents per million train miles. A continued focus on safety should result in a more fluid rail network, less personal liability, lower cost structure, and the ability to maintain/enhance a high quality base of employees.

Source: Bloomberg Data

Fuel is a large portion of a railroad’s total costs. The ratio of fuel costs to revenue is about 10%. Over the last five years, the amount of revenue ton miles (RTM) per gallon of fuel consumed has trended up (shown Exhibit 3). One of the ways rails have been able to manage this cost is by investing in new locomotives which are much more energy efficient. In addition, one of the most important financial measures to focus on for the rail industry is the operating ratio (Exhibit 3). That ratio is calculated by taking operating expenses (includes labor, materials, fuel, and equipment) divided by revenues. We want to see this ratio getting smaller, which tells us that revenues are growing more quickly than the expenses.

Advancements in Technology

Now it’s time to give some examples of how the rails have been able to get these impressive results. One would not typically expect an age-old industry like the railroad industry to develop and implement the advanced technology that they use on a day-to-day basis.

One of those technologies is an acoustic detector system. Sensors placed on a railway help detect distinct sounds which might be the result of excess wear and tear on a specific piece of equipment. If that piece of equipment can be taken off-line and repaired before it creates a problem, like a derailment, a lot of time and money can be saved. Union Pacific uses special predictive software which analyzes data from acoustic and visual sensors. This kind of technology gives Union Pacific days or weeks notice before something is expected to go wrong. Major derailments can cost $20 – $40 million.

Another important technology uses ground penetrating radar (GPR) to look below the railway track substructure (rocks). Feedback from the radar and sensors is used to check for conditions which might compromise track stability, including excessive water and deteriorating terrain.

Canadian National Railway recently announced that the company will buy 200 super-insulated EcoTherm containers. These containers are specially insulated and eliminate the need for diesel engine powered heaters, which keep temperature sensitive products at a normal temperature for up to ten days. Goods shipped in one of these containers consume 8-11% less fuel than the traditional choice.

There have also been major developments in the area of locomotives. One technology uses special locomotives called distributed power units. These units operate in the middle and/or at the end of a line. This creates less force on the train which results in less wear and tear and higher fuel efficiency. Another new technology, GenSet locomotives, replace older traditional yard locomotives. GenSet uses several smaller engines as opposed to one large engine. This locomotive only uses the required amount of engines for specific tasks, resulting in better fuel efficiency. In the yard, these GenSet’s are expected to reduce fuel consumption by 37%. Some of these locomotives use remote control technology and have no cab.

These are just a few examples of ways that new technology has improved operational efficiency. Technology to look for in the future includes aerodynamic design improvements, rail lubrication processes, laser-based rail inspection systems, and the use of special metals which better resist wear and tear.

Growth Projects

The rail industry is not only spending a lot of money to modernize and improve its existing structure but it’s also spending billions of dollars a year to grow its current network. Expansion projects and the re-working of existing rail lines are key opportunities for growth and provide operational efficiencies.

One major project is called the Chicago Region Environmental and Transportation Efficiency Program (CREATE). This is a major collaboration between the City of Chicago, the State of Illinois, Metra, Amtrak, the U.S. Department of Transportation, and the major railroads. The project is expected to be completed in 2030 and cost $3 billion. The project will involve the construction of new overpasses/underpasses, upgrades to tracks, switches, signals, and improvements to crossing safety. The main goals are to improve service, reduce congestion, promote economic development, and improve the environment. Chicago handles about one quarter of North America’s freight rail traffic. Chicago has become a major bottleneck as the infrastructure was not built for the kind of volume experienced today. In the next 30 years, freight rail traffic is expected to double.  Without this project, $1-$7 billion could be lost in economic production on an annual basis.

The Crescent Corridor project is a partnership between Norfolk Southern and 13 states. It’s a rail infrastructure project stretching from the Gulf Coast to the East Coast, which is expected to be completed by 2020 and cost around $2.5 billion. Norfolk Southern will make changes that will enable the line to add more freight. These enhancements include the building of new track, straightening curves, adding signals, and building and expanding terminals. The project is expected to create 73,000 jobs by 2030, and is expected to save 170 million gallons of fuel while taking 1.3 million trucks off the highways annually.

Union Pacific is expected to spend about $400 million on a project to build a new rail facility in Santa Teresa, New Mexico. The project is expected to be completed by 2015. When the project is complete, the facility will include 200 miles of track and 26 buildings for yard operations including intermodal and fueling capabilities. This project should enhance the movement of goods throughout the southwestern United States and position Southern New Mexico as a critical component of the “Sunset Route”, as shown in the map in Exhibit 4 .

Source: Union Pacific

Investment in new and existing infrastructure and dedication to innovative technology are some of the most important ways that the railroad industry has been able to improve productivity and enhance profitability. As the economy expands and the demand for the cost efficient transportation of goods increases, we expect the rails to continue to find ways to respond to network demands while joining the vast global transportation network.

Michael J. Ashley
Vice President, Corporate Credit


For more information, contact:

Greg Curran, CFA
Vice President, Business Development
greg.curran@aamcompany.com


1 “An Overview of America’s Freight Railroads”, Association of American Railroads (October 2011):1.
2“An Overview of America’s Freight Railroads”, Association of American Railroads (October 2011): 3.
3 Michael Hickins, “Union Pacific Using Predictive Software to Reduce Train Derailments”, Wall Street Journal, March 30, 2012. Accessed April 17, 2012, https://blogs.wsj.com/cio/2012/03/30/union-pacific-using-predictive-software-to-reduce-train-derailments/
4 Michael Hickins, “Union Pacific Using Predictive Software to Reduce Train Derailments”, Wall Street Journal, March 30, 2012. Accessed April 17, 2012, https://blogs.wsj.com/cio/2012/03/30/union-pacific-using-predictive-software-to-reduce-train-derailments/
5 “CN Buys 200 EcoTherm Containers”, Environmental Leader (October 19, 2011):1, accessed April 27, 2012, https://www.environmentalleader.com/2011/10/19/cn-buys-200-ecotherm-containers/
6 “CN Buys 200 EcoTherm Containers”, Environmental Leader (October 19, 2011):1, accessed April 27, 2012, https://www.environmentalleader.com/2011/10/19/cn-buys-200-ecotherm-containers/
7 “Innovation and Employee Education Save Fuel,” Union Pacific (March 2012): 1
8 “Chicago: America’s Rail Hub,” Chicago Region Environmental and Transportation Efficiency (CREATE) Program, accessed April 17, 2012, https://www.createprogram.org/about.htm#need
9 “Chicago: America’s Rail Hub,” Chicago Region Environmental and Transportation Efficiency (CREATE) Program, accessed April 17, 2012, https://www.createprogram.org/about.htm#need
10 “Chicago: America’s Rail Hub,” Chicago Region Environmental and Transportation Efficiency (CREATE) Program, accessed April 17, 2012, https://www.createprogram.org/benefits.htm
11 “ Railroad Investment Projects Create Jobs, Stimulate Economy,” Freight Rail Works, accessed on April 17, 2012, https://freightrailworks.org/#economy/partners
12 “Union Pacific Railroad Begins Construction of $400 Million Rail Facility in New Mexico,” Union Pacific, accessed April 25, 2012, https://www.uprr.com/newsinfo/releases/capital_investment/2011/0808_santa_teresa.shtml


Disclaimer: Asset Allocation & Management Company, LLC (AAM) is an investment adviser registered with the Securities and Exchange Commission, specializing in fixed-income asset management services for insurance companies. This information was developed using publicly available information, internally developed data and outside sources believed to be reliable. While all reasonable care has been taken to ensure that the facts stated and the opinions given are accurate, complete and reasonable, liability is expressly disclaimed by AAM and any affiliates (collectively known as “AAM”), and their representative officers and employees. This report has been prepared for informational purposes only and does not purport to represent a complete analysis of any security, company or industry discussed. Any opinions and/or recommendations expressed are subject to change without notice and should be considered only as part of a diversified portfolio. A complete list of investment recommendations made during the past year is available upon request. Past performance is not an indication of future returns.

This information is distributed to recipients including AAM, any of which may have acted on the basis of the information, or may have an ownership interest in securities to which the information relates. It may also be distributed to clients of AAM, as well as to other recipients with whom no such client relationship exists. Providing this information does not, in and of itself, constitute a recommendation by AAM, nor does it imply that the purchase or sale of any security is suitable for the recipient. Investing in the bond market is subject to certain risks including market, interest-rate, issuer, credit, inflation, liquidity, valuation, volatility, prepayment and extension. No part of this material may be reproduced in any form, or referred to in any other publication, without express written permission.

April 20, 2012 by

Is This Time Different?

After Strong Performance in the First Quarter, Corporate Bond Spreads are Widening in April Due to European and U.S. Growth Concerns

The Corporate bond market posted 34 basis points (bps) of positive excess returns vs. U.S. Treasuries in March, generated mainly by the Finance sector as well as short-to-intermediate Industrial and Utility credits. At month-end, Spain released its budget and shortly thereafter, the disappointing U.S. jobs data was released. Hence, spreads have widened this month, Finance and European credits bearing the brunt of the widening. As evidenced by the reaction from both the equity and bond markets, Europe remains on investors’ minds as well as the vigor of U.S. growth.

Exhibit 1
AAM Corp Credit 4-12 1
Source: AAM, Barclays Capital, Bloomberg as of 4/16/12

European Headlines Will Persist

We detailed the challenges Spain faces fiscally and politically in our recent white paper (“The Pain in Spain Falls Mainly on the…”). We believe that Spain will likely need to request formal support from the Troika sometime during 2012 or 2013 (and potentially much sooner). The increase in TARGET2 balances (bank borrowings from the Eurosystem) for Italy as well as Spain is also concerning.   This, in addition to the debt issuance needs of Portugal in late summer or early fall 2012, Italy’s recent backsliding on its budget deficit, the French election, among others, are likely to keep spreads volatile in the near term. The consideration being given to direct capitalization of Spanish banks by the European Fiscal Stability Fund (EFSF) is encouraging. We have long believed that Europe needs its own form of TARP (Troubled Asset Relief Program).

 The Micro Picture is More Favorable Albeit Tepid

Earnings estimates for the first quarter of 2012 were revised down over the second half of 2011, and most companies are poised to beat in our opinion. Our credit and industry level cues point to a domestic economy that is on track for low single digit growth in 2012. The level and trend of commodity based railroad carloads is one example of improving economic activity (Exhibit 2) where carloads continue to trend above 2011 levels. Additionally, initial bank results have been modestly positive.  Headline numbers were highlighted by strong capital markets results, but a deeper look shows modest loan growth to both companies and individuals, including strong mortgage lending results.  Asset quality continued its improving trend and organic capital generation was also a positive highlight despite increased dividends and share buy-backs by most banks under coverage.

Exhibit 2

AAM Corp Credit 4-12 2 
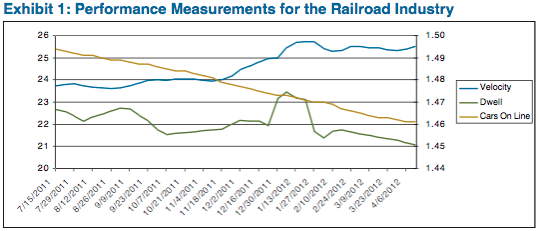
Source: AAM, Association of American Railroads

With profits recovering and cash coffers full, companies are increasing dividends and share repurchases. While this is not welcome from a bondholder perspective, it possibly does point to a turn in the cycle and increasing management confidence in the political and economic outlook domestically and abroad. We would have more confidence if we saw companies investing in their businesses by hiring, spending more on research and development (R&D) and/or making other investments. (Exhibit 3)

Exhibit 3
AAM Corp Credit 4-12 3
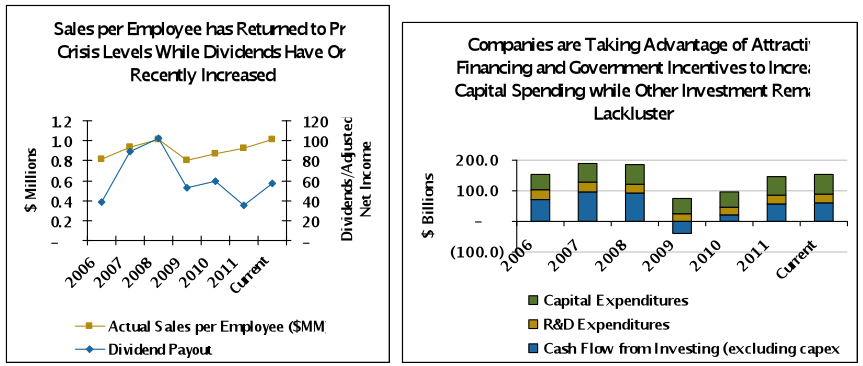
Source: AAM, Bloomberg (S&P 500 Index member data used)

Invest Cautiously to Maximize Risk Adjusted Income

Our base case is that corporate market spread volatility will be high but not exceed the level in 2011 (Exhibit 4), since investors and companies have had time to contemplate and reposition, spreads have widened especially for sectors directly exposed to the crisis, company balance sheets remain strong, liquidity has improved with companies accessing the markets (high yield, investment grade, domestic and European) this quarter, and the U.S. 10-year Treasury yield is 141 basis points lower than one year ago or 1.95%.

Exhibit 4
AAM Corp Credit 4-12 4
Source: AAM, Barclays Capital – Change in Standard Deviation of OAS YTD 4/16/12 vs. 2011

That said, we recognize all corporate bond spreads will widen dramatically if tail risk manifests itself. Regardless, portfolios must be managed to compensate investors for expected volatility. We entered the year positioned with bonds that we believed would be less volatile due to favorable structures, technicals, or fundamentals. As shown in Exhibit 5, technicals alone are significant drivers of volatility in this more illiquid market environment, which we believe is not changing in the near-to-intermediate term.

Exhibit 5: Liquidity Bucketed Non-Market HG Spread Moves
AAM Corp Credit 4-12 5
Source: Citi Investment Research and Analysis (CIRA, Bloomberg)

Written by:
Elizabeth Henderson, CFA
Director of Corporate Credit

Disclaimer: Asset Allocation & Management Company, LLC (AAM) is an investment adviser registered with the Securities and Exchange Commission, specializing in fixed-income asset management services for insurance companies. This information was developed using publicly available information, internally developed data and outside sources believed to be reliable. While all reasonable care has been taken to ensure that the facts stated and the opinions given are accurate, complete and reasonable, liability is expressly disclaimed by AAM and any affiliates (collectively known as “AAM”), and their representative officers and employees. This report has been prepared for informational purposes only and does not purport to represent a complete analysis of any security, company or industry discussed. Any opinions and/or recommendations expressed are subject to change without notice and should be considered only as part of a diversified portfolio. A complete list of investment recommendations made during the past year is available upon request. Past performance is not an indication of future returns.

This information is distributed to recipients including AAM, any of which may have acted on the basis of the information, or may have an ownership interest in securities to which the information relates. It may also be distributed to clients of AAM, as well as to other recipients with whom no such client relationship exists. Providing this information does not, in and of itself, constitute a recommendation by AAM, nor does it imply that the purchase or sale of any security is suitable for the recipient. Investing in the bond market is subject to certain risks including market, interest-rate, issuer, credit, inflation, liquidity, valuation, volatility, prepayment and extension. No part of this material may be reproduced in any form, or referred to in any other publication, without express written permission.

April 18, 2012 by

Spain has come under pressure due to investor concerns about its worsening fiscal profile and struggling banking system. While the country is pursuing a program of fiscal consolidation, it will likely struggle to reignite economic growth and is expected fall into recession during 2012. As a result of twin funding pressures facing both the sovereign and the banking system, we believe Spain will need to turn to the European Union and the European Central Bank for support.


Spain is in the headlines again due to rising capital markets concerns about the country’s fiscal sustainability and the soundness of its banking system.  Spanish sovereign ten year bond yields, which had fallen as low 4.85% in February following the completion of emergency liquidity operations by the European Central Bank, have since risen above 6.00% (Exhibit 1).  This raises the risk that Spain’s economic problems will be compounded by unsustainably high funding costs, or even potentially a sovereign investors’ buyers strike.

Source: Bloomberg
Source: Bloomberg

In this “white paper,” we contemplate Spain’s fiscal profile, its banking system and the support mechanisms available to address a funding shortfall in the event Spain loses access to the capital markets.  We will conclude with a credit view on the impact on corporate bond markets should Spain be forced to turn to the European Union (EU), the European Central Bank (ECB), or the International Monetary Fund (IMF) for further support.

Sizing the Problem

Risking a much overused cliché, Spain really is “too big to fail” within the European context.  With a GDP of €1.07 trillion, Spain is the Eurozone’s fourth largest economy representing 11% of consolidated €9.4 trillion GDP (Greece, by contrast, accounted for 3%).

The inherent imbalances in the Euro system (common monetary policy/divergent fiscal policies) resulted in a real estate bubble in Spain over the past decade and a material increase in leverage at the government level, in the private sector and by the households.  As a result, Spain finds itself with unsustainable (and growing) government debt levels, a banking sector that is struggling to de-lever in the face of a burst real estate bubble and an economy that is expected to slip again into recession in 2012.

Spain’s Fiscal Profile

The economic recession that followed the global financial crisis in 2008 accelerated the fiscal imbalances within Spain.  A persistent structural budget deficit was aggravated by the recession (Exhibit 2), resulting in a rapid growth of Spain’s debt/GDP measure (Exhibit 3).

Source: Eurostat (Official Statistical Repository of the European Commission)


Source: Eurostat (Official Statistical Repository of the European Commission)

While successive Spanish governments have committed to reducing the structural budget deficit through austerity measures, the slowing economy has frustrated these efforts.  As a result, the  budget deficit which stood at -9.3% in fiscal year 2010 missed its fiscal year 2011 target of  -6.0% by a material margin, coming in at -8.5%.  The newly elected government reignited fears about fiscal sustainability in February 2012 when it announced Spain would miss its fiscal year 2012 deficit target of -4.4%.  And investors are generally skeptical about the revised target of -5.3%, which appears politically expedient, but economically difficult to achieve (Exhibit 4).

Source: Banco de Espana

Impediments to Growth

While Spain’s current debt/GDP level actually compares favorably to most of its Eurozone peers, the country’s lack of economic growth, as well as the potential need to support its banking system (more on this below) are the primary drivers of the capital market concerns that threaten its ability to refinance its substantial external debts.  While a resumption of economic growth will be key to ultimately reversing the deterioration in Spain’s fiscal profile, there are a number of factors impeding such growth.

The biggest challenge is Spain’s inflexible labor system, which makes it very difficult for employers to adjust their labor force through lay-offs.  The result has been persistently high unemployment, which spiked as a result of the 2009/2010 recession, but made companies reluctant to hire new employees as the country emerged from recession in 2011 (Exhibit 6).  Unemployment was also aggravated by the high proportion of the population involved in the Spanish construction industry, which has collapsed following the bursting of the country’s real estate bubble.  The imposition of successive austerity programs in an effort to close the budget deficit has further hurt employment in the public sector.  As a result, Spain has the highest unemployment rate in the Eurozone at 23%, and unemployment among those under 30 is nearly 45% (Exhibit 5).

Source: Eurostat (Official Statistical Repository of the European Commission)


Source: Eurostat (Official Statistical Repository of the European Commission)

The Spanish Banking System

Beyond the impact on employment levels, the collapse of the real estate bubble has left the Spanish banks with an outsized real estate loan book that is suffering from deteriorating asset quality due to the factors discussed above (recession/high unemployment).  Just to size the problem, the Spanish banking system had a total loan book of €1.8 trillion (equivalent to 180%  of GDP) at year end 2012 and non-performing loans (NPL) were €136 billion (7.6% of loans).  Against this, the Spanish banking system has loan loss provisions (LLP) of €108 billion and tangible common equity of €203 billion.

If the economy slips back into recession in 2012, NPLs across all loan classes are likely to grow, but real estate is of particular concern.  While the Spanish real estate bubble burst in 2008, real estate prices have fallen far less (down approximately 20-25%) than in other countries with collapsed real estate bubbles (i.e., United States, Ireland).  Residential mortgage loans stood at €657 billion (2.8% NPL) while corporate real estate (commercial real estate/real estate development companies) stood at €397 billion (20.1% NPL).  Estimates vary, but under the assumption that asset quality continues to worsen in the face of renewed recession and continued decrease in real estate prices, additional provisions required by the banks could range from €100 to €200 billion.  With a pre-provision profit generating capacity estimated in the €40-45 billion range, even an increase of provision expense of €100 billion would begin to erode the capital of the banking system.  As shown in Exhibit 7, Spanish banks already have a high proportion of NPL to LLP+ Tangible Common Equity (informally known as the Texas Ratio – as it approaches 100% the likelihood of bank failure also approaches 100%).

Source: Banco de Espana

Regulators have pushed for a consolidation within the banking sector, with stronger banks absorbing weaker banks. But, as we demonstrated with the consolidated bank system ratios above (and the experience of Japan during the ‘90s), such a strategy can only be taken so far before it cripples the entire system.  Spanish regulators have attempted to pre-empt this issue by changing bank provisioning standards to require a provision build of approximately €100 billion within the banking system.  However, given the limited capacity of the Spanish banks to generate capital organically or through private market capital increases, it is likely that a large portion of this increase will have to come from public sources.  To this end, the Spanish government has established the Fund for Orderly Bank Restructuring (FROB) which can provide public capital injections for struggling banks and has injected €14 billion in public capital to date.

However, given the persistent budget deficit and growing debt/GDP ratio, Spain can ill afford to inject a further €50-150 billion in capital.  With outstanding sovereign debt of €735 billion and a debt/GDP ratio that officially stood at 68% at year end 2011, every additional €50 billion of capital injected into the bank sector raises the ratio by five percentage points (and this is before contemplating the budget deficit and GDP contraction).

Spain’s Dual Liquidity Crunches (Squeezes/Crises?)

As a result of its fiscal and banking challenges, Spain faces dual liquidity squeezes on its access to sovereign funding in the bond market and bank funding in the deposit and wholesale markets.

Within the sovereign debt markets, this is reflected in Spain’s debt costs, with yields on existing debt rising above a 6% yield, reflecting sovereign investors’ unease over Spain’s fiscal sustainability.  Yields substantially above the country’s own GDP growth rate raise the question of long-term sustainability of the country’s debt load and aggravates the growing debt/GDP ratio.  At the extreme, the rising yields reflect growing unwillingness of sovereign debt investors to support Spanish debt.  With issuance needs of approximately €185 billion for 2012 (including €100 billion of short-term bills that must be refinanced), the potential that investors decline to purchase Spanish sovereign issuance raises the real prospect of a sovereign default.

The Spanish banking system has already effectively lost access to the wholesale funding markets and investors have pulled away from Spanish bank bonds on fears about the system’s solvency in the face of rising credit costs.  At the same time, retail and institutional deposits have been migrating from the Spanish banking system and into banking systems viewed as more stable (Germany/Netherlands/France).  A funding crisis has been averted only through reliance on the European Central Bank’s (ECB) emergency lending programs.  However, ECB liquidity is only a temporary solution, and its requirement for collateral against funding advanced is rapidly encumbering Spanish bank balance sheets (and effectively subordinating unsecured bond holders, thus further reducing the likelihood that they resume funding the banks).  Furthermore, while ECB liquidity stems concerns about an immediate bank failure,  it does nothing to address market concerns about the solvency of the Spanish banking system.

Crisis Fighting Options for Spain

While Spain would ideally prefer to address its sovereign funding and bank funding/solvency issues internally, it already appears that this option is not available.  At a minimum, the need for the banking system to access ECB liquidity is a tacit admission that Spain is unable to provide support.  There appear to be two options that Spain and the EU can utilize to tackle the current crisis:

  1. European Central Bank Liquidity – As noted above, the Spanish banking system is already accessing ECB emergency liquidity through the Longer-term Refinancing Operation (LTRO), through which the ECB provides unlimited three year loans to banks in return for collateral (paradoxically, the LTRO liquidity provided to the banks has largely been reinvested in Spanish sovereign debt, temporarily lowering Spanish sovereign yields, although this effect is temporary).  Additionally, the ECB has provided indirect liquidity support to struggling Eurozone sovereigns through its Security Market Purchase (SMP) program which purchases sovereign debt in the secondary market with the goal of reducing yields.  While the ECB has theoretically unlimited capacity to provide liquidity at both the banking and sovereign levels, practically these measures amount to a stopgap.  Regarding bank funding, we have already noted that the LTRO funding for banks is limited by the stock of eligible collateral, and cannot provide capital infusions to address solvency concerns.  And on the sovereign funding level, SMP has been highly controversial in the EU, with some nations (especially Germany) opposing it as a backdoor quantitative easing that could ultimately stoke inflation.  Because the SMP is not a formal support program that imposes fiscal conditions on borrowers, but rather an open market program, it is a temporary liquidity stopgap, rather than a formal tool for addressing fiscal imbalances.  To this end, the ECB Board has explicitly warned that the SMP should not be viewed as unlimited, and that addressing the fiscal challenges of the Eurozone must be undertaken at the governmental/fiscal level rather than being tackled by the monetary authority (ECB).
  1. EU Crisis Programs – Since the advent of the Eurozone crisis in mid-2010, the EU has established two separate funds to aid struggling sovereigns as they undertake fiscal consolidation.  The European Fiscal Stability Fund (EFSF) was intended as a temporary €440 billion fund.  The European Stability Mechanism (ESM) was established by treaty in 2011 as a €500 billion permanent replacement to the EFSF.  In an attempt to add credibility in the face of multiple sovereign crises during 2011, the EU agreed to accelerate the advent of the ESM to July 2012 (although the ESM has yet to be ratified by all EU members).  To date, three countries (Greece, Ireland and Portugal) have entered a fiscal consolidation plan with support from the EFSF/ESM programs (with varying success).  The use of EFSF/ESM programs to aid Spain through its sovereign and banking crises has several pros including: (a) flexibility to fund a defined program of fiscal consolidation, and (b) the ability to provide direct recapitalization of the Spanish banking sector, thus taking pressure off the sovereign.  However, there are also several hurdles to such an approach.  First, it would require an explicit Spanish request for assistance, and any program Spain entered into would require it to surrender a degree of sovereignty to the EU administrators of the program (and the new government has already expressed reservations about encroachment on Spanish sovereignty).  More practically, the EFSF/ESM programs are “committed” but unfunded, and would require substantial issuance of bonds jointly and severally guaranteed by all EU members.  This raises questions both of the market’s capacity for absorbing such funding needs (above and beyond what has already been committed to Greece/Ireland/Portugal).  Furthermore, the creditworthiness of the EFSF/ESM relies entirely on the credit of the underlying members, of which Spain is one of the larger members, raising questions about the creditworthiness of the EU as a whole.  Ultimately, the credibility of the EFSF/ESM rests in large part on the willingness and capacity of the EU’s strongest member, Germany, to support weaker EU members.  This appears ultimately to be political rather than financial question, and subject to domestic political and economic considerations.  We believe Germany will ultimately decide that it is in its own best interest to support its fellow EU members, but this outcome is by no means a certainty.

Conclusion: Expectations and Credit Implications

We believe that Spain likely will need to request formal support from the EU/ECB/IMF sometime during 2012 or 2013 (and potentially much sooner).  The likely form of support is via a negotiated program utilizing the EFSF/ESM (rather than continued ad hoc support through the ECB).  The most likely driver of the request in the near-term would be a continued rise in sovereign funding costs beyond the point of sustainability.  However, even in the event that funding pressures ease, Spain is likely to face increased pressure to enter a formal program, either from the ECB which is unlikely to provide permanent open ended funding for its banking system, or from the EU if it slips behind schedule on its fiscal consolidation program (which we believe is likely).

The resolution of Spain’s fiscal and banking challenges has credit implications for both Spain and the broader EU.  Failure to address Spain’s economy (and all of the struggling Euro area’s economies) in an orderly manner would ultimately threaten the existence of single currency, and could result in serious disruption to the European economy and financial system.  We believe that the most likely outcome is a collective agreement by EU members to preserve the currency while working through fiscal consolidation of the weaker economies.  Ultimately, this likely results in a greater degree of fiscal integration within the EU (a necessity if the single currency is to survive) and we do NOT rule out the possibility of further sovereign restructurings (in the mold of Greece) although that is not our default expectation with Spain (given their relatively stronger fiscal profile).  However, the challenge of achieving political consensus among the seventeen Euro currency members and the twenty seven European Union members has already made itself evident in the manner in which the EU has stumbled from crisis to crisis.  We expect this approach to continue, and as such, believe that the investment grade corporate bond markets will be subject to recurring episodes of volatility surrounding fiscal/political developments in the Eurozone.

Consequently, we remain very cautious on corporate issuers with direct exposure to the weaker EU sovereigns (Telefonica/Iberdrola) and have also reduced our exposure to all European banks (given the interconnectedness of European bank funding of EU sovereign debt issuance).  We are also cognizant of the impact of EU credit volatility on the U.S. money center bank sector, although fundamentally the U.S. banks have very manageable direct exposures to Europe.

N. Sebastian Bacchus, CFA
Vice President, Corporate Credit


For more information, contact:

Greg Curran, CFA
Vice President, Business Development
greg.curran@aamcompany.com


Disclaimer: Asset Allocation & Management Company, LLC (AAM) is an investment adviser registered with the Securities and Exchange Commission, specializing in fixed-income asset management services for insurance companies. This information was developed using publicly available information, internally developed data and outside sources believed to be reliable.  While all reasonable care has been taken to ensure that the facts stated and the opinions given are accurate, complete and reasonable, liability is expressly disclaimed by AAM and any affiliates (collectively known as “AAM”), and their representative officers and employees.  This report has been prepared for informational purposes only and does not purport to represent a complete analysis of any security, company or industry discussed. Any opinions and/or recommendations expressed are subject to change without notice and should be considered only as part of a diversified portfolio. A complete list of investment recommendations made during the past year is available upon request. Past performance is not an indication of future returns.

This information is distributed to recipients including AAM, any of which may have acted on the basis of the information, or may have an ownership interest in securities to which the information relates.  It may also be distributed to clients of AAM, as well as to other recipients with whom no such client relationship exists.  Providing this information does not, in and of itself, constitute a recommendation by AAM, nor does it imply that the purchase or sale of any security is suitable for the recipient. Investing in the bond market is subject to certain risks including market, interest-rate, issuer, credit, inflation, liquidity, valuation, volatility, prepayment and extension. No part of this material may be reproduced in any form, or referred to in any other publication, without express written permission.

  • « Go to Previous Page
  • Page 1
  • Interim pages omitted …
  • Page 8
  • Page 9
  • Page 10
  • Page 11
  • Page 12
  • Interim pages omitted …
  • Page 17
  • Go to Next Page »

Get updates in your inbox.

  • Investment Strategies
    • Investment Grade Fixed Income
    • Specialty Asset Classes
  • Our Clients
    • Client Experience
    • Sample RFP Download
  • Insights
    • Video
    • Webinar
    • News
    • Podcasts
  • About
    • Our Team
    • Contact
    • Client Login

Disclaimer: Asset Allocation & Management Company, LLC (AAM) is an investment adviser registered with the Securities and Exchange Commission, specializing in fixed-income asset management services for insurance companies. Registration does not imply a certain level of skill or training. This information was developed using publicly available information, internally developed data and outside sources believed to be reliable. While all reasonable care has been taken to ensure that the facts stated and the opinions given are accurate, complete and reasonable, liability is expressly disclaimed by AAM and any affiliates (collectively known as “AAM”), and their representative officers and employees. This report has been prepared for informational purposes only and does not purport to represent a complete analysis of any security, company or industry discussed. Any opinions and/or recommendations expressed are subject to change without notice and should be considered only as part of a diversified portfolio. A complete list of investment recommendations made during the past year is available upon request. Past performance is not an indication of future returns. This information is distributed to recipients including AAM, any of which may have acted on the basis of the information, or may have an ownership interest in securities to which the information relates. It may also be distributed to clients of AAM, as well as to other recipients with whom no such client relationship exists. Providing this information does not, in and of itself, constitute a recommendation by AAM, nor does it imply that the purchase or sale of any security is suitable for the recipient. Investing in the bond market is subject to certain risks including market, interest-rate, issuer, credit, inflation, liquidity, valuation, volatility, prepayment and extension. No part of this material may be reproduced in any form, or referred to in any other publication, without express written permission. *All figures shown are approximate and subject to change from quarter to quarter. **The accolades and awards highlighted herein are not statements of any advisory client and do not describe any experience with or endorsement of AAM as an investment adviser by any such client.

Copyright © 2024 AAM | Privacy and Disclosures

  • LinkedIn
  • YouTube