Strong Start to the Year
The Positive Role of the LTRO
Risk assets have rallied in 2012, fueled by European Central Bank (ECB) stimulus via the Longer Term Refinancing Operation (LTRO). The liquidity provided by the LTRO gives banks and sovereigns more time to deleverage their balance sheets, avoiding a liquidity crunch and softening the impact to the economies of such deleveraging. Importantly, the increased liquidity has reduced the risk of a bank failure in the near term, decreasing the likelihood of a sovereign bailout of such banks, thereby decreasing sovereign risk. In effect, the LTRO has reversed the negative feedback loop in the second half of 2011.
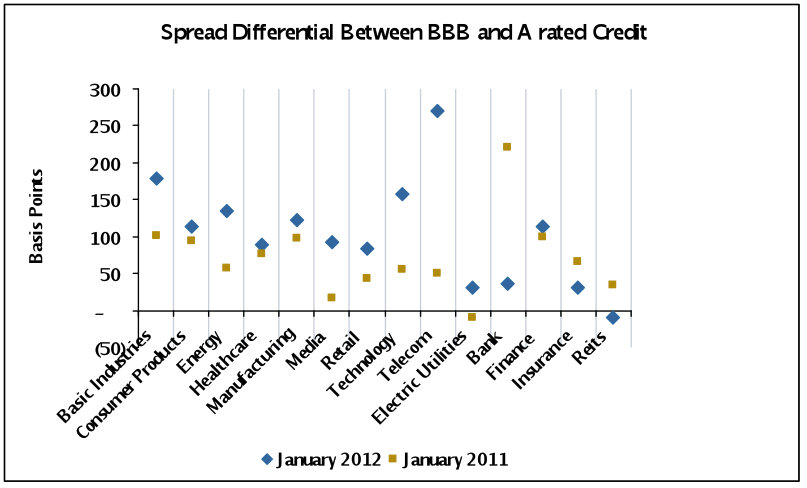
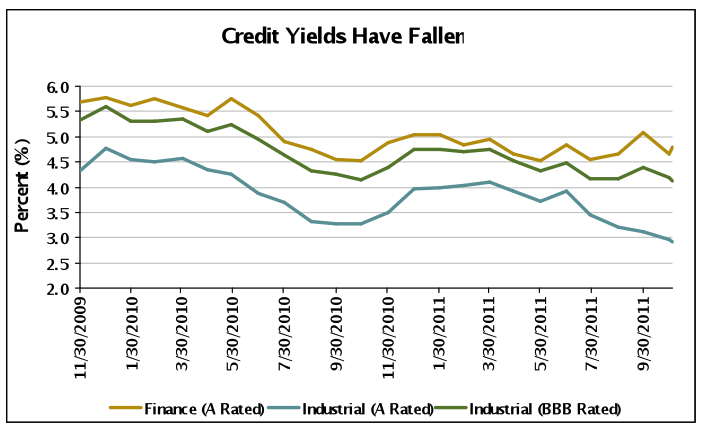
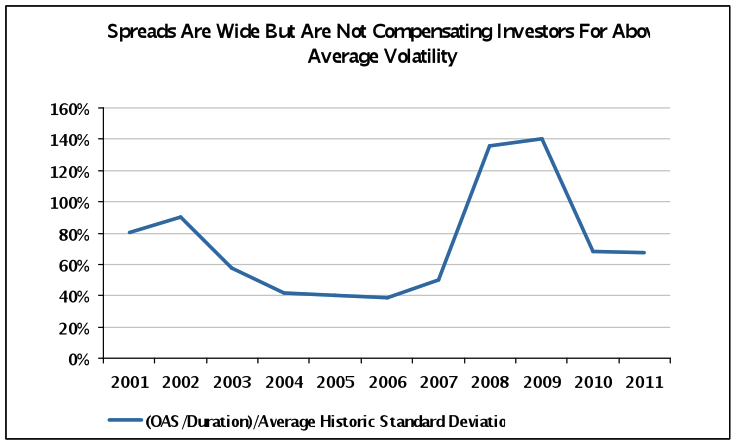
Certainly, tail risk that existed prior to the LTRO has fallen. And, as the costs of a Greek bankruptcy and departure from the European Union are increasingly externalized to the European core, the likelihood that the core allows Greece to default decreases. Accordingly, the risk premium in Investment Grade credit associated with Europe has fallen (we wrote in our 2012 Outlook[1] that it was approximately 60 basis points (bps) or one third of the market Option Adjusted Spread at that time). Corporate spreads year-to-date as of February 29, 2012 have tightened 53 bps, with Finance outperforming (92 bps tighter) Utilities (26 bps tighter) and Industrials (37 bps tighter). Spreads have tightened to the mean over the last year (Exhibit 1).
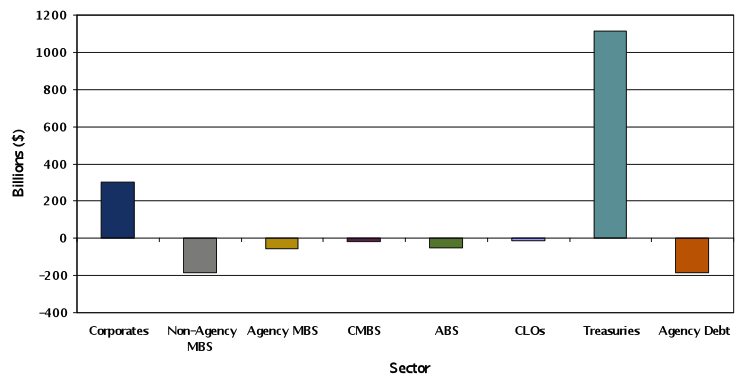
Exhibit 1
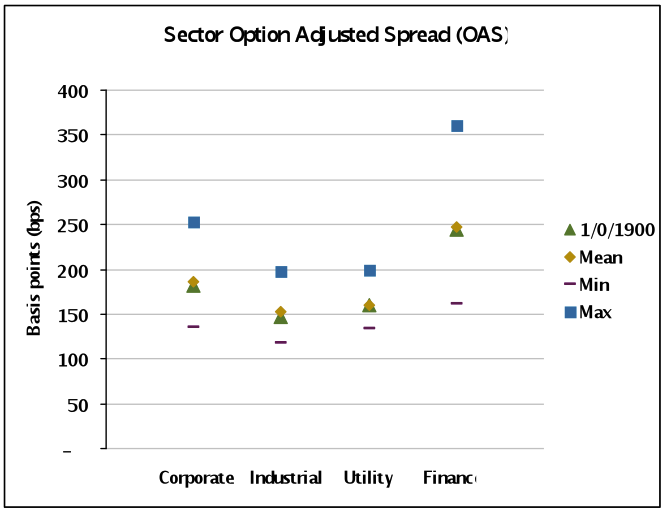
Source: Barclay’s Capital, AAM
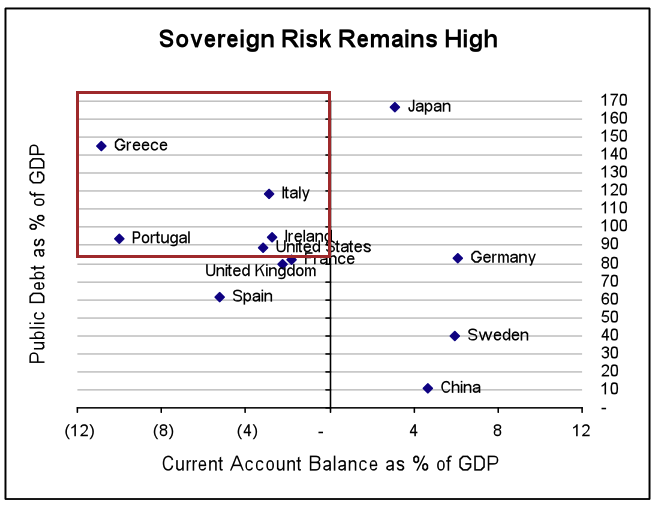
Sovereign Risk Has Not Disappeared
Liquidity aside, risk remains in Europe over the next 12 to 18 months mainly due to the likelihood of weaker than expected economic growth, resulting in missed deficit targets, etc, possibly creating another funding crisis for the sovereigns of mainly Spain and Italy, igniting systemic fears. Spain recently announced that it will miss its deficit target and the market took it in stride. We are aware that the market’s expectation is for growth in the Eurozone to improve after a weak first quarter in 2012; therefore, we believe that the second half 2012 will be the appropriate time to test the market’s response. The unknown is how growth will be affected by the austerity measures and resulting political action. Eurozone leaders have strongly indicated that they will continue to provide financial support as long as a funding country remains committed.
Secondly, Ireland and Portugal debt restructuring fears are likely to re-emerge. Portugal will need to access the debt markets in the second half 2012 to pre-fund its September 23, 2013 maturity (IMF (International Monetary Fund) involvement requires funding assurance twelve months ahead). Eurozone leaders have been adamant that PSI (Private Sector Involvement) is unique to Greece and should not be expected for other countries, and willing to be patient as long as Portugal remains committed. This is something the market will likely test especially if Portugal’s progress is underwhelming. That said, we understand the incentives Eurozone leaders have to keep this contained, mainly the fear that would spread again to Spain and Italy.
In summary, we acknowledge the reduced sovereign and thus systemic risk in the near term, but remain concerned about this risk in the intermediate term. Economic growth and greater fiscal integration is critical for this risk to be contained. While economic growth in emerging markets and the U.S. may prove beneficial for European exports and ultimately growth, the Middle East tensions and the rising price of oil is a concern for Europe’s progress as well as the rest of the world.
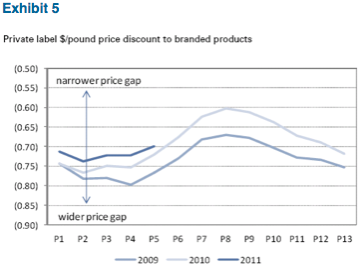
Higher Risk Corporate Securities Have Outperformed
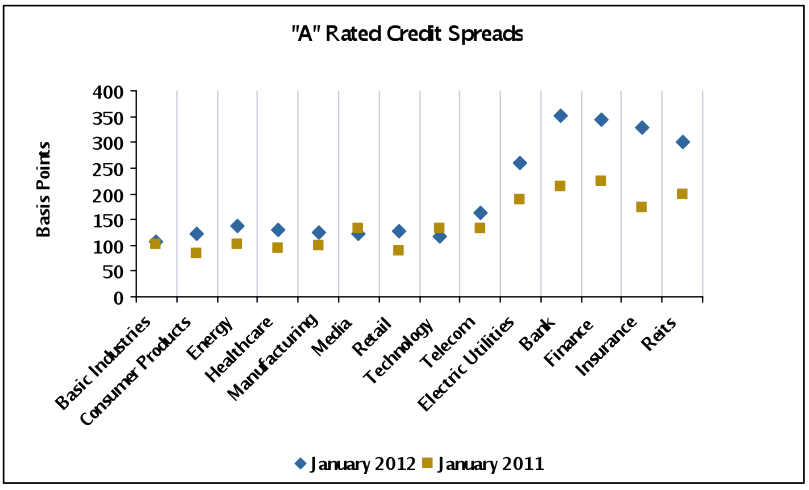
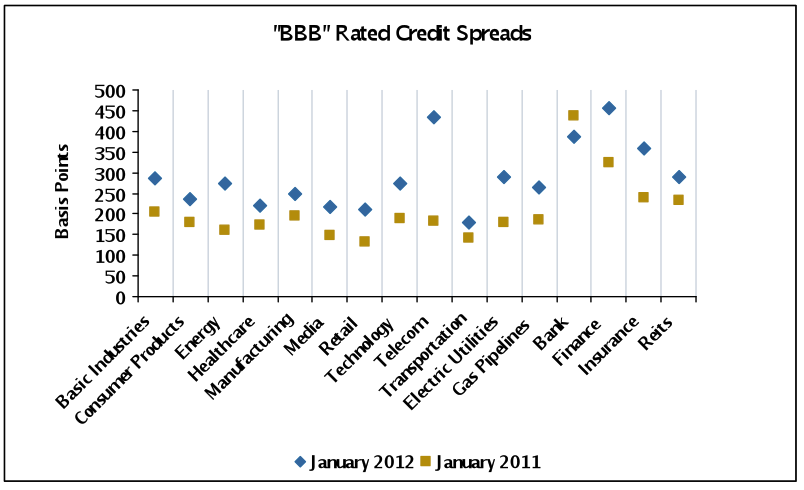
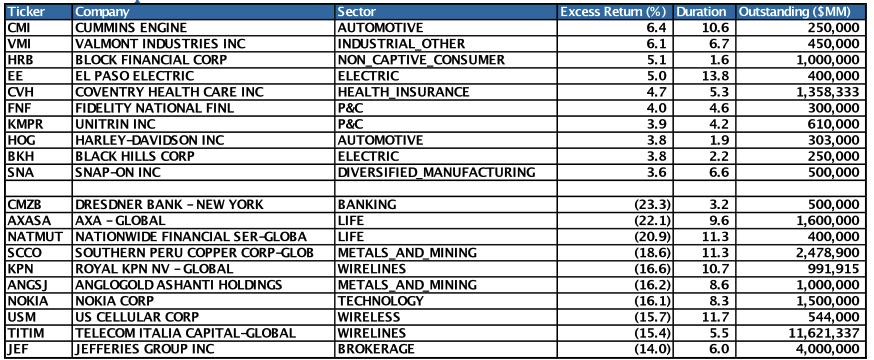
In the Investment Grade Corporate market, we have seen the risk premium for European credits fall this year, as investors take advantage of the near term respite from sovereign related volatility. Similarly, lower rated credits have outperformed as well as Financials (Exhibits 2-5). Investors are not looking to increase yield by moving out the curve, fearful of a rise in Treasuries. With spreads of intermediate maturities falling more than long, credit curves remain fairly steep. Broker/dealer inventories remain very low; therefore, it is not surprising that new issue Corporate deals have been in high demand. New issue concessions have fallen to levels witnessed in bullish market environments, and deals are greatly oversubscribed.
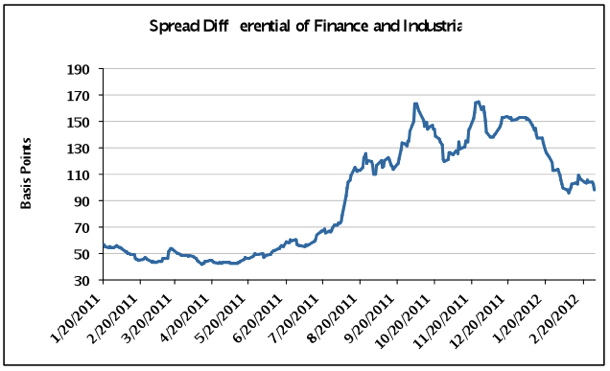
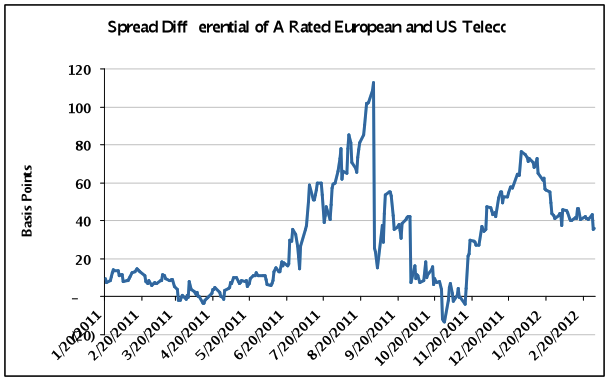
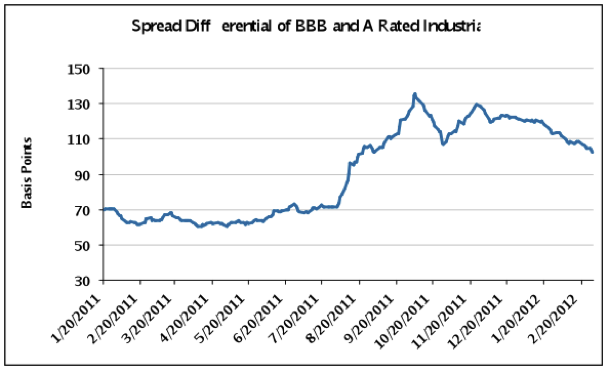
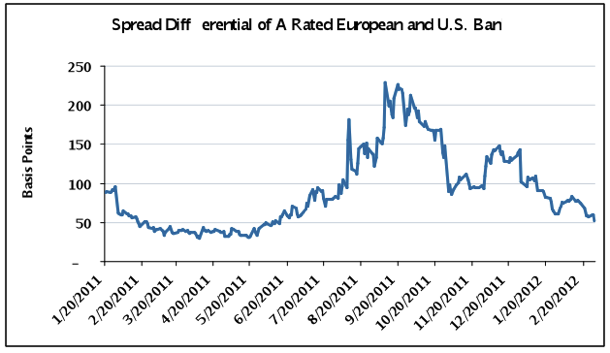
Source: Credit Suisse LUCI Index, Barclays Capital, AAM
AAM’s View of the Market Remains Cautiously Optimistic
Over two thirds of companies have reported financial results, and while the fourth quarter was lackluster as expected, management forecasts (albeit lighter than usual on details) were constructive and comments about first quarter have been quite positive. For instance, capital expenditures forecasted for 2012 have increased 5% over the last two months for virtually all industries, especially those that are most meaningful (Energy, Metals & Mining, Telecom).
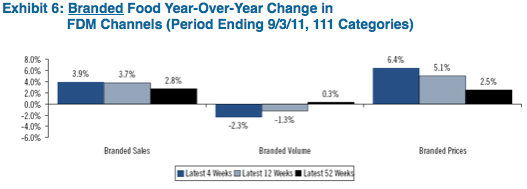
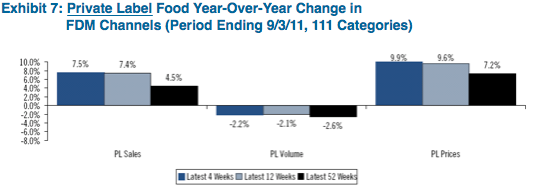
We remain prepared for another year of heightened market volatility given the risks and the very low rates of economic growth forecasted for countries around the globe. The technical environment is modestly negative right now after a strong rally and the expectation for a heavy new issue month in March. Corporate securities have performed well so far (Exhibits 6 and 7), reaching the tighter end of our “fair value” range. In particular, we have seen outperformance from Insurance, Energy – Refining and Oil Services, Pipelines, Media and Finance as well as subordinated bank securities.
Our focus year-to-date has remained one of defensive optimism. We are avoiding Europe, low quality investment grade companies, and companies that will struggle to grow in the near term. As well, we are neutral on banks, investing in those that are higher quality with a domestic focus, while avoiding brokers and finance companies (excluding GE). We are very mindful of expected volatility, investing in securities we believe will produce the highest risk adjusted returns.
Exhibit 6
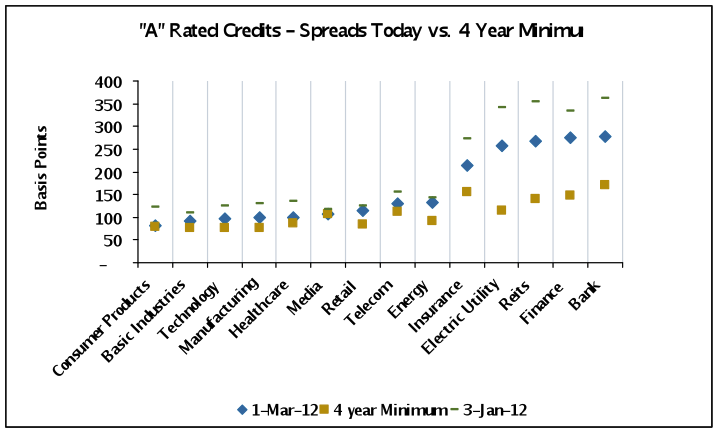
Exhibit 7
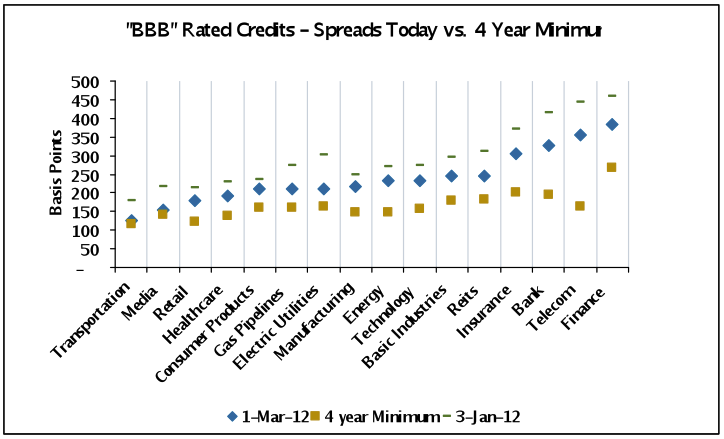
Source: Credit Suisse LUCI Index, AAM (Note: the Electric Utility and BBB Telecom sectors are heavily
Weighted towards European issuers in the LUCI index); Data as of March 1, 2012.
Written by:
Elizabeth Henderson, CFA
Director of Corporate Credit
Disclaimer: Asset Allocation & Management Company, LLC (AAM) is an investment adviser registered with the Securities and Exchange Commission, specializing in fixed-income asset management services for insurance companies. This information was developed using publicly available information, internally developed data and outside sources believed to be reliable. While all reasonable care has been taken to ensure that the facts stated and the opinions given are accurate, complete and reasonable, liability is expressly disclaimed by AAM and any affiliates (collectively known as “AAM”), and their representative officers and employees. This report has been prepared for informational purposes only and does not purport to represent a complete analysis of any security, company or industry discussed. Any opinions and/or recommendations expressed are subject to change without notice and should be considered only as part of a diversified portfolio. A complete list of investment recommendations made during the past year is available upon request. Past performance is not an indication of future returns.
This information is distributed to recipients including AAM, any of which may have acted on the basis of the information, or may have an ownership interest in securities to which the information relates. It may also be distributed to clients of AAM, as well as to other recipients with whom no such client relationship exists. Providing this information does not, in and of itself, constitute a recommendation by AAM, nor does it imply that the purchase or sale of any security is suitable for the recipient. Investing in the bond market is subject to certain risks including market, interest-rate, issuer, credit, inflation, liquidity, valuation, volatility, prepayment and extension. No part of this material may be reproduced in any form, or referred to in any other publication, without express written permission.
[1] AAM Corporate Credit View – January 2012
 Source: Barclays Capital U.S. Corporate Index, AAM