In this thought leadership piece, we analyze the home improvement sector of the retail industry. The two largest competitors in this segment, Home Depot and Lowe’s, have been battling it out for years. Given the size of the U.S. home improvement market (estimated as $570 billion1), they are also two of the largest retailers in the world. Also, we will review the current and expected prospects for the industry, compare and contrast the two companies, and finally, disclose which company we believe is the better opportunity for corporate bond investors.
Industry Overview
One thing is for sure, home improvement retailers have been impacted by the downturn in the housing market. In addition to a bad real estate market, credit is tight, consumer confidence is historically low, and unemployment is high. Management at both Home Depot and Lowe’s agree that their companies’ growth has decoupled from the housing market and is now more reliant on GDP growth. These retailers’ allocation of sales to more expensive, discretionary type purchases (major remodel projects) has come down to about 30% of the total. The Cost vs. Value survey conducted by Remodeling Magazine, which estimates the return of remodeling projects, continues to show a downward trend (Exhibit 1). One good sign is that remodeling costs are beginning to come down, as contractors become more competitive and consumers look to scale down on quality and/or options. Unfortunately, home values continue to fall, making it less attractive and/or financially feasible for home owners to remodel. This should keep the ratio low for the foreseeable future since we believe that it will be years before we experience a sustained recovery in home prices.
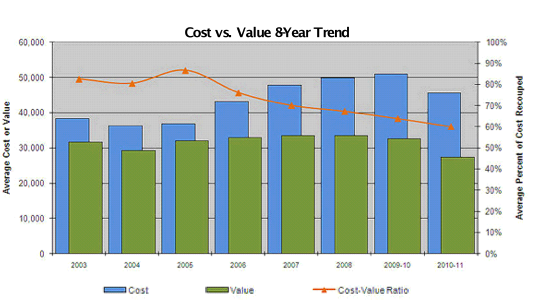
Smaller scale replacement projects, like putting in a new garage door or adding a wood deck, are expected to be the primary source of growth until we see the housing market return in the U.S.. After all, for most Americans, our house is our largest asset. It needs to be kept up and it’s fairly easy, these days, for the typical homeowner to take on a small to intermediate sized project. In addition, consumers will continue to spend on maintenance items including light bulbs and garbage bags.
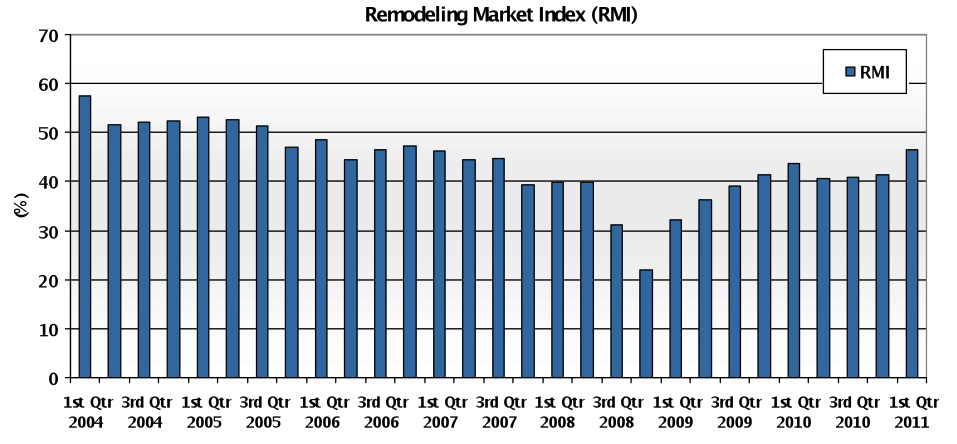
While Home Depot and Lowe’s have struggled through the recession, there are some signs that home improvement spending has, at least, stabilized. Various economic indicators, while weak, are off the lows seen in early 2009. A look at Bloomberg’s survey of Real GDP growth shows a gradual increase to 3% over the next couple of years for the U.S. The Remodeling Market Index (RMI), created by The National Association of Home Builders, shows a slow improvement in remodelers’ perception of the current and future market for residential projects (Exhibit 2). The RMI is created through a combination of current remodeling activity and indications of future activity.
Lowe’s 10-K, December 31, 2010 (pg. 5)
An RMI of under 50 still means that more remodelers report market activity is lower than report it is higher, compared to the previous quarter.
A historically high share of homeownership, an increasing age of housing stock, improving demographics (i.e., growth strong in the 55+ age of households, gen-Xers are reaching peak earning years, female home ownership is up), along with the expectation of improving household income bode well for home improvement spending in the future.
Store Results
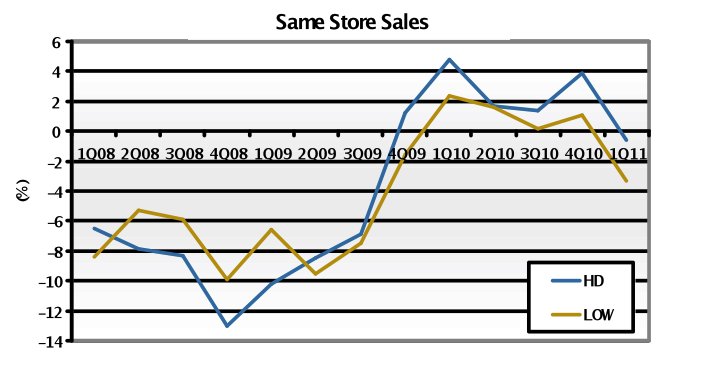
The trends in the economy are evident in the same store sales numbers for Home Depot and Lowe’s. Home Depot has outperformed Lowe’s for the last eight quarters (Exhibit 3). Home Depot has done this mostly through increased traffic. One of Home Depot’s big initiatives was to improve the look and layout of its stores and to increase its customer service. Home Depot has a reputation for lower prices and more pro-friendly atmosphere where Lowe’s is trying to capture the traditional do-it-yourself customer. Lowe’s tries to attract the female customer, who the company claims, is responsible for 80% of home improvement decisions.
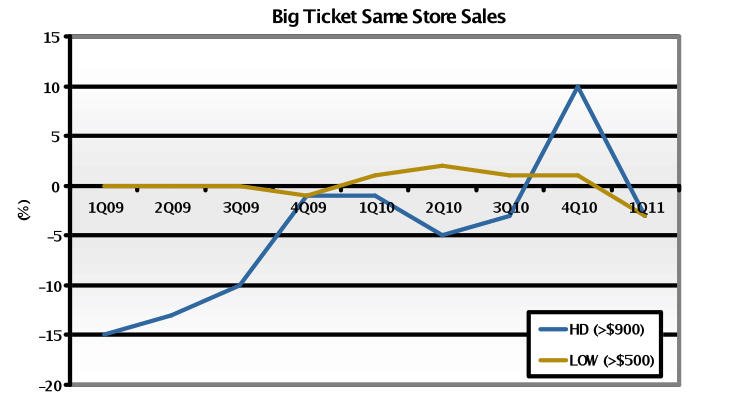
Big ticket item sales for both have been weak. This makes sense given the slowdown in major renovation activity that we wrote about earlier. Having said that, there have been some signs of life. In the fourth quarter of 2010, Home Depot’s big ticket category was up 10% from a year ago (Exhibit 4). Consumers took advantage of tax credits in higher efficiency products including appliances, windows, and HVAC. This is not a trend we expect to continue as evidenced by First Quarter 2011 results.
Home Depot or Lowe’s
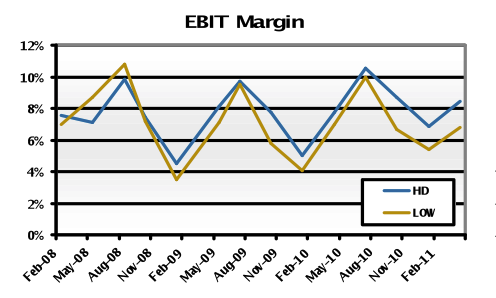
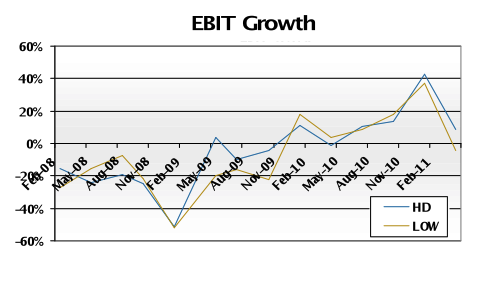
In terms of financial performance, Home Depot has outperformed. Operationally, Home Depot has followed through on its initiatives to improve its supply chain logistics and merchandising efforts. While both companies have improved margins and growth, Home Depot has executed at a higher rate (Exhibits 5 and 6). Not only is Home Depot improving the bottom line because of operational enhancements, but it is also increasing market share given efforts to drive the top line.
Leverage (adjusted for rental expense) and coverage have been steady for both Home Depot and Lowe’s. Over the past five years both companies have decided to add leverage to their balance sheets to benefit shareholders via sizable share buybacks. Home Depot has had a more dramatic change in credit profile, as exemplified by credit ratings which fell from low double-A to high triple-B in 2007. Home Depot announced
a $22.5 billion share repurchase plan and sold its HD Supply business. Home Depot decided to put the share repurchase plan on hold as management became concerned with the economic landscape. A leverage target of 2.0 – 2.5 times (X) was put in place. At the end of 2010, Home Depot had approximately $10 billion still available under its share repurchase plan. In the first quarter of 2011, the company issued $2 billion of senior unsecured bonds. Of that issue, $1 billion was used to repay upcoming debt and the other $1 billion was used to repurchase stock. We would expect Home Depot to continue to use debt to buyback stock so long as the company stays within its leverage guidelines. Lowe’s recently increased its leverage target to 1.8X from 1.5X. In the first quarter of 2011, Lowe’s repurchased $1 billion of stock. The company has $1.4 billion available under the current repurchase plan. When you compare adjusted leverage and coverage for both companies, Lowe’s has been operating with a more moderate balance sheet. Through the economic recession both companies managed their cash flow in a very conservative manner by halting new store openings and freezing share repurchase plans.
As shown in Exhibit 7, both companies demonstrate strong liquidity.
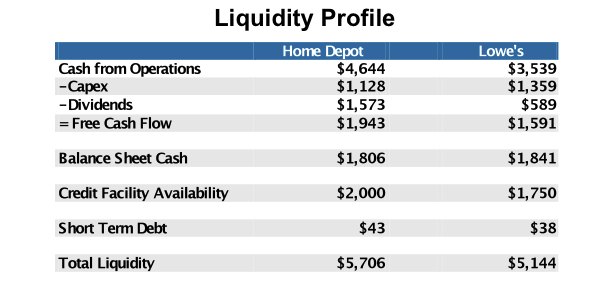
Lowe’s $1.75 billion credit facility matures in June 2012. Lowe’s next debt maturity is not until 9/15/12 ($550 million). Home Depot’s $2.0 billion credit facility matures in July 2013. Home Depot’s next debt maturity is not until 12/16/13 ($1.25 billion). Also, both companies own a large percentage of their stores/real estate with very limited secured financing in place. Lowe’s owned about 89% of its stores with a net book value of $22.1 billion at the end of 2010. Home Depot owned 89% of its stores with a net book value of $25.1 billion at the end of 2010. This is an important asset for bondholders, although we have seen with other retailers (e.g., Target) that real estate ownership can attract active shareholders who want to monetize the assets. Having said that, Home Depot is in a better defensive position given its already large debt position, triple-B credit rating, and large market value.
Both companies are very well diversified across the U.S. with a presence outside of the US as well.
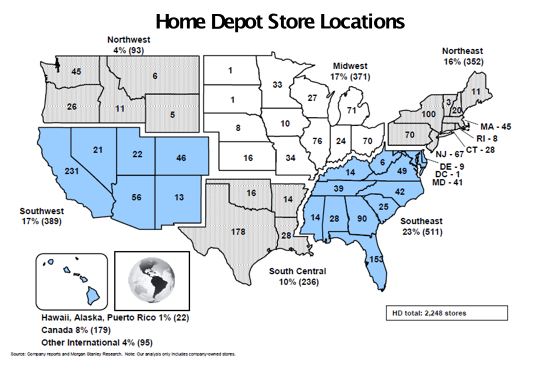
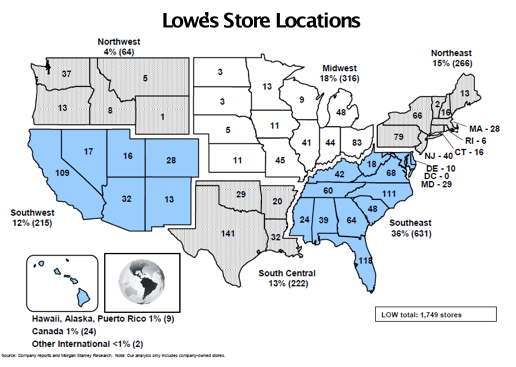
Home Depot has a larger footprint than Lowe’s except for the Southwest region (see exhibits 8 & 9). Home Depot has a significantly larger presence in major metropolitan markets in California, Illinois, Minnesota, New York, Massachusetts, and Florida. California and Florida are two of the states most adversely impacted by the housing crises. Home Depot has 10% (231 stores) of its stores in California and 7% (153) of its stores in Florida while Lowe’s has 6% (109) in California and 7% (118) in Florida. We expect that Home Depot’s larger exposure to these markets will, at some point, provide a bigger uplift to Home Depot’s results. Also, in an effort to catch up with Home Depot, Lowe’s will need to be more aggressive in terms of new store openings which will be a larger drag on free cash flow.
Home Depot is currently rated Baa1/BBB+/BBB+ and Lowe’s is rated A1/A/A. Based on our analysis we believe these credit ratings are too far apart. We would expect the ratings to converge somewhere around low to mid single-A as the overall retail environment improves. Given the current operational momentum at
Home Depot and our expectation that leverage stays within guidelines, we believe ratings will get upgraded into the single-A category. Management at Lowe’s says they want to keep their A1/P1 commercial paper rating which would equate to a A2/A long term rating. We think Lowe’s leverage target will continue to be loosened, as equity holders push for more share buybacks and leverage.
All financial data from Capital IQ and Company 10-K Reports
Home Depot 10-year bonds (HD 4.4% 4/1/21) are offered at a spread of +118/10 year. Lowe’s 10-year bonds (LOW 3.75% 4/15/21) are offered at a spread of +80/10-year. Over time we believe that this 38 basis points difference between the two credits will shrink to 10 basis points or so. One interesting thing to note is that both credits trade on top of each other in the credit default swap (CDS) market, which reflects only credit risk. After analyzing these two retail giants, we believe that Home Depot offers the better opportunity for bondholders.
Written by:
Michael J. Ashley
Vice President, Corporate Credit
Disclaimer: Asset Allocation & Management Company, LLC (AAM) is an investment adviser registered with the Securities and Exchange Commission, specializing in fixed-income asset management services for insurance companies. This information was developed using publicly available information, internally developed data and outside sources believed to be reliable. While all reasonable care has been taken to ensure that the facts stated and the opinions given are accurate, complete and reasonable, liability is expressly disclaimed by AAM and any affiliates (collectively known as “AAM”), and their representative officers and employees. This report has been prepared for informational purposes only and does not purport to represent a complete analysis of any security, company or industry discussed. Any opinions and/or recommendations expressed are subject to change without notice and should be considered only as part of a diversified portfolio. A complete list of investment recommendations made during the past year is available upon request. Past performance is not an indication of future returns.
This information is distributed to recipients including AAM, any of which may have acted on the basis of the information, or may have an ownership interest in securities to which the information relates. It may also be distributed to clients of AAM, as well as to other recipients with whom no such client relationship exists. Providing this information does not, in and of itself, constitute a recommendation by AAM, nor does it imply that the purchase or sale of any security is suitable for the recipient. Investing in the bond market is subject to certain risks including market, interest-rate, issuer, credit, inflation, liquidity, valuation, volatility, prepayment and extension. No part of this material may be reproduced in any form, or referred to in any other publication, without express written permission.
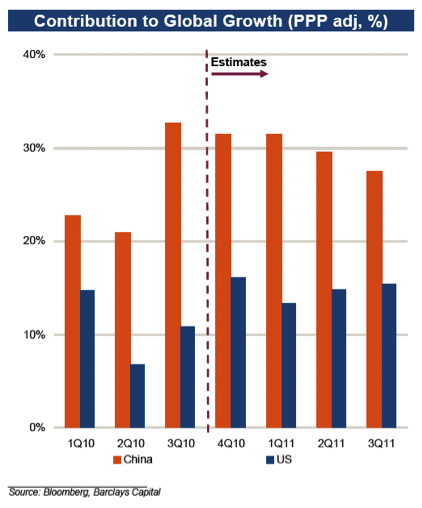
 Source: Bloomberg


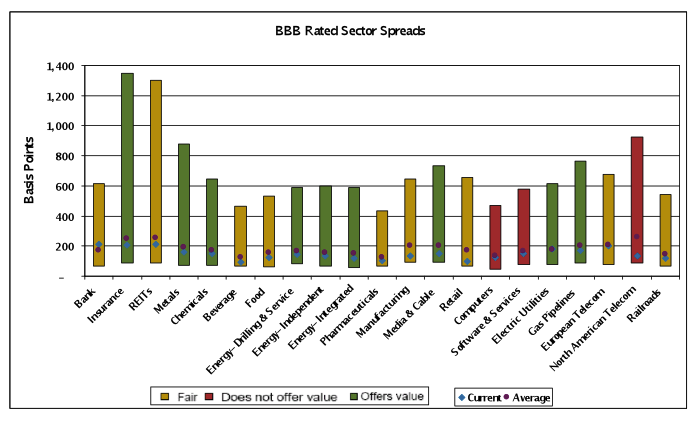 Source: Credit Suisse LUCI Index, 08/02/02 – 1/31/11, 7 – 10 year maturities Note: The bars represent the minimum to maximum spread range for the period.
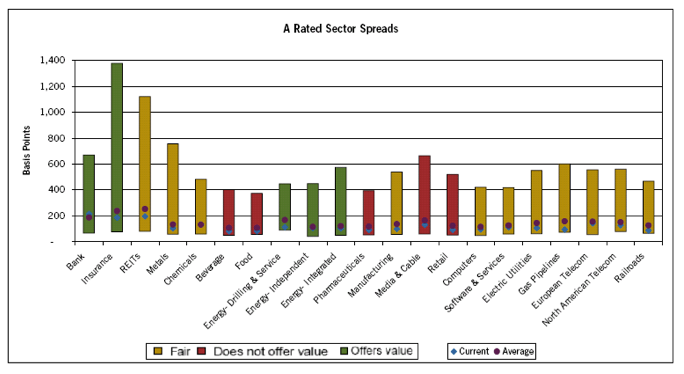 Source: Credit Suisse LUCI Index, 08/02/02 – 1/31/11, 7 – 10 year maturities Note: The bars represent the minimum to maximum spread range for the period.
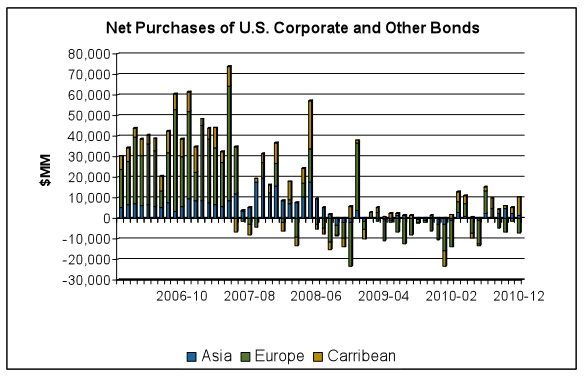 Source: Department of the Treasury