• Skip to primary navigation
  • Skip to main content
  • Skip to footer
AAM CompanyTransparent Logo

AAM Company

AAM Company Website

  • Investment Strategies
    • Investment Grade Fixed Income
    • Specialty Asset Classes
  • Clients
    • Our Clients
    • Client Experience
    • Download Sample RFP
  • Insights
    • Video
    • Webinars
    • Podcasts
    • News
  • About
    • Our Team
    • Events
  • Login
  • Contact Us
Contact

Corporate Credit

November 12, 2010 by

If You Build It, Will They Come?

The elevated mood of the markets continued in October. The Corporate bond market, using the Barclays Corporate Index, generated 55 basis points (bps) of excess returns in October with all maturities posting positive excess returns, and the long end finally outperforming (99 bps long vs. 39 bps intermediate). This has not been the case for most of this year, as reflected in Exhibit 1. The long end has negatively affected the overall market return. Corporate treasurers have been taking advantage of the low yields and improved market sentiment, as new issuance has been very robust over the last couple months. We expect this trend to continue throughout 2011. We believe the deleveraging is largely completed, and companies will look to issue next year primarily to refinance maturing debt and fund acquisitions and shareholder friendly actions.

Exhibit 1
Excess Return across the Curve (1/1/2010 – 10/29/2010)
Maturity, years Excess Return, bps % of Corporate Index
1-3 208 19
3-5 234 19
5-7 220 12
7-10 124 25
7+ -173 26
All 99 100

 Source: Barclays

Typically, in December, we provide a recap of corporate supply for the year and a preliminary forecast. This exercise is important for portfolio managers to proactively manage their credit and industry exposures along the Treasury curve. And, at times, supply is a primary driver of spreads. This has been the case over the past two months. To review, investment grade new issue supply was much greater than expected in 2009 as: 1) deals were pushed back following a 2008 shutdown, 2) companies sought to term-out short-term debt and commercial paper, and 3) spreads, at historical wides, were very attractive to buyers. The original estimate for 2009 was for new issuance to drop by 38%. However, due to the above factors, supply increased by more than 50%. Yet, the heavy issuance was easily absorbed. For 2010, like the beginning of 2009, it was expected to see lower supply due to: 1) higher rates, 2) increased cash balances at corporations, 3) improving corporate profits, and 4) low refinancing needs. The estimate for this year was for gross new issue, excluding noncorporates/144a, to be down 24% (including noncorporates/144a down 18%). However, supply will again be higher than estimates, as reflected in Exhibit 2.  

Exhibit 2

AAM Corp Credit 11-10 2

Source: Barclays

There has been about $560 billion in gross new issuance (excluding noncorporates/144a) this year. Annualized, that would make 2010 about 2% higher than 2009 and about 34% higher than the 2010 estimate. However, the breakdown by sector is important. The majority of issuance this year has been in Financials, as seen in Exhibit 3. Annualized, Financial issuance will be up 59% this year while Industrials and Utilities will be down 25% and 28%, respectively. Meanwhile, Financials will make up 50% of the 2010 gross issuance while Industrials will be 43% and Utilities 7%. Why is this important? Fixed income investors need diversification, particularly as allocations to high grade Corporates have remained heavy throughout 2010. Exhibit 4 shows the allocation to Corporates in High Grade mutual bond funds while Exhibit 5 shows how insurance companies have been struggling to deal with the lack of diversified credit supply, having to allocate more of their heavy cash balances to Treasuries. At the end of the third quarter this year, High Grade funds and insurance companies together held about 40% of outstanding high grade bonds.


Exhibit 3

AAM Corp Credit 11-10 3

Source: Barclays

Exhibit 4: Allocations to corporate bonds within High Grade bond mutual funds

AAM Corp Credit 11-10 4

Source: Company filings, JP Morgan

Note the Barclays Capital Aggregate Index is comprised of 19% Corporates, 36% Structured Products, 46% Treasuries and other government bonds

Exhibit 5: Insurance Companies are Struggling to Deal With This Lack of Credit Supply, Increasing Demand for Treasuries

AAM Corp Credit 11-10 5

Source: NAIC Statutory filings, JP Morgan

Note: Corporate Credit includes both High Grade and High Yield bonds; Structured Products include ABS, CMBS, and RMBS; Mortgages = Mortgage Loans

Supply seemed to come in clusters this year. Yet, it was easily absorbed. Exhibit 6 shows the 2010 monthly gross issuance versus 2009, while Exhibit 7 depicts the 2010 monthly net (including maturities and redemptions) issuance versus 2009, along with spread performance of the Barclays Corporate Bond Index. Focusing on the two busiest months this year, March and September, we see that spread performance was actually positive (e.g. spreads tighter) both months. March 2010 saw $67 billion of net new issue but spreads were 23 bps tighter on the month. September saw $86 billion of net new issue and spreads were 11 bps tighter. Yet, spreads were wider in April, May, and June when net new issue was slow. Macro factors concerning slower economic growth, sovereign credit risk, and financial sector regulation occupied the market’s psyche during this period. These underlying factors drive both issuance and spreads, which is why one cannot prove a causal relationship between supply and option adjusted spread (OAS). If one regresses supply with OAS, it is a positive relationship and statistically significant, but supply does not explain the movement in OAS (a low R squared). As more variables are presented, supply becomes statistically insignificant and the relationship is negative.

Exhibit 6

AAM Corp Credit 11-10 6

Source: Barclays

Exhibit 7

AAM Corp Credit 11-10 7

Source: Barclays

The $560 billion issued this year is about $56 billion per month or $14 billion per week. As of this writing, there is only about 6 more weeks left in 2010 for active markets. As such, we may see only about $84 billion more in gross issuance, which would put 2010 at $645 billion or down about 2% versus 2009. However, as fixed income investors remain overweight credit, we expect any remaining supply to be easily absorbed. It is still too early for 2011 projections as our team is still pouring through third quarter earnings announcements and company estimates. However, the early read shows that gross issuance could be flat to moderately higher versus 2010.

Disclaimer: Asset Allocation & Management Company, LLC (AAM) is an investment adviser registered with the Securities and Exchange Commission, specializing in fixed-income asset management services for insurance companies. This information was developed using publicly available information, internally developed data and outside sources believed to be reliable. While all reasonable care has been taken to ensure that the facts stated and the opinions given are accurate, complete and reasonable, liability is expressly disclaimed by AAM and any affiliates (collectively known as “AAM”), and their representative officers and employees. This report has been prepared for informational purposes only and does not purport to represent a complete analysis of any security, company or industry discussed. Any opinions and/or recommendations expressed are subject to change without notice and should be considered only as part of a diversified portfolio. Past performance is not an indication of future returns.

This information is distributed to recipients including AAM, any of which may have acted on the basis of the information, or may have an ownership interest in securities to which the information relates. It may also be distributed to clients of AAM, as well as to other recipients with whom no such client relationship exists. Providing this information does not, in and of itself, constitute a recommendation by AAM, nor does it imply that the purchase or sale of any security is suitable for the recipient. Investing in the bond market is subject to certain risks including market, interest-rate, issuer, credit, inflation, liquidity, valuation, volatility, prepayment and extension. No part of this material may be reproduced in any form, or referred to in any other publication, without express written permission.
November 1, 2010 by

How Contagious is It?

The Corporate market experienced a modest pullback in late November driven by credit spread widening associated with concerns surrounding Europe, wiping out the positive excess returns for the month. We reduced our European credit positions prior to the widening, namely regulated entities in the region (Exhibit 1).

Exhibit 1
AAM Corp Credit 12-10 1

Source:  Barclay’s; Note: 10-year bonds

We have witnessed European governments not only raising costs for the banks, but non-financial companies as well. For example, in regard to the utility sector, Germany proposed a nuclear fuel tax and Spain postponed its scheduled tariff increase and embarked on a wholesale review of the electricity sector’s costs. Moreover, the Greek government imposed special contributions on Greek profitable entities calculated on their total net income for the fiscal year 2009 based on a progressive scale up to 10% of their total net income. Regulated entities are particularly vulnerable not only due to revenue pressure, but also because they have high operating leverage and are very large employers. Therefore, as revenues are pressured by miscellaneous levies and the sour economy, costs are not easily adjusted to protect profit margins. In addition, credits that benefit from ratings uplift due to sovereign support are experiencing credit rating downgrades as sovereign ratings are downgraded and/or notching is widened (between the sovereign and credit), with support being viewed as less likely given governments’ reduced financial flexibility. Our optimism earlier this year has clearly waned regarding Europe. We await important events this week such as the European Central Bank’s Long-term Refinancing Option (LTRO) full allotment decision and Portugal and Spain debt issuance, but appreciate the market’s concern, which is chiefly how the underlying structural problems will be addressed.

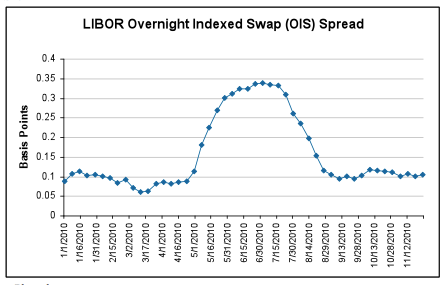
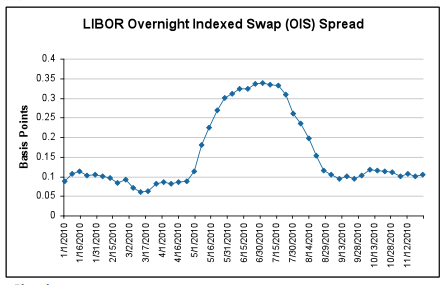
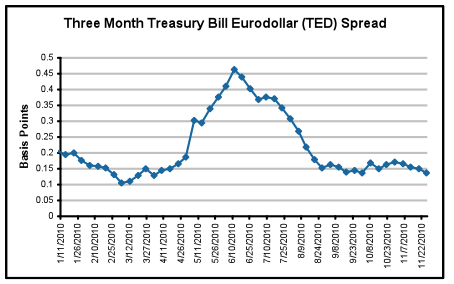
Except for the banking sector and select European utility and telecom credits, we have not witnessed broad based spread widening or systemic risk increasing in the Corporate market. While the stock market has sold off modestly, three-month Treasury-bill Eurodollar (TED) and LIBOR Overnight Indexed Swap (OIS) spreads have remained low (Exhibits 2 and 3). We would expect this to continue unless the market’s fears concerning Spain or other large sovereigns (e.g., Italy) are stoked.

Exhibit 2
AAM Corp Credit 12-10 2
Source: Bloomberg

Exhibit 3
AAM Corp Credit 12-10 3
Source: Bloomberg

We remain constructive on Corporate credit, but at current spread levels, credit selection is paramount. Spreads for high quality credits are tight, yields are low, and while BBB Industrials are attractive given the stabilization of the U.S. economy (see Exhibit 4), we are investing carefully given our expectation for continued high spread volatility.

Exhibit 4
AAM Corp Credit 12-10 4
Source: Barclays

Disclaimer: Asset Allocation & Management Company, LLC (AAM) is an investment adviser registered with the Securities and Exchange Commission, specializing in fixed-income asset management services for insurance companies. This information was developed using publicly available information, internally developed data and outside sources believed to be reliable. While all reasonable care has been taken to ensure that the facts stated and the opinions given are accurate, complete and reasonable, liability is expressly disclaimed by AAM and any affiliates (collectively known as “AAM”), and their representative officers and employees. This report has been prepared for informational purposes only and does not purport to represent a complete analysis of any security, company or industry discussed. Any opinions and/or recommendations expressed are subject to change without notice and should be considered only as part of a diversified portfolio. Past performance is not an indication of future returns.

This information is distributed to recipients including AAM, any of which may have acted on the basis of the information, or may have an ownership interest in securities to which the information relates. It may also be distributed to clients of AAM, as well as to other recipients with whom no such client relationship exists. Providing this information does not, in and of itself, constitute a recommendation by AAM, nor does it imply that the purchase or sale of any security is suitable for the recipient. Investing in the bond market is subject to certain risks including market, interest-rate, issuer, credit, inflation, liquidity, valuation, volatility, prepayment and extension. No part of this material may be reproduced in any form, or referred to in any other publication, without express written permission.
October 6, 2010 by

How Should I Spend My Cash?

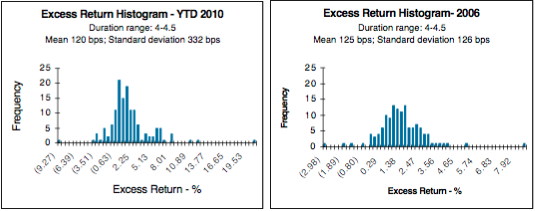
While not as strong as the equity market, the investment grade credit market as represented by the Barclays Corporate Bond Index posted positive excess returns in September (78 basis points (bps)).  This returns the Index, once again, to positive territory for the year (39 bps).  Despite the positive excess returns in 2010, idiosyncratic (firm specific) risk remains high, as reflected by the histograms in Exhibit 1.  Although the means of excess returns from 2010 and 2006 are approximately the same, the volatility is almost three times greater so far in 2010.  The outperformers in 2010 have been primarily finance credits, while the underperformers reside in many different industries.  We expect idiosyncratic risk to remain high for the next 12-18 months and anticipate companies to become more active with their large cash coffers.  Unlike 2009-2010, where sector/industry selection was key for outperformance, we expect credit selection and the ability to wait for new issues will be the keys for outperformance going forward.

Source: Barclays Capital, AAM

Many economists are citing the large cash balances on company balance sheets as a source for economic stimulus.  We believe the peak of the cash balances may be the second half of 2010.  After the setback experienced in the second quarter of 2010, consensus seems to be forming around a slow growth economic environment.  The probability of a double dip varies depending on the economist, but even a bear like Dr. Nouriel Roubini is assigning a 40% chance compared to others that are in the 20-33% range.  The Federal Reserve’s recent actions and comments also serve to reduce the economic uncertainty.  This leaves regulatory and political uncertainty, acting as implicit costs for companies.

In this environment of low growth and political sensitivity towards the economy, we expect companies will start spending their cash.  That said, we expect the cash to be spent primarily on the following in lieu of growth related investments which would provide more of a catalyst for hiring (not in any particular order):

  • Capital spending related to productivity enhancements
  • Repurchasing shares and/or debt
  • Increasing or initiating dividends
  • Mergers and acquisitions (M&A)

Technology related companies are among those that have benefited from the investment in productivity.  For instance, in its recent investor meeting, Kroger, a retail supermarket chain, commented that its current capital expenditure strategy continues to focus on projects that will either help drive improvement in sales productivity or costs versus spending on new development.

We expect more companies to make announcements relating to share repurchases or increased dividends.  Cisco, a global technology company, was not alone in its plan to issue the company’s first dividend.  Companies have also been active in tendering for short maturity, high coupon, or structurally superior debt or using cash to retire maturing debt in lieu of refinancing.  This is being reflected by the banks as well, with corporations reducing their revolving credit facilities.  Total commercial and industrial loans outstanding for the U.S. banking system fell 23% from January 2009 through August 2010, while the amounts drawn under the revolvers fell from 42% to 35% during the same time period.

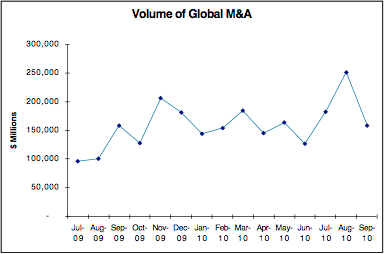
Lastly, mergers and acquisitions (M&A) appear to be picking up after companies paused in the second quarter of 2010 to assess the sovereign and economic risk (Exhibit 2).  Given the backdrop of low economic growth, we expect the M&A pace to accelerate as regulatory and political uncertainty decreases.  Most sectors are participating in M&A for consolidation benefits relating to synergies, as opposed to investing in revenue growth opportunities.

Source: Bloomberg, AAM

At an equity telecommunications/media conference in late September, Verizon’s CEO, Ivan Seidenberg, stated he expected another consolidation wave over the next three to five years among content, cable, and telecommunications companies given the overcapacity.  At this same conference, AT&T’s CEO, Randall Stephenson, was more positive towards M&A after shying away earlier this year given the regulatory risk.  Although this is one industry that is ripe for consolidation, such M&A could lead to spread widening due to cash deals and the debt issuance and leverage that would result.  Another industry that is faced with too much supply for the level of demand, in addition to heightened regulatory risk and the associated costs, is Banking.  We would expect consolidation to accelerate in this sector as well via acquisitions made by both domestic and international banks.  However, this is likely to be dominated by FDIC assisted deals in the near term.

Although good for the long term, these activities are first, not conducive to job growth in the near to intermediate term and second, will likely face mixed reactions from investors and rating agencies as not all will be creditor friendly.  Debt issuance relating to M&A should be readily absorbed as investors continue to look to investment grade credit as a defensive investment alternative.  As companies deplete their cash coffers, we expect investments to be made within current rating parameters.  However, this lessens financial strength and flexibility in an environment where the risk of a double dip is not miniscule.  For companies that are cyclical and have volatile cash flows, fixed income investors should be cautious of management teams that are too aggressive at this stage of the recovery.

This information is developed using publicly available information, internally developed data and outside sources believed to be reliable.  While all reasonable care has been taken to ensure that the facts stated and the opinions given are accurate, complete and reasonable, liability is expressly disclaimed by AAM and any affiliates (collectively known as ‘AAM’), and their respective officers and employees.  Any opinions and/or recommendations expressed are subject to change without notice.
 
This information is distributed to recipients including AAM, any of which may have acted on the basis of the information, or may have an ownership interest in securities to which the information relates.  It may also be distributed to clients of AAM, as well as to other recipients with whom no such client relationship exists.  Providing this information does not, in and of itself, constitute a recommendation by AAM, nor does it imply that the purchase or sale of any security is suitable for the recipient.

September 2, 2010 by

Is It Really That Bad?

Earnings season is almost over and while the data was positive overall, management commentary coupled with weaker than expected economic data disappointed the markets, sending equities and Treasury yields lower.  Corporate spreads were mixed with intermediate-to-longer duration bond spreads widening while short duration spreads tightened.  Similarly, cyclical and other economically sensitive sectors generally underperformed.  The Corporate market, as measured using Barclays Corporate Index, posted -66 basis points (bps) of excess return for the month, pulling down the excess return year-to-date to -48 bps.  We expect this volatility to continue in the second half of the year.  Since 1989 when the U.S. GDP growth rate was between 0% to 2%,  the Investment Grade Credit market posted positive excess returns.  We expect the same in 2010, although sector and credit selection is critical, as the credit market should continue to differentiate and assign greater risk premiums to sectors and credits that face challenging growth prospects either due to the economy or idiosyncratic issues.

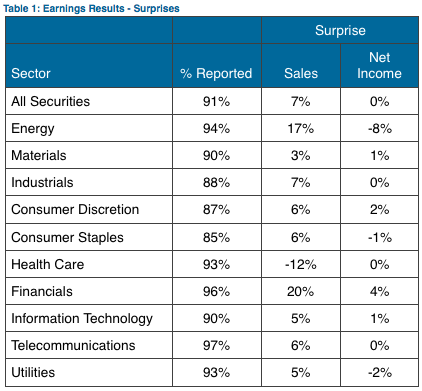
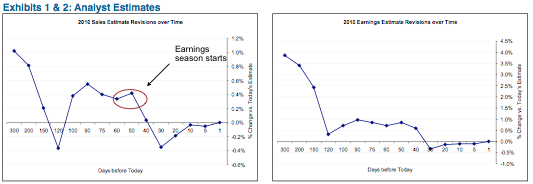
Since last month’s Corporate Credit View was dedicated to Financials, this month’s will focus on Industrials and Utilities.  Despite a quarter of better than expected results (Table 1), analysts were busily revising their estimates down for Industrials and Utilities for 2010 (See Exhibits 1 and 2).  Even Western Europe surprised on the upside both for the second quarter and the forecast for the second half of the year.

Source: Bloomberg (Region: U.S., Aggregate Actual vs. Consensus Estimate, Share weighted), AAM; Data as of 8/27/10


Sources: Bloomberg, AAM; Data as of 9/2/2010

We attribute these negative revisions to the worse than expected economic data that continued through August, notably imports, jobless claims, and home sales.  Economists revised GDP forecasts down for the second quarter and the second half of 2010 and increased the probability of a double-dip recession, now approximately 25%.

CEOs from bellwether companies, Cisco and WPP PLC, voiced their concerns about the uncertain state of the economy and how that may affect their businesses, as customers make changes to their purchasing decisions.  They were not alone, as the number of companies sounding a more cautious tone increased.  Most have been cautious but not pessimistic and the lack of job creation, capital spending, and inventory re-stocking reflect this outlook.  For example, retailers in general have tempered their full year guidance. Most of the companies who are reporting better than expected earnings have done so because of improvements with expenses rather than sales, as same-store sales have slowed in the second quarter versus the first quarter.  Inventories have increased, which could lead to heavier promotion and potentially lower margins in the third quarter.   Our cautious outlook for the economy and the consumer in particular leads us to invest only in category leaders, which includes high quality discounters such as Walmart and Target.

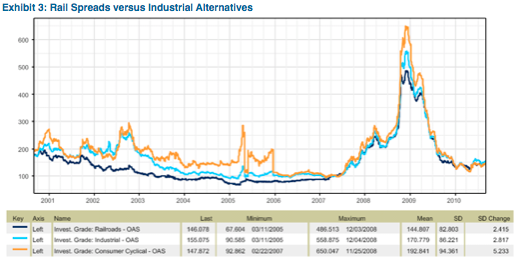
Despite a slowing Manufacturing sector, we saw continued improvement in the Rail sector.  Every rail company beat estimates in the second quarter of 2010 and management commentary was constructive.  Pricing and productivity enhancements are driving margins, and volumes are supporting the improvement in sales versus last year. We heard from most management teams that the economic recovery is in place even though it would probably be best described as only modestly growing. If volumes remain on the current trajectory, we could see an uplift to earnings estimates for the second half of 2010, accompanied with more aggressive share repurchase activity.  This would be notable since rail loadings reflect customer decisions made six to nine months in the past, or in the case of third quarter 2010 results, the period of time when Europe garnered significant attention.  Despite the Rail sector’s exposure to the broad economy, we consider the more diversified rail operators (i.e., Union Pacific (UNP), Burlington (BRK), Norfolk Southern (NSC)) viable investment alternatives in a low growth environment given strong competitive advantages versus other shipping modes and steady cash flow generation.  We believe Rail spreads are attractive versus cyclical sectors, as they are about flat to each other and Rail spreads are less volatile (Exhibit 3).

Source: Barclays Capital

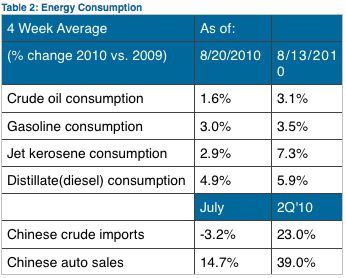
In the Energy sector, second quarter results were a mixed bag, and we expect them to remain murky in the second half of 2010.  Generally speaking, the independent and integrated companies produced strong second quarter 2010 results due to increased production as well as higher commodity prices.  The contract drillers and service companies, however had weak quarters due to the moratorium in the Gulf of Mexico and reduced demand from Latin American countries.  In the second half of the year, we expect cash flows to be flat to slightly weaker for most of the Energy sector.  Particularly vulnerable are those companies that are levered to natural gas, which has suffered due to abundant supply and weaker industrial demand.  Absent a hurricane in the third quarter, natural gas prices are unlikely to rise meaningfully in the second half of the year.  Contract drillers and service companies are likely to suffer weaker results due to uncertainty in the Gulf of Mexico, excess capacity created by the moratorium, and weaker natural gas prices.  In terms of economic barometers, the following data points in Table 2 reflect positive, albeit slowing, demand domestically and continued strong demand from China, which is supportive for the Energy sector in the near-to-intermediate term and suggests a continuation of slow growth at a macro level:

Sources: Department of Energy; Energy Information Administration, China Automotive Information Network, Customs General Administration, AAM

The Utility sector posted modestly improved second quarter 2010 results behind strong weather-related demand in the northeastern part of the U.S.  The results were partially offset by weaker pricing, which is the by-product of lower natural gas prices.  Companies seem to be preparing for an improving environment, as their allowance for doubtful accounts have been trending lower.  Most utilities expect demand to be up very modestly in the second half, as industrial demand remains tepid.  Weak natural gas prices should also lead to lower prices, which will hurt the margins of the unregulated power producers.  More than demand or pricing however, the biggest concerns identified by the sector were regulatory uncertainty regarding the now abandoned cap and trade regulation and the potential for increased taxes on dividends.  We believe these concerns could lead to potentially lower capital spending and greater share repurchases.  Regulatory and tax uncertainty were also cited as concerns by telecom companies, among others. We believe these are the main reasons why companies have been hesitant to spend or invest. Until this uncertainty is resolved, we expect these companies to remain hesitant to reduce cash or reinvest earnings. The approaching November elections only add to the difficulty of predicting the upcoming regulatory environment.

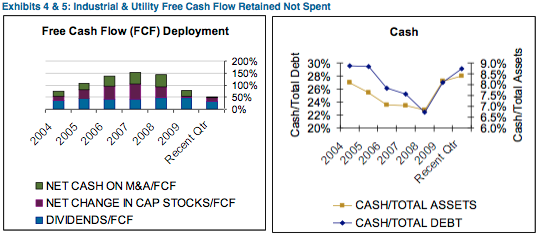
We like the backdrop the cash build (Exhibits 4 and 5) provides for the economy, and believe cash at the investor level has provided positive technical support for the Corporate bond market this year, especially for high quality Industrial and Utility credits.  Unless the probability of a recession increases another 10+ percentage points, we expect this positive technical support to continue.

Screen Shot 2016-01-26 at 18.00.06
Sources: Bloomberg, AAM

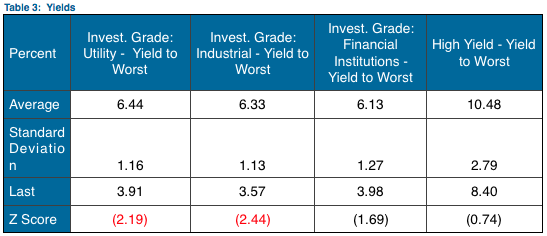
We remain constructive on the Corporate market, but as spreads for Utility and Industrial credits have generally marched tighter and Treasury yields have fallen, all-in yields for these two sectors are historically very low (Table 3).  If spreads provide compensation for default risk adjusted for recoveries, the high dollar prices (which affects recovery rate) coupled with the uncertain economic outlook (which affects default rate) make spreads for these sectors particularly vulnerable to widening.  We have reduced our exposure to more economically sensitive Industrial sectors (e.g., Media/Entertainment), redeploying the funds in non-Corporate sectors.

Source: Barclays Capital, Date range from 12/31/1993 to 8/23/2010, AAM

This information is developed using publicly available information, internally developed data and outside sources believed to be reliable.  While all reasonable care has been taken to ensure that the facts stated and the opinions given are accurate, complete and reasonable, liability is expressly disclaimed by AAM and any affiliates (collectively known as ‘AAM’), and their respective officers and employees.  Any opinions and/or recommendations expressed are subject to change without notice.

This information is distributed to recipients including AAM, any of which may have acted on the basis of the information, or may have an ownership interest in securities to which the information relates.  It may also be distributed to clients of AAM, as well as to other recipients with whom no such client relationship exists.  Providing this information does not, in and of itself, constitute a recommendation by AAM, nor does it imply that the purchase or sale of any security is suitable for the recipient.

August 4, 2010 by

Can We Still “Bank” on Economic Growth in the Second Half of 2010?

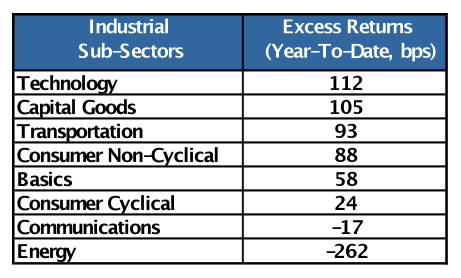
After a volatile three months, Corporate spreads tightened in July. Spreads ended the month 20 basis points (bps) tighter, generating 134 bps of excess returns per the Barclays Corporate Index. The Energy sector recovered some of the widening year-to-date, posting 259 bps of excess returns in the month. The Corporate Index is back in positive territory, generating 23 bps of excess returns year-to-date. Finance is outperforming with 41 bps of excess return vs. Utilities (+15 bps) and Industrials (+13 bps). Of the Industrial sub-sectors, those that are less cyclical are outperforming (Exhibit 1). This is what we had expected, consistent with a slow, fragile recovery.

Exhibit 1: Industrial Sub-Sector Performance
Source: Barclays

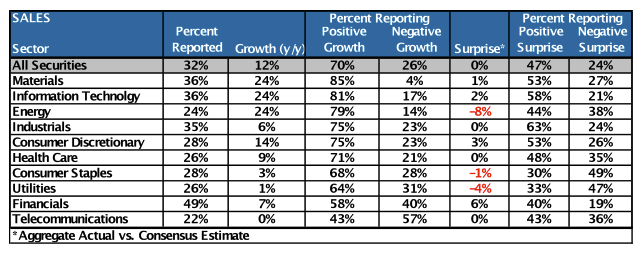
As the near term lift from the stimulus wanes, investors are combing through earnings reports to help forecast near term economic activity. Consumers need to keep spending and businesses need to hire more people. It sounds very simple. As of late afternoon on Friday July 30, approximately one third of companies had reported results. Of this set, sales growth was evident in most sectors relative to 2009 (Exhibit 2). We explained earlier this year that credit selection and investing in growth would be keys to outperformance (versus a down-in-credit quality strategy). Except for Energy, which is an idiosyncratic issue, there does appear to be a nice correlation between growing and/or defensive industries with excess returns.

Exhibit 2: Second Quarter 2010 Earnings Review (as of 7/30/10)
AAM Corp Credit 8-10 2
Source: Bloomberg

We began our earnings review with the banking sector. That sector is the first to report and the most efficient, as virtually all the large banks report in the first few weeks, including many of the European banks. We will concentrate on this sector in this month’s AAM Corporate Credit View, addressing Industrials and Utilities next month. That said, there is a common thread among all sectors, and that is the importance of top line growth to job growth. Therefore, while it’s nice to see earnings and sales growth in the second quarter, we are more sensitive to future periods and thus far, management guidance and commentary have been supportive of a continued slow, but growing economy.

The US banking sector generated stronger than expected second quarter 2010 operating results due to materially improved credit costs. However, the improvement in asset quality was somewhat overshadowed by questions about revenue sustainability as a result of shrinking balance sheets and the yet-to-be-quantified costs of the Dodd-Frank bill (financial regulatory reform).

Credit quality within bank loan books improved broadly, continuing a trend which began to manifest itself in the fourth quarter of 2009. In general, the large money center banks are about a quarter ahead of the regional bank sectors in the asset quality improvement cycle, primarily reflecting the differing make-up of their respective loan books. Commercial & Industrial and credit card portfolios led the way in terms of asset quality improvement, while commercial real estate and construction loans continued to deteriorate and home equity loan asset quality appears to have stabilized for the moment, but at an elevated level of credit costs. In a number of instances, operating performance benefited from reserve releases (somewhat surprising given still high non-performing asset levels), with such releases being most notable for the three large credit card issuers (JPMorgan/Bank of America/Citi). Although provisions, net charge-offs, non-performing assets and early stage delinquencies all fell materially for the sector, bank management teams have cautioned that credit costs are not likely to show the same rate of improvement in the second half of 2010 if the economy cools and unemployment remains high.

Offsetting the positive credit quality developments, there is growing concern over revenue sustainability as a result of loan book contraction, narrowing interest spreads and the potential impacts of financial regulatory reform. Banks are experiencing shrinking loan balances and muted credit demand as consumers de-lever and corporations conserve cash in the face of economic uncertainty. In addition, many banks continue to run-off portions of their loan books (e.g., subprime), which removes interest earning assets even as it removes asset quality issues. Interest income is also being squeezed by the extended period of low interest rates, particularly as higher yielding assets re-price. While this has been offset to some extent by a run-off of more expensive Certificates of Deposit sourced during the funding crunch, the absolute level of net interest income is likely to contract given the low absolute level of interest rates and narrowing interest spreads (this situation is mirrored in available-for-sale portfolios as well).

Finally, the impact of the Dodd-Frank bill, while impossible to quantify on a system-wide basis before required rule writing and implementation, is likely to negatively impact non-interest revenue in several areas. Within retail banking, lucrative overdraft fees and credit and debit card interchange revenue will be impacted, although, only JPMorgan and Bank of America have attempted to quantify the impact to date. In money center bank space, the impact of the Volcker Rule and derivative regulations were blunted somewhat in the conference process. The likely end result of financial regulatory reform on bank performance was best summed up by Jamie Dimon of JPMorgan, who noted that while specific revenue streams will no doubt be impacted, “mitigation” efforts to spread costs and recoup loss fee revenue through new charges/products will likely offset the impact of the bill on bank results over time.

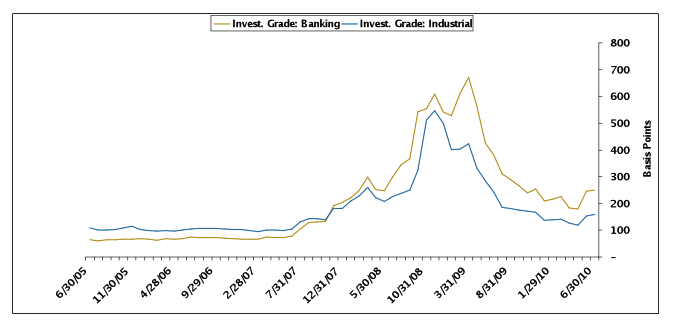
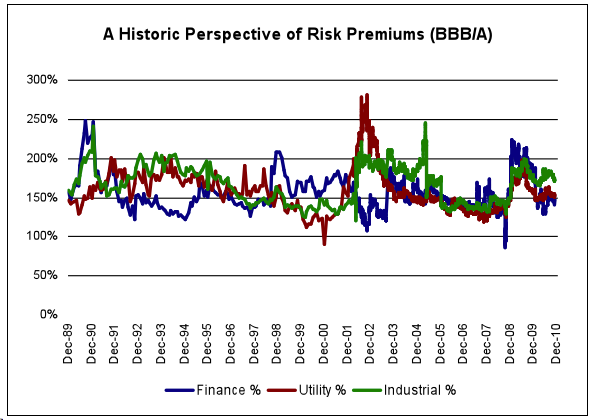
Overall, we would characterize the quarter as guardedly positive, particularly as we saw a continuation of the credit quality improvement trend that has been key to our overweight allocation to the banking sector. While questions about balance sheet, revenue and profit growth appear to be looming in investors’ minds, we would characterize this (for the moment) as more of an equity concern, given the still strong liquidity and capital positions of the sector as a whole. Going forward, the biggest challenge appears to be macroeconomic, as a slower rate of GDP growth in the second half of 2010 may cause credit improvement to stall (or even reverse). Since we are forecasting a slow, muted recovery, we are comfortable with the credit profiles of the money center banks, highest quality regional banks, and select international banks. We are investing defensively in this sector(i.e., high quality banks), believing the spread differential between banks and industrials is too wide (Exhibit 3). We realize that spreads will remain volatile until we get confirmation that credit trends will not reverse as a result of a double-dip recession or protracted slow economic growth.

Exhibit 3: Bank Spreads Remain Wide vs. Industrials

Source: Barclays

This information is developed using publicly available information, internally developed data and outside sources believed to be reliable.  While all reasonable care has been taken to ensure that the facts stated and the opinions given are accurate, complete and reasonable, liability is expressly disclaimed by AAM and any affiliates (collectively known as ‘AAM’), and their respective officers and employees.  Any opinions and/or recommendations expressed are subject to change without notice.

This information is distributed to recipients including AAM, any of which may have acted on the basis of the information, or may have an ownership interest in securities to which the information relates.  It may also be distributed to clients of AAM, as well as to other recipients with whom no such client relationship exists.  Providing this information does not, in and of itself, constitute a recommendation by AAM, nor does it imply that the purchase or sale of any security is suitable for the recipient.

July 7, 2010 by

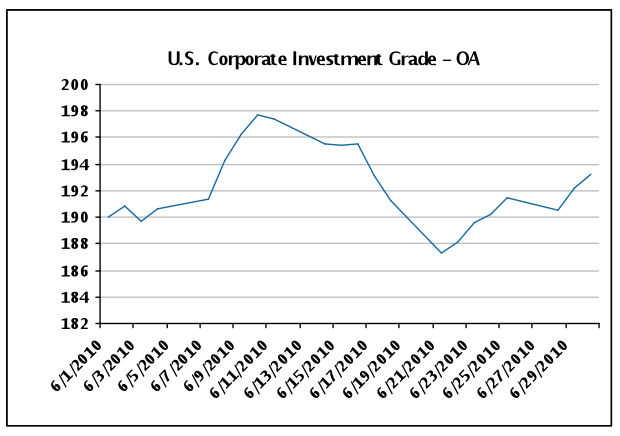
June was another volatile month for Corporate credit (Exhibit 1). Spreads ended the month modestly wider, generating -9 basis points (bps) of excess returns for the Barclays Corporate Index driven mainly by the underperformance of the Energy sector (-249 bps excess return).

Exhibit 1
Exhibit 1

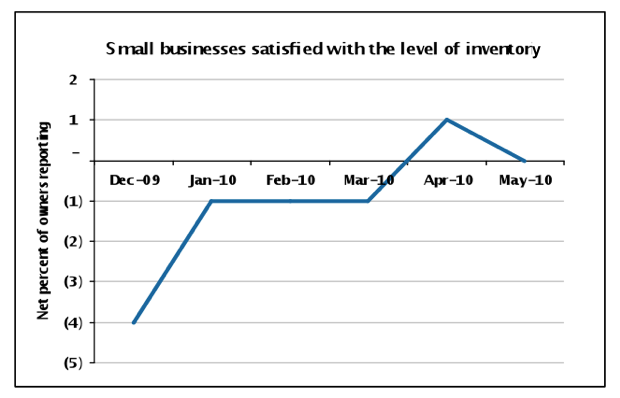
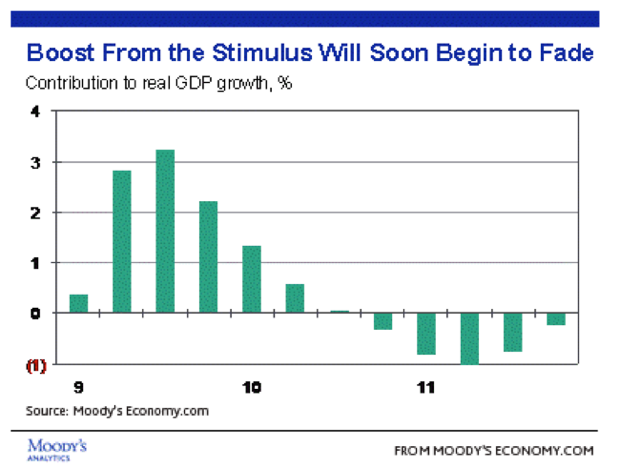
June failed to produce sufficient positive signs to allay concerns regarding the sustainability or strength of the domestic economic recovery. Early indicators are pointing to a slowdown in growth in the second half of the year. The question is how slow? We had believed growth would be modest this year, less than 3%, and vulnerable to a public to private sector handoff as stimulus spending waned (Exhibit 2). Since May, manufacturing has continued to expand, albeit at a slower pace, and private sector employment has disappointed, as private employers turn more cautious. We believe we may be at a point where inventory restocking has stalled and employers are willing to replace but not build (Exhibit 3). Small business owners, as reflected by the National Federation of Independent Business (NFIB) survey, and large business CEOs, as reflected by the Business Roundtable survey, are concerned with the overall global economy, legislative policy, and new regulations and rules. Managers do not feel comfortable hiring new workers or spending capital when they are uncertain of the return on investment. Therefore, jobs remain very difficult to source. We have been expecting jobless claims to fall below 400,000, a level that typically coincides with the end to payroll employment losses, and are still waiting. The jobs report released on July 2, 2010 was very weak, considering household employment declined sharply and both the workweek and average hourly earnings declined.

Exhibit 2
Exhibit 2
Exhibit 3
Exhibit 3

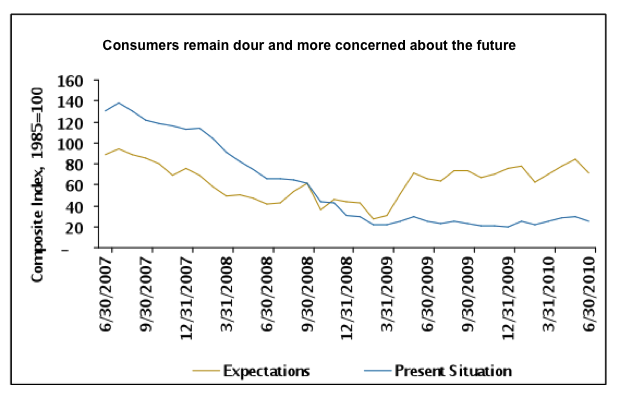
The high level of unemployed workers is being reflected in lower consumer confidence. The June Conference Board Index (Exhibit 4) reading disappointed (52.9 vs. a revised 62.7 in May) with a 16% drop in the expectations part of the index, a source of concern given the reliance on the consumer to solidify the recovery. As reflected in the present situation portion of the index, consumers recognize the obstacles they and their government face.

Exhibit 4
Exhibit 4

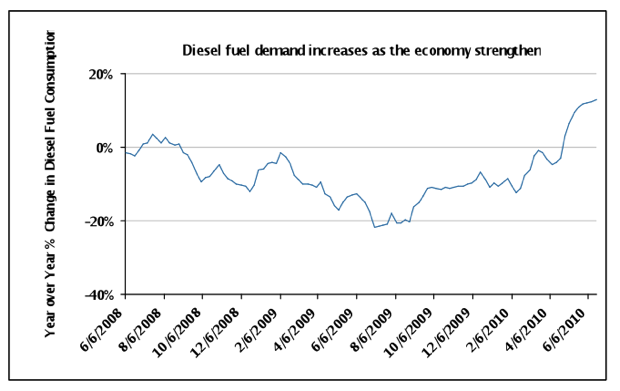
Firm and industry level data has been encouraging, albeit reflecting decisions that may have been made earlier in the year or quarter. For instance, data points such as rail carloads, intermodal traffic, rig count, energy consumption (Exhibit 5), advertising, retail sales on the Industrial side and return on assets, net interest margin and asset quality on the Banking side have all shown improvement from 2009 levels. Acknowledging the time lag that exists from when a decision is made at the consumer and/or business level to when the information is made available to the public via a statistic or index figure, we will continue to analyze this data and incorporate management commentary and forecasts to make changes to our base case. That said, recent economic data suggests the risk of growth coming in below consensus forecasts has increased.

Exhibit 5
Exhibit 5

Our investment mantra earlier this year of “investing in growth” instead of “reaching for yield” reflected our view that investors could benefit from investing in high quality companies in defensive industries. We believed and continue to believe that a “slow growth” environment should result in merger and acquisition activity, innovation to differentiate, and industry participant bifurcation where industries are cleansed of weak operators that benefitted from the earlier days of
easy money. We are early in this process, but are seeing signs of potential catalysts for the latter (i.e., widening divergence of balance sheets and access to capital for strong vs. weak firms).

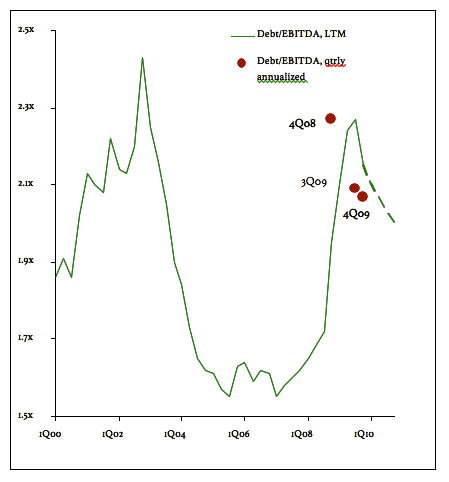
At this point, we believe fundamental improvement has taken place in many facets of the economy, including investment grade company balance sheets (Exhibit 6), and a recovery, even one that is lackluster, is still on track. However, the recent jobs report shows that the labor market has yet to reach the point where it is self sustaining, making our base case forecasts at the credit level vulnerable to downward revisions. The degree of these revisions could affect our opinion on the Corporate credit market, but at this point we continue to expect positive excess returns for those credits that are higher quality and more defensive (e.g., food, beverage, pharmaceutical, aerospace/defense, rails), in addition to high quality banks and believe there are opportunities in the energy sector.


Exhibit 6
Exhibit 6


This information is developed using publicly available information, internally developed data and outside sources believed to be reliable.  While all reasonable care has been taken to ensure that the facts stated and the opinions given are accurate, complete and reasonable, liability is expressly disclaimed by AAM and any affiliates (collectively known as ‘AAM’), and their respective officers and employees.  Any opinions and/or recommendations expressed are subject to change without notice.

 This information is distributed to recipients including AAM, any of which may have acted on the basis of the information, or may have an ownership interest in securities to which the information relates.  It may also be distributed to clients of AAM, as well as to other recipients with whom no such client relationship exists.  Providing this information does not, in and of itself, constitute a recommendation by AAM, nor does it imply that the purchase or sale of any security is suitable for the recipient.

  • « Go to Previous Page
  • Page 1
  • Interim pages omitted …
  • Page 12
  • Page 13
  • Page 14
  • Page 15
  • Page 16
  • Page 17
  • Go to Next Page »

Get updates in your inbox.

  • Investment Strategies
    • Investment Grade Fixed Income
    • Specialty Asset Classes
  • Our Clients
    • Client Experience
    • Sample RFP Download
  • Insights
    • Video
    • Webinar
    • News
    • Podcasts
  • About
    • Our Team
    • Contact
    • Client Login

Disclaimer: Asset Allocation & Management Company, LLC (AAM) is an investment adviser registered with the Securities and Exchange Commission, specializing in fixed-income asset management services for insurance companies. Registration does not imply a certain level of skill or training. This information was developed using publicly available information, internally developed data and outside sources believed to be reliable. While all reasonable care has been taken to ensure that the facts stated and the opinions given are accurate, complete and reasonable, liability is expressly disclaimed by AAM and any affiliates (collectively known as “AAM”), and their representative officers and employees. This report has been prepared for informational purposes only and does not purport to represent a complete analysis of any security, company or industry discussed. Any opinions and/or recommendations expressed are subject to change without notice and should be considered only as part of a diversified portfolio. A complete list of investment recommendations made during the past year is available upon request. Past performance is not an indication of future returns. This information is distributed to recipients including AAM, any of which may have acted on the basis of the information, or may have an ownership interest in securities to which the information relates. It may also be distributed to clients of AAM, as well as to other recipients with whom no such client relationship exists. Providing this information does not, in and of itself, constitute a recommendation by AAM, nor does it imply that the purchase or sale of any security is suitable for the recipient. Investing in the bond market is subject to certain risks including market, interest-rate, issuer, credit, inflation, liquidity, valuation, volatility, prepayment and extension. No part of this material may be reproduced in any form, or referred to in any other publication, without express written permission. *All figures shown are approximate and subject to change from quarter to quarter. **The accolades and awards highlighted herein are not statements of any advisory client and do not describe any experience with or endorsement of AAM as an investment adviser by any such client.
Copyright © 2024 AAM | Privacy and Disclosures

  • LinkedIn
  • YouTube