• Skip to primary navigation
  • Skip to main content
  • Skip to footer
AAM CompanyTransparent Logo

AAM Company

AAM Company Website

  • Investment Strategies
    • Investment Grade Fixed Income
    • Specialty Asset Classes
  • Clients
    • Our Clients
    • Client Experience
    • Download Sample RFP
  • Insights
    • Video
    • Webinars
    • Podcasts
    • News
  • About
    • Our Team
    • Events
  • Login
  • Contact Us
Contact

Corporate Credit

December 2, 2009 by

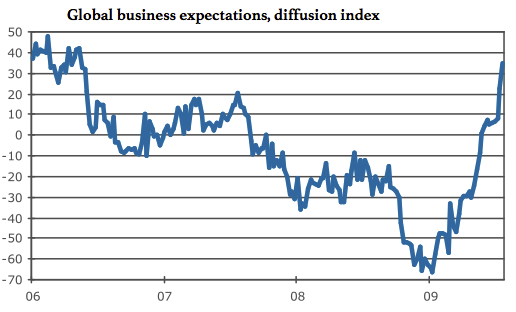
After a long run of positive excess returns, the Corporate Index posted a modestly negative month of excess returns in November, -8 bps (basis points) per Barclays. This was mainly due to the poor performance of hybrids, specifically relating to banks that received state aid in Europe. Excluding hybrids, the Index would have posted +4 bps. The OAS of the Index closed the month at 207 bps, 189 bps excluding hybrids.

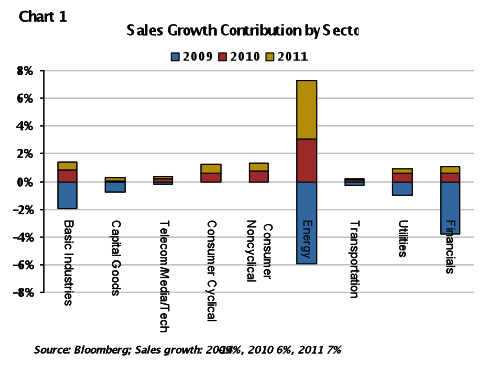
Economic data was once again the focus for investors, and one topic in particular that garnered attention was the small business sector of the U.S.. There are a couple of often used measurements for the health and sentiment of this sector. First, is the quarterly Business Employment Dynamics (BED) survey from the Bureau of Labor Statistics, which reports job creation and destruction by firm size albeit at a considerable (8-month) lag. The data collection started in 1992 and shows that approximately one-third of the job growth since that period was due to the small business sector. However, in the initial stage of economic recoveries, the percentage is larger. Thus far, the BED survey is not signaling a proportionally higher retrenchment in jobs in the small business sector vs. medium and large, but again, the survey is dated.

A more forward looking measure of small business sentiment is the NFIB optimism survey, which has collected data since 1973. The recent data continues to show improvement after a low of 81 posted in March 2009 (Note: The lowest reading for the Index was 80.1 in April 1980), but absolute sentiment and conditions remain very weak. The last number reported on November 10 for October 31, 2009 was 89.1. There are many interesting points to highlight. Notably, in the 1980-1982 recession, the Index was below 90 for one quarter. In this recession, its been below 90 for six quarters. Moreover, levels below 90 were also seen in 1974 when Treasury yields were 7-8% and rising, the Bank Prime loan rate ranged from 9-12%, and BBB Corporate bond yields were 10+%.[1]

Many point to the inability to obtain credit as the reason for small business struggles, although the data does not necessarily point to it as the primary reason. The Federal Reserve’s senior loan officer survey shows an improvement in tightening standards for commercial and industrial loans (C&I) for small firms, although very few banks eased standards.   The NFIB survey also reported that 29% of small businesses reported all of their borrowing needs met (for reference, 36% reported the same in 2006-2007) vs. 9% who reported problems obtaining desired financing (6-7% in 2006-2007). And, a modest 4% said that financing and interest rates were their “most important problem” as opposed to 33% that cited poor sales, 22% taxes, and 11% government regulations and red tape. As one would expect, interest rates were a much bigger factor pre-1990 when 10-35+% of respondents reported this as their main issue. This compares to “poor sales” as a main issue, which was never this high. We are not saying that tight credit conditions are not one of many problems plaguing small businesses, but it is not the main problem or problems for that matter. The lack of demand for credit is more likely due to the record low levels of capital spending (current and expected), decreasing inventory stocks and prices and thus, sales and profits.

Lastly, what does all of this mean for unemployment and GDP? The current NFIB data shows that a seasonally adjusted net-negative one percent of owners plan to create new jobs. We did a simple regression, using the NFIB data, quarterly change in U.S. real GDP, U.S. initial jobless claims, and U.S. unemployment. What we found is although the NFIB data is a very good leading indicator and therefore, statistically significant for each variable, it is not a good predictor of the ultimate value due to the lack of explanatory power. The R-squared in each regression never exceeded 35% despite adjusting for time lags, etc. As Exhibit 1 shows, the time lag between the trough of the NFIB Index and the peak of unemployment in recessionary periods ranges from three years to less than one.

Exhibit 1: Small Business Optimism and Unemployment
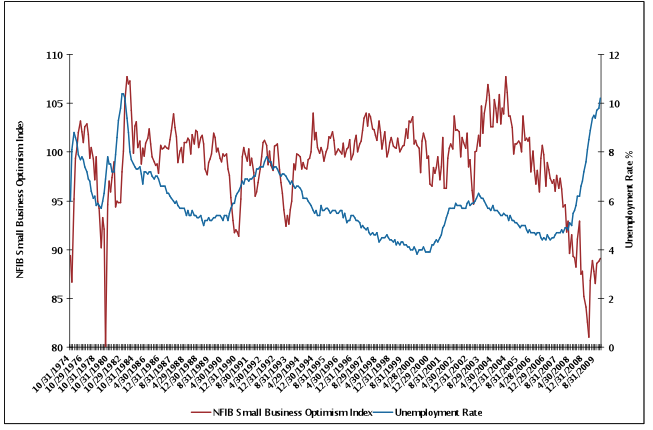
Source: Bloomberg

The conclusion we draw is that the availability of credit alone will not fix the small business problem nor should it. We continue to believe that U.S. consumers and businesses have seen the abyss and do not want to return. This means savings rates will remain higher and businesses more liquid and conservative. This should support a reduction in capacity and therefore, consolidation, a near term negative for job creation. What does this mean for the Corporate Bond market? We believe it supports Investment Grade spreads in general, as large businesses get stronger and investors consider it an attractive investment relative to more risky assets that are more exposed to lower tier, weaker firms and have rallied considerably this year.

This information is developed using publicly available information, internally developed data and outside sources believed to be reliable.  While all reasonable care has been taken to ensure that the facts stated and the opinions given are accurate, complete and reasonable, liability is expressly disclaimed by AAM and any affiliates (collectively known as ‘AAM’), and their respective officers and employees.  Any opinions and/or recommendations expressed are subject to change without notice.

This information is distributed to recipients including AAM, any of which may have acted on the basis of the information, or may have an ownership interest in securities to which the information relates.  It may also be distributed to clients of AAM, as well as to other recipients with whom no such client relationship exists.  Providing this information does not, in and of itself, constitute a recommendation by AAM, nor does it imply that the purchase or sale of any security is suitable for the recipient.

[1] Federal Reserve – https://www.federalreserve.gov/releases/h15/data.htm

November 2, 2009 by

The demand for Corporate bonds, especially those with wider spreads, continues. The excess return for October (Barclays Corporate Bond Index – “Index”) was 89 basis points (bps) or 73 bps, excluding hybrids. Finance outperformed Utilities and Industrials, posting 162 bps of return vs. 56 bps and 47 bps respectively. The OAS was 206 bps at month-end compared to 555 bps at year-end 2008. Over the last 20 years, the low point (OAS) was 51 bps in July 1997, ranging from Utilities at 38 bps to Industrials at 58 bps.   The yield at that time for the Index was 6.61%, very close to the 20 year mean of 6.74%. The yield for the Index at 10/28/09 was 4.78%, exemplifying the very low rate environment that we are in today.

A lot has changed since 1997. The size of the Index measured by the amount outstanding ($)has changed, growing 135% since 1997, while the number of issues has been reduced by 22% since 1997. This reflects the larger, more liquid deals that facilitate trading and hence, lead to more volatility. The participants in the Corporate market have also changed with a greater number of hedge funds and other trading oriented firms looking to Corporate bonds for investment opportunities (Exhibit 1). Oddly, two things have not changed. First, the credit rating of the Index remains A2/A3, and second, the primary sector composition is virtually the same.

Exhibit 1
AAM Corp Credit 11-09 1
Note: Alternative buyers reflect the percent change in asset increase annually; Insurance is as % of the total holders of Corporate and Foreign bonds. Sources: Federal Reserve Flow of Funds, Thomsen Financial Platinum Database, ABS Alert Van Hedge Fund Advisors International, Hedge Fund Intelligence, Bloomberg, Dealogic’s CP Wave, Merrill Lynch Survey.

Change and specifically, volatility become evident if one splits the last 20 years into decades. Table 1 shows the volatility of Corporate spreads over a 20 year period. Simply, the last 10 years have been less rewarding for bondholders than the prior 10.   The annualized total return over the first 10 years for investors in the Index was 8.31% vs. 6.51% over the last 10. And, as you see below, the risk/reward has certainly been less favorable especially for Financials.

TABLE 1 1989-2009 1989-1999 1999-2009
OAS – Mean Corporate 170 84 176
(bps) Industrials 169 93 173
Utilities 173 71 179
Financials 172 90 176
OAS – Std Deviation Corporate 113 23 114
Industrials 89 25 89
Utilities 103 19 103
Financials 156 35 159
OAS/Std Dev Corporate 2 4 2
Industrials 2 4 2
Utilities 2 4 2
Financials 1 3 1

Source: Barclays

Putting the past behind us, the more important question is what can we expect over the next 10 years? Even though spreads have tightened considerably this year, we note that many sectors have not even approached the tights over the last two years let alone the last 10. It is evident from the graph (“Exhibit 2”) below that given the economic and government/fiscal uncertainty, the Corporate bond market continues to demand payment for sectors that are more vulnerable. We believe this higher dispersion around the mean will persist in the near-to-intermediate term or at least until the economy begins to improve organically.

Exhibit 2 AAM Corp Credit 11-09 2

The message rings clear to us. Spread volatility has increased and with default risk expected to remain high over a longer time period[note]Bank of America Merrill Lynch “From Matterhorn to Matanuska” 9/16/2009 – Predictions include: twin default peaks in late 2009and a lower peak in late 2012, a slower rate of improvement from the peak in 2012, cumulative defaults reaching 40% vs. 30% in previous cycles, and a slower return to below average default rates, specifically taking 7-8 years to fully play out vs. the 5-year normal cycle duration.[/note], credit selection is critical. We continue to believe investing defensively and not solely reaching for the highest yielding asset today is critical in this environment for both total return and principal and interest preservation. In 2010, we believe there will be periods of spread widening given our expectation for muted GDP growth, as the government stimulus wanes. Consequently, we generally favor sectors that will benefit from demand overseas, government support, and inventory restocking while avoiding those that are susceptible to event risk or heavily dependent on housing, commercial real estate and/or discretionary consumer spending.


This information is developed using publicly available information, internally developed data and outside sources believed to be reliable.  While all reasonable care has been taken to ensure that the facts stated and the opinions given are accurate, complete and reasonable, liability is expressly disclaimed by AAM and any affiliates (collectively known as ‘AAM’), and their respective officers and employees.  Any opinions and/or recommendations expressed are subject to change without notice.

This information is distributed to recipients including AAM, any of which may have acted on the basis of the information, or may have an ownership interest in securities to which the information relates.  It may also be distributed to clients of AAM, as well as to other recipients with whom no such client relationship exists.  Providing this information does not, in and of itself, constitute a recommendation by AAM, nor does it imply that the purchase or sale of any security is suitable for the recipient.

October 1, 2009 by

The corporate bond market posted another positive month of excess returns (79 basis points for Barclays Corporate Bond Index). Spread tightening continues in all broad sectors with Finance outperforming, as compression continues between Finance and Utilities/Industrials (Exhibit 1). However, like the equity market, the corporate market has softened recently, as the economic data has been weaker than expected and headlines about unemployment, foreclosures, and budget deficits persist, reminding all of us that a strong recovery is not a “sure thing.” Unlike the consensus of a “V” shaped recovery, we continue to position portfolios for a “U” shaped recovery. We remain concerned with the consumer, housing (both commercial and residential), the government’s role (i.e., exit strategy), and the strength of a recovery on the back of businesses that face more stringent regulation and the prospect for higher taxes, direct and indirect.

Exhibit 1

AAM Corp Credit 10-09 2

Source: Barclays Capital Market Analytics

Business investment, not consumer spending, has been cited as the source for near term GDP growth not only for the U.S., but for many other countries as well. Economists focus on the inventory drawdown or “output gap” that exists and the positive effects the inventory re-build will have on GDP growth and inflation. We also look to other sources of business investment, mergers and acquisitions (M&A) and capital spending, and note the very low levels at which they are at today and the cash that is available (Exhibit 2). A “U” shaped recovery lends itself to M&A, as companies need to consolidate to accelerate growth. Therefore, we believe this will increase, especially in low/no growth industries such as Finance, Telecommunications, Media, and Consumer Products. Capital spending is more difficult to forecast given management’s reluctance to invest in a weak global economy. We expect industries that are commodities based, like Energy and Metals and Mining, to increase capital spending given the demand from Asia and other higher growth countries.

We anticipate less investment being made in special dividends and share repurchases due to the competing investment opportunities that exist, as more companies are looking to sell or shed assets and at the same time, acquisition multiples are lower and financing is still relatively cheap.

Exhibit 2

AAM Corp Credit 10-09 1

This outlook keeps us positive on business led growth, which should help temper the negative drag from the consumer and withdrawal of government spending. However, recognizing the importance of both the consumer and government in this recovery, it also keeps us defensive and highly selective with credits and industries.

This information is developed using publicly available information, internally developed data and outside sources believed to be reliable.  While all reasonable care has been taken to ensure that the facts stated and the opinions given are accurate, complete and reasonable, liability is expressly disclaimed by AAM and any affiliates (collectively known as ‘AAM’), and their respective officers and employees.  Any opinions and/or recommendations expressed are subject to change without notice.

This information is distributed to recipients including AAM, any of which may have acted on the basis of the information, or may have an ownership interest in securities to which the information relates.  It may also be distributed to clients of AAM, as well as to other recipients with whom no such client relationship exists.  Providing this information does not, in and of itself, constitute a recommendation by AAM, nor does it imply that the purchase or sale of any security is suitable for the recipient.

September 1, 2009 by

Second quarter earnings season is coming to a close with over 90% of firms having reported results. Overall, the quarter was better than expected from an earnings standpoint while sales came in within expectations. As Table 1 reflects, Health Care, Financials and Technology reported better than expected sales and earnings growth while sales growth was slower than expected in other sectors that lag in a recession.

Table 1
Positive Surprise/ Negative Surprise (x) Sales Earnings
All Securities 1.0 2.0
Utilities 0.4 1.9
Materials 0.4 1.7
Industrials 0.4 1.9
Consumer Staples 0.6 3.2
Telecom Services 0.6 2.2
Energy 0.6 1.2
Consumer Discretionary 0.8 2.2
Health Care 1.4 2.3
Financials 1.9 1.7
Information Technology 1.9 2.9
Source: Bloomberg

We expect sales growth to improve next year, as the domestic economy benefits from the Federal stimulus, business investment, and overseas demand and growth (namely Asia and Brazil). Firms will benefit from the operating leverage when sales return, driving earnings growth. This is consistent with a more traditional recession and recovery (i.e., “business led” where inventories are found to be bloated and then worked down).   Based on the U.S. government’s actions thus far, we believe the transition to the consumer will be gradual but this certainly is a risk considering the mounting deficit.

As reflected in the charts on the following page, it is evident that growth stems from the improvement in the Financial sector and cyclical sectors, namely Energy and Metals. While AAM’s sales and earnings estimates are slightly lower than the equity analyst estimates aggregated on Bloomberg (especially for banks and REITs), we remain constructive on Investment Grade Corporate bonds because we understand that spreads will remain firm and/or tighten in an environment of low growth. The key for fixed income investors is measuring downside risk – rating risk and default risk at the extreme. Earlier this year, that was very difficult given the government and economic related uncertainties, causing many analysts to assume the worst. Today, after benefiting from government related programs and actions, we are in a position to dismiss the worst case (depression, bank nationalization) and look forward. We believe consolidation will be critical in all sectors, as consumer leverage will not return and drive the growth it once did. Therefore, we remain committed to investing in companies that are market leaders and sectors like Energy that will benefit from the resumption of global growth.

AAM Corp Credit 9-09 1

August was another positive month for excess returns (76 bps) with the Barclays Corporate Index OAS tightening 16 basis points. We do not expect issuance to be as strong in the second half of 2009, and new issue concessions have reverted to nominal amounts. For the remainder of the year, we expect excess returns to be driven by spread compression (e.g., Financials remain wide relative to Industrials) and carry more so than wholesale spread tightening. We remain constructive on the market and continue to believe that being overweight the benchmark Index, taking a very selective approach to credit and industry selection is the right strategy for outperformance.

AAM Corp Credit 9-09 2

This information is developed using publicly available information, internally developed data and outside sources believed to be reliable.  While all reasonable care has been taken to ensure that the facts stated and the opinions given are accurate, complete and reasonable, liability is expressly disclaimed by AAM and any affiliates (collectively known as ‘AAM’), and their respective officers and employees.  Any opinions and/or recommendations expressed are subject to change without notice.

This information is distributed to recipients including AAM, any of which may have acted on the basis of the information, or may have an ownership interest in securities to which the information relates.  It may also be distributed to clients of AAM, as well as to other recipients with whom no such client relationship exists.  Providing this information does not, in and of itself, constitute a recommendation by AAM, nor does it imply that the purchase or sale of any security is suitable for the recipient.

August 3, 2009 by

Given current earnings and economic news, it is now more difficult to argue that we have not hit bottom. We believe the recovery is in its early phase, and the technical support to the Corporate bond market is unabated. We have been advocating an overweight to Corporate Credit since late 2008, and continue to believe spreads will grind tighter. The excess returns over Treasuries for the Barclay’s Corporate Credit Index were 3.84% for July and 17.37% year-to-date.

In last month’s letter,  we cited three areas we would be watching in the near term, two of which were the trajectory and magnitude of losses at the banks relative to expectations. The majority of the large domestic banks have reported second quarter earnings. The main take-away from the quarter is that while results were very weak, they were not weaker than expected. In fact, the percentage of “earnings surprises” continues to creep higher since the low point in the 4Q’08 (Exhibit 1). Historically, asset quality deterioration at the banks tends to persist for two quarters after unemployment peaks. Consequently, we expect asset quality deterioration to continue well into 2010, and loan loss provisioning to remain at elevated levels into the foreseeable future. Earnings performance will be weak commensurate with reserve builds, and “noisy” quarters will be the norm rather than the exception going into the first half of 2010. Further regulatory interventions should not be surprising for small banks and even certain regional banks.

Exhibit 1
AAM Corp Credit 8-09 1

Importantly, as bad as this sounds, this is what the market (and AAM) is expecting. CIT was a recent test, as the deterioration has been contained, keeping the risk idiosyncratic instead of systemic. We expect this cleansing process to take place in all industries to various degrees. In Moody’s latest default report (7/8/09), the global speculative-grade default rate was at 10.1% at the end of June. In April, Moody’s had expected this to peak at 14.8% in the fourth quarter this year. This peak estimate has been revised down over the last two months and is now expected to be 12.8%. The twelve month forward estimate has also been reduced from over 10% to 6%.

As you see in Exhibit 2, since 1973, spreads typically peak a year prior to defaults peaking, and the relationship is statistically significant. This is intuitive since investors need to measure risk in order to assign return expectations. Despite soft fundamentals, we expect spreads to continue to tighten, as uncertainties moderate surrounding rating downgrades and ultimately defaults. We continue to favor high quality credits especially certain high quality Financial senior bonds (e.g., GE, Barclays), which are 50-100 bps wide of Industrial/Utility equivalents.

Exhibit 2
AAM Corp Credit 8-09 2
Source: AAM, Moody’s, Barclays

AAM refers to Asset Allocation & Management Company, LLC, an SEC registered investment advisor specializing in insurance investment management. This information is developed using publicly available information, internally developed data and outside sources believed to be reliable.  While all reasonable care has been taken to ensure that the facts stated and the opinions given are accurate, complete and reasonable, liability is expressly disclaimed by AAM and any affiliates (collectively known as ‘AAM’), and their respective officers and employees.  Any opinions and/or recommendations expressed are subject to change without notice.

 This information is distributed to recipients including AAM , any of which may have acted on the basis of the information, or may have an ownership interest in securities to which the information relates.  It may also be distributed to clients of AAM, as well as to other recipients with whom no such client relationship exists.  Providing this information does not, in and of itself, constitute a recommendation by AAM, nor does it imply that the purchase or sale of any security is suitable for the recipient.

July 13, 2009 by

AAM continues to be cautiously optimistic about Corporate bonds. Corporate credit spreads have tightened materially this year, generating 13.49% excess returns year to date as of July 10, 2009. The tightening has been broad based across industries, all benefiting from the improvement in confidence in the financial sector and economy. Except for financials and most deep cyclical industries, spreads have returned to their 3 year average in the intermediate to long end of the curve. New issue concessions have tightened over the year as demand for Corporate bonds, especially those that are higher quality, has increased. Therefore, unlike in 2007-2008 when the technical driver was an exodus from Corporates to safe-haven Treasuries, the technical driver has been positive this year.

AAM Corp Credit 7-09 1

Source: Moody’s Economy.com

We enter the earnings season with spreads over 200 basis points tighter and signs of stabilization from an economic standpoint. Our expectation for unemployment to peak between 10-11% in the first half of next year is consistent with the markets’ and should allow Industrial and Utility companies to maintain their second half forecasts for 2009. Financial firms are expected to report dismal earnings the remainder of the year due to the elevated provision costs as late stage loans such as commercial & industrial and commercial real estate become a bigger problem. We are watching three main areas in the bank sector over the near term: (1) the trajectory and magnitude of loan losses (2) foreclosure mitigation (3) rate of change in loan balances. As long as these track within expectations, bank spreads should remain range bound with technicals possibly placing pressure on them in the latter part of the year as the Fed’s Temporary Liquidity Guarantee Program (TLGP) expires and banks resume funding in the unsecured market.AAM Corp Credit 7-09 2

Since late 2008, AAM has been buying Corporate bonds from issuers that will withstand a period of prolonged single-digit economic growth. We need more than “green shoots” and “stress tests” to get more bullish and invest in the broader financial and deep cyclical sectors. We remain cautiously optimistic as we enter this very important earnings season.

AAM Corp Credit 7-09 3

Source: AAM, FDIC, Federal Reserve
Note: 4Q’09 reflects SCAP stressed case assumptions

AAM refers to Asset Allocation & Management Company, LLC, an SEC registered investment advisor specializing in insurance investment management. This report does not constitute an offer to any person to provide investment management services in any jurisdiction where unlawful or unauthorized. AAM only provides products or services to qualified investors.

  • « Go to Previous Page
  • Page 1
  • Interim pages omitted …
  • Page 14
  • Page 15
  • Page 16
  • Page 17
  • Go to Next Page »

Get updates in your inbox.

  • Investment Strategies
    • Investment Grade Fixed Income
    • Specialty Asset Classes
  • Our Clients
    • Client Experience
    • Sample RFP Download
  • Insights
    • Video
    • Webinar
    • News
    • Podcasts
  • About
    • Our Team
    • Contact
    • Client Login

Disclaimer: Asset Allocation & Management Company, LLC (AAM) is an investment adviser registered with the Securities and Exchange Commission, specializing in fixed-income asset management services for insurance companies. Registration does not imply a certain level of skill or training. This information was developed using publicly available information, internally developed data and outside sources believed to be reliable. While all reasonable care has been taken to ensure that the facts stated and the opinions given are accurate, complete and reasonable, liability is expressly disclaimed by AAM and any affiliates (collectively known as “AAM”), and their representative officers and employees. This report has been prepared for informational purposes only and does not purport to represent a complete analysis of any security, company or industry discussed. Any opinions and/or recommendations expressed are subject to change without notice and should be considered only as part of a diversified portfolio. A complete list of investment recommendations made during the past year is available upon request. Past performance is not an indication of future returns. This information is distributed to recipients including AAM, any of which may have acted on the basis of the information, or may have an ownership interest in securities to which the information relates. It may also be distributed to clients of AAM, as well as to other recipients with whom no such client relationship exists. Providing this information does not, in and of itself, constitute a recommendation by AAM, nor does it imply that the purchase or sale of any security is suitable for the recipient. Investing in the bond market is subject to certain risks including market, interest-rate, issuer, credit, inflation, liquidity, valuation, volatility, prepayment and extension. No part of this material may be reproduced in any form, or referred to in any other publication, without express written permission. *All figures shown are approximate and subject to change from quarter to quarter. **The accolades and awards highlighted herein are not statements of any advisory client and do not describe any experience with or endorsement of AAM as an investment adviser by any such client.

Copyright © 2024 AAM | Privacy and Disclosures

  • LinkedIn
  • YouTube