• Skip to primary navigation
  • Skip to main content
  • Skip to footer
AAM CompanyTransparent Logo

AAM Company

AAM Company Website

  • Investment Strategies
    • Investment Grade Fixed Income
    • Specialty Asset Classes
  • Clients
    • Our Clients
    • Client Experience
    • Download Sample RFP
  • Insights
    • Video
    • Webinars
    • Podcasts
    • News
  • About
    • Our Team
    • Events
  • Login
  • Contact Us
Contact

Corporate Credit

June 14, 2019 by

Summary

The upcoming G20 summit beginning June 28th is a critical date for the investment community. What will happen if there is no trade agreement between the United States and China? Will the Fed lower rates in anticipation of that outcome or if disappointing, in reaction to it? As written in our last quarterly Corporate Credit Review, the bond market seems to have taken a much more negative stance than the equity market on the economy. And, unlike the start of the year when most Wall Street firms had fairly similar outlooks for the year, now they differ on what the Federal Reserve will do and the outcome regarding tariffs on Chinese goods. This type of market provides opportunities. AAM believes the probability of reaching a deal has increased modestly after the quick resolution with Mexico, but that probability is more remote than is a hardened stance. That expectation leads us to take a more defensive position in risk assets, preferring less cyclical sectors and higher quality credits. 

What happened to the deal the markets expected in April?

By May, the markets were pricing in a high likelihood of a deal with China in regards to tariffs. There are a multitude of reasons as to why progress was halted, including the possibility that the U.S. administration was employing a “hard-bargaining” negotiation strategy which meant the likelihood of an agreement was always lower than the market grew to believe. This may have been the strategy with Mexico, although that outcome was much easier to predict given the extreme downside risks. 

We do not believe China can yield to the demands the U.S. is making as it would be politically unpalatable. The breakdown of talks occurred due in part to the U.S. administration’s insistence that Chinese curb subsidies to its state-owned enterprises in strategic sectors, like technology. China finds this unacceptable given its ‘Made in China 2025’ strategy. For China’s economy to continue to grow, its manufacturing has to evolve to higher value added products and services and manufacturing capabilities. The insistence by the U.S. administration that enforcement of the deal would come in the form of changes in China’s laws and oversight mechanisms not just through regulatory changes represented a direct challenge to China’s state control model laid out in the 2025 strategy. And, existing tariffs would not be lifted until enforcement of the trade deal was verified. Political stakes are high, and both leaders feel the need to remain strong in these negotiations. 

Now what?

We look at possible outcomes through a three outcome framework: 

Source: AAM Corporate Credit team with OAS referring to Bloomberg Barclays Corporate Index.

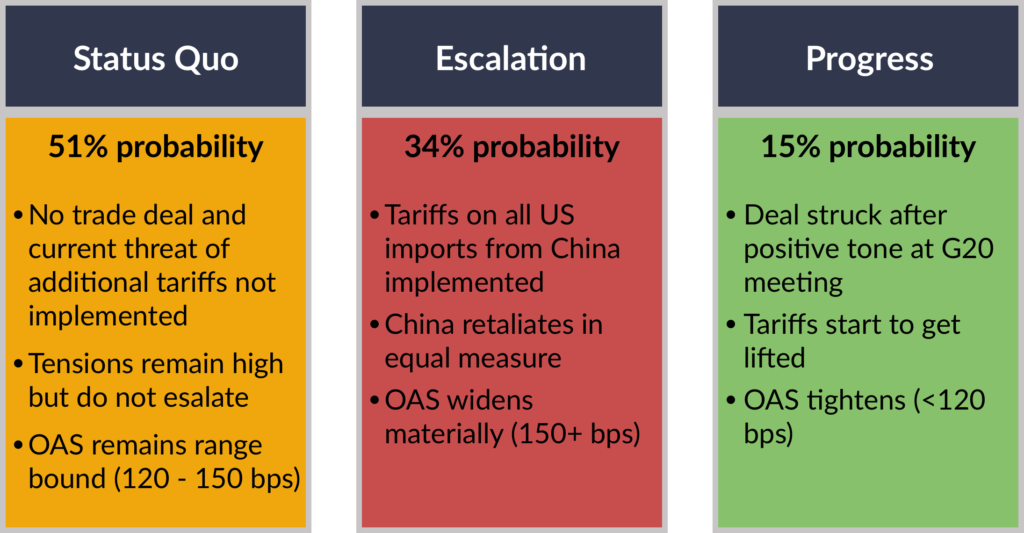
1. The status quo remains for the duration of the year and most likely, until the next U.S. presidential election. 

2. Tensions increase with both countries increasing tariffs and imposing other restrictive measures. The temporary general license issued by the U.S. government suspending the ban against selling equipment and software to Huawei is not extended. 

3. Significant progress is made during the G20 summit followed by a trade deal that works to ends hostilities between the two countries and starts to lift at least some of the tariffs. 

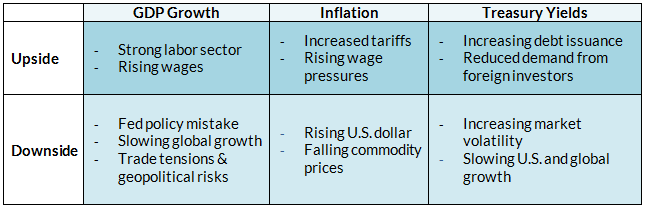
While direct costs seem to be relatively easy to calculate for the current level of tariffs and are relatively modest (e.g., less than 0.3 percentage points off U.S. and China’s growth respectively), the more difficult calculation is related to the uncertainty and loss of confidence by businesses and consumers. If the global economy is in fact oversupplied and is relying on credit growth to absorb this excess supply, a loss of confidence that impacts investment and spending would be particularly threatening to global and U.S. GDP. Therefore, despite tariffs being viewed as inflationary, the impact would over the longer term, be in fact deflationary. An escalation of the “trade war” would be very costly in the form of economic growth and financial costs, resulting in falling Treasury yields and equity markets. We would expect spreads to widen materially as the risk of recession increases. In particular, underperformance is expected from long duration, low BBB credits as well as cyclical and liquid sectors. 

AAM believes the status quo is the most likely outcome in 2019, as the costs related to tariffs are less than the political fallout that would likely occur for US President Trump and China President Xi Jinping if either concedes. Our expectation for a trade deal at the G20 summit getting done or foreshadowed is quite low since getting tough on China is one of few bipartisan issues in the U.S., making it difficult for the current administration to soften its stance unless the risk of recession increases more materially. Moreover, given this stance, we believe it is more likely that threats escalate as China’s President Xi, who faces no term limits, is unable to bend to US demands without facing significant pressure from the Chinese Communist party. Therefore, we are assigning a material probability to that outcome. 

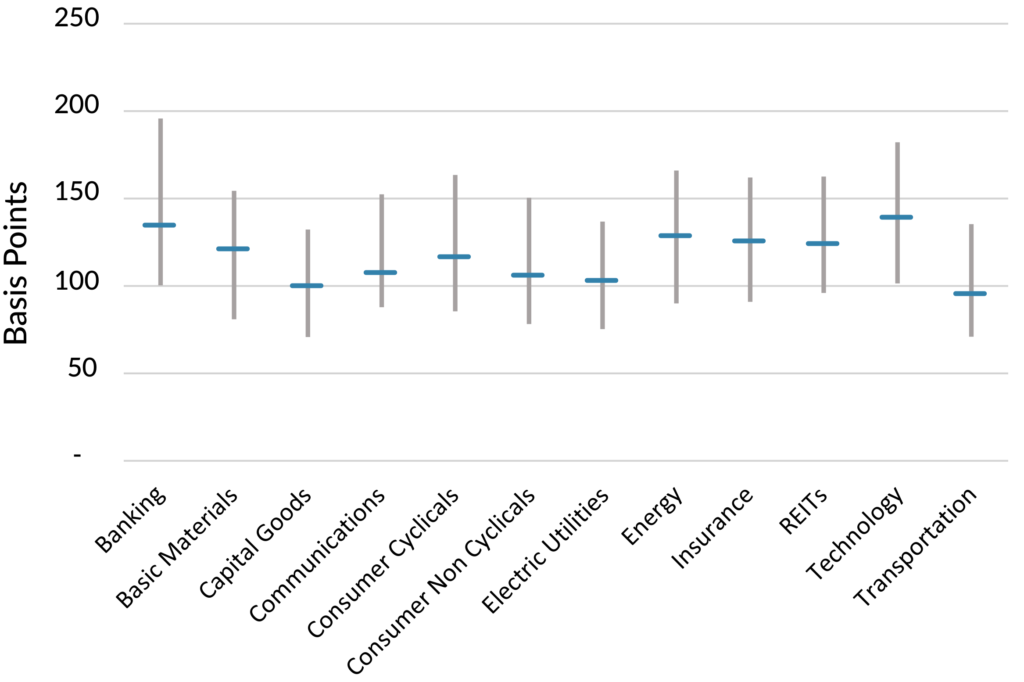
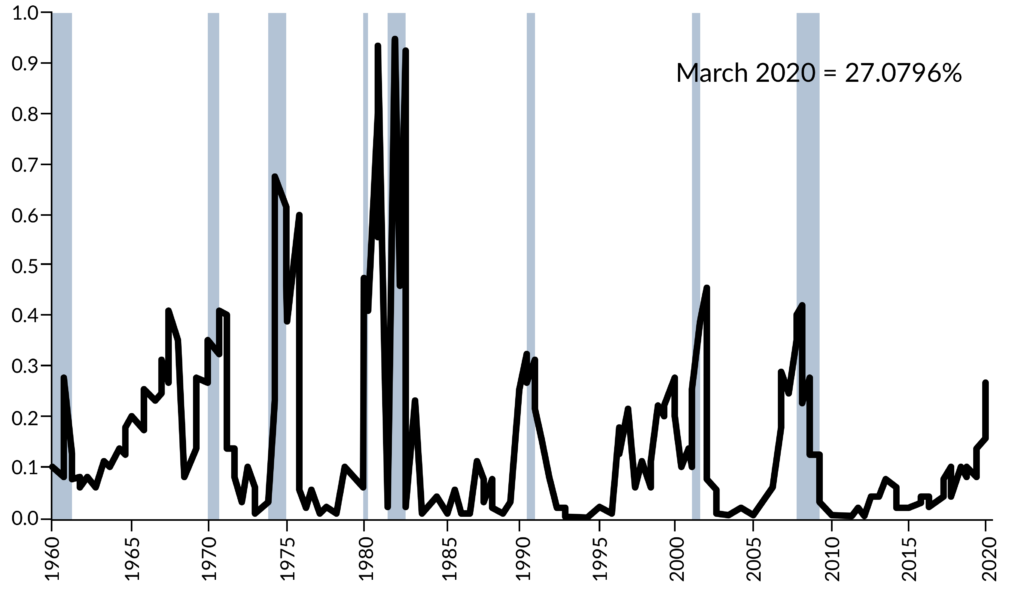
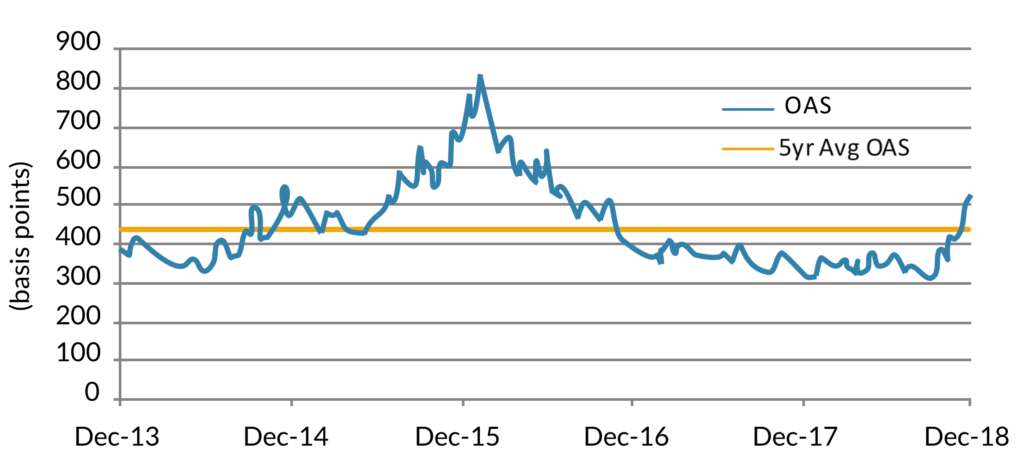
The G20 summit at the end of the month may change these probabilities materially. The candlestick chart shows the IG corporate credit spread volatility that has occurred over just the last two years. Current spreads largely in the mid-points of their trading ranges reflect the uncertainty that exists in the various trade outcomes we have outlined with the potential for near term volatility being quite high. With relatively little dispersion (~40 bps), we prefer more defensive sectors with stable cash flows and exposure to the U.S. economy. In regards to the more cyclical and liquid sectors, we have a more defensive position from a duration and/or credit risk perspective. The Banking sector in particular has been more resilient than we would have expected given falling rates and growth expectations. We view sectors such as Communications as providing less value today given the trajectory of growth, required investments (capital and operating) and lack of financial flexibility.

Current OAS vs. Min/Max Range

Source: AAM, Bloomberg Barclays data from 10/06/2017-6/7/2019; Sector OAS derived using the average of A-/higher and BBB ratings and 10 year maturities; Horizontal bar denotes value as of 6/7/2019 with top and bottom of vertical bar representing max and min values respectively.

May 1, 2019 by

A glimpse at investment manager performance results versus the Bloomberg Barclays U.S. Aggregate Index

The simplest way to evaluate an investment manager is to review past performance relative to a stated benchmark. Benchmark outperformance is the gold standard in investment management, but the amount of outperformance can differ greatly depending on manager philosophy and strategy. A blanket statement of outperformance alone cannot verify that one manager is superior to another. The level of outperformance relative to a benchmark is key to determining the top investment manager by performance results. Additionally, a survey of approximately 124 investment firms conducted by Investment Metrics, LLC tells us that a plain vanilla, passive fixed income strategy will produce outperformance over the Bloomberg Barclays U.S. Aggregate Index over a market cycle.

Ten-year data suggests that investment manager performance differs greatly upon active portfolio management strategies. The survey of manager performance, by Investment Metrics, LLC, is ranked by quartile versus the Bloomberg Barclays U.S. Aggregate Index in Exhibit 1. The U.S. Aggregate Index falls in the bottom quartile of managers over the last 3, 5, and 10 year time periods. Last year was the exception when the U.S. Aggregate Index was in the 3rd quartile after volatility returned to the markets and a flight to quality was observed. Both sector allocation decisions and yield enhancements play a major role in the variability of quartile outperformance versus the U.S. Aggregate Index.

Exhibit 1: Bloomberg Barclays U.S. Aggregate Returns vs. Peer Group – as of 3/31/2019

Source: eVestment. All rights reserved. Data as of 3/31/2019. Returns are gross of fees.
AAM Core Bond Composite includes 8 portfolios and $2,422 million in AUM.
Peer group based on IM U.S Broad Market Core Fixed Income (SA + CF) which includes 200 firms and 273 products.

The advantage of active sector selection and rotation

As presented in Exhibit 2, the Bloomberg Barclays U.S. Aggregate Index is inadequately diversified by investment grade sectors with U.S. Treasuries, MBS Passthroughs, and Investment Grade Corporate Bonds comprising over 90% of the index. The conservative allocation consists of a 39% weight to U.S. Treasuries, the worst performing fixed income sector over a 10 year period (Exhibit 3). MBS Passthroughs are the second largest allocation in Index (28%) and the third worst performing sector over the same time period. An active investment manager who opted to underweight U.S. Treasuries and MBS Passthroughs and overweight IG Corporate Bonds, Commercial Mortgage Backed Securities and Asset Backed Securities over the 10 year time period handily outperformed the U.S. Aggregate Index. The variability in quartile outperformance in the Investment Metrics, LLC survey can be determined by both the underweight and overweight given to each sector. Conversely, in periods of high volatility exhibited in late 2018, an overweight to U.S. Treasuries produced more favorable investment results than in periods of low volatility, causing the U.S. Aggregate Index to rise into the 3rd quartile over the 1 year period (Exhibit 1). Security selection and active sector rotation within the top performing, higher yielding fixed income sectors further differentiates the top quartile of managers from the bottom.

Exhibit 2: Bloomberg Barclays U.S. Aggregate Sector Allocation

Source: Bloomberg Barclays Live as of 12/31/2018

Exhibit 3: 10 Year Annualized Return

Source: Bloomberg Barclays Live as of 12/31/2018

Since the U.S. Aggregate Index falls in the bottom quartile of managers, a manager claiming outperformance versus the Index can fall in a range of the bottom quartile to the top quartile. Retaining a bottom quartile performance manager versus a top quartile manager will cost an investor on average approximately 200bps of annualized total return over a 10 year period, or roughly $2 million annually for a $100 million fixed income portfolio (Exhibit 4). The cumulative difference is more staggering at $21 million for the same $100 million portfolio over the 10 year period. The primary determinants of top quartile performance depends immensely on investment manager philosophy, active sector rotation, security selection, and duration management.

Exhibit 4: Bloomberg Barclays U.S. Aggregate Returns vs. Peer Group Averages

Source: Investment Metrics, LLC. All rights reserved. As of 12/31/2018.
Dollar difference calculated using $100 million portfolio market value.

At AAM, we recognize that insurance portfolios require a yield orientation within a risk-controlled framework that minimizes credit impairments and delivers a competitive total return over a market cycle. We seek to add value by identifying the best risk adjusted sectors and securities across the yield curve. Duration management is a key component of the investment process and portfolios are managed to a target duration as determined by the benchmark or the duration of liabilities. Implementing the strategy successfully results in proven competitive total returns over time as demonstrated in AAM’s top quartile performance relative to the peer group over the last 1, 3, 5, and 10 year periods (Exhibit 1). AAM’s Core Bond Composite is made up of 9 insurance client portfolios with assets totaling $2.4 billion, benchmarked to the Bloomberg Barclays U.S. Aggregate Index.

Investing for insurance companies is AAM’s sole organizational focus and our competitive advantage is our emphasis in utilizing a portfolio management and research team that is highly experienced and focused on avoiding negative credit events. The firm’s team of senior managers averages 28 years of investment industry experience, with the portfolio management team averaging 22 years of investment industry experience. Additionally, AAM’s size allows us to take advantage of market opportunities and find creative ways to add income to insurance portfolios. Many of these opportunities are too small to be considered by larger competitors; examples include certain Taxable Municipal Bonds, Community Bank Debt, Private Placements, and various niches within the Asset Backed, Commercial Mortgage Backed, Non-Agency and Residential Mortgage markets. Our nimble size also allows us to trade freely within sectors without impacting markets or individual credits.

Yield advantages will produce superior performance results

Using a yield orientation by identifying the best risk adjusted sectors and securities across the yield curve will result in an income advantage over the U.S. Aggregate Index and lead to greater total returns over time. Total return is defined as the sum of price return and income return, or fluctuations in market value and earned income on the underlying security. For example, the U.S. Treasury sector produced a yield of 2.6% as of year-end 2018, relative to the IG Corporate sector that produced a yield of 4.2% over the same period (Exhibit 5). If IG Corporate Bonds receive a 100% allocation versus U.S. Treasuries at 100%, the 1.6% yield differential will result in $1.6 million of additional income for a $100 million portfolio. Compounded income over time will lead to improved total return in the long run. When comparing multiple investment managers, the highest yielding manager will always have the best performance.

Exhibit 5: Yield to Worst for Taxable Sectors as of 12/31/2018

Source: Bloomberg Barclays Live as of 12/31/2018

The results of the Investment Metrics, LLC survey display that a mediocre manager can easily outperform the U.S. Aggregate Index. Investment manager outperformance cannot simply be measured on a stand alone basis and does not guarantee that an investor will experience the best investment results. The difference in top quartile and bottom quartile manager performance should always be analyzed. Investment philosophy and strategy will largely determine how an investment manager performs relative to an index and its peers. A portfolio better diversified by investment grade sectors compared to the U.S. Aggregate Index, coupled with a yield enhancement will beat the Index over the long run. A top tier performance manager will always have the largest yield advantage. The difference in selecting a passive manager versus an active manager could cost an investor thousands, or even millions of dollars year over year.

April 30, 2019 by

In the investment industry, there is a widely-held view that a Core Fixed Income strategy is a commodity. The belief is that there are variations among managers and styles of course, but over time those distinctions will offset, and there will ultimately be an immaterial difference in returns. Further, with yields across the investment grade universe near historic lows, the distribution of returns across managers should be even less substantial on a relative basis.

Removing the noise

The question necessarily becomes, is there evidence to support this belief? Or are there in fact significant differences in returns over longer periods of time? If there are, the costs of assuming homogeneity could be more significant than investors realize. We wanted to explore this concept further, but to do so objectively, it was essential to level the playing field by eliminating as much noise in the data as possible. Return differences between core managers can most often be explained by two factors: managing to either different benchmarks or duration targets, and/or a measurable allocation to “non-core” or below investment grade securities.

With these factors in mind, we evaluated a universe of institutional core managers with the most comparable objectives and characteristics we could find. The Core managers in this peer group all list the Bloomberg Barclays Aggregate Index as their primary benchmark, share a common duration range, and have an inconsequential allocation to “non-core” bond sectors such as High Yield, Emerging Markets, or non-US dollar assets. Finally, all return statistics for these managers were viewed gross of fees to further eliminate any nuances caused by variations in expenses. In other words, we constructed the most “commoditized” group of US institutional core managers possible. In Exhibit 1 we show the distribution of historical returns for the US Core peer group over the last 10 years. Even over the longest time interval (10 years) the average annualized return difference between the 5th and 95th percentile manager is substantial at 2.42%. In economic terms, that return differential has an impact on investors of $24.2 million a year for every $1 billion in assets. Even the difference between the median core manager and one that performs in the top quartile is significant at 0.65% on average or $6.5 million each year by the same measure (Exhibit 2).

Institutional investors are rightfully mindful of paying reasonable fees to Core managers. Hiring decisions for a new manager in a competitive process are sometimes made with the difference of basis points in management fees being a critical input to who is selected. Comparatively, every 1 basis point (0.01%) in savings for the same $1 billion in assets costs $100,000 less a year. That’s a prudent input for an investor to analyze, but can pale in comparison to the costs of a manager that doesn’t produce competitive returns.

Exhibit 1: US Core Fixed Income Distribution of Returns

Source: Investment Metrics, LLC IM US Broad Market Core Fixed Income (SA+CF) which includes 122 firms and 161 products. Data as of 12/31/2018 and returns greater than 1 year are annualized. 

Exhibit 2: US Core Fixed Income Distribution of Returns – Investor Impact

Source: Investment Metrics, LLC IM US Broad Market Core Fixed Income (SA+CF) which includes 122 firms and 161 products. Data as of 12/31/2018 and returns greater than 1 year are annualized. *Investor Impact – Returns is the difference in annualized returns between Core managers in the 5th and 95t percentile for $1B in assets Fees are the cost of every 1 basis point for $1B. 

Exploring the differences

So if performance does in fact affect returns for investors, what is driving the differences in a low interest environment? When you dissect the core universe by asset size, there is a consistent pattern of excess returns relative the benchmark as measured by Alpha. Exhibit 3 shows a heat map of the average Alpha generated by core managers within each core assets category. The colors move gradually from dark green representing the highest (and therefore best) Alpha to dark red representing the lowest. Noticeably, the mid-size managers with core assets ranging form $1 billion-$50 billion exhibited consistently superior performance over all periods longer than 1 year, while both the largest and smallest managers were consistently the worst performers over longer periods of time.

Exhibit 3: Alpha

Source: Investment Metrics US Broad Market Core Fixed Income Separate Accounts and Common Funds Universe. Average Annual Data as of 12/31/2018. US Core Managers benchmarked to the Bloomberg Barclays Aggregate Index. Excludes those with 2% or more in Emerging Markets, High Yield, or Bank Loans, Non-Dollar. Alpha is the measure of the difference between the portfolio’s actual return versus its expected performance given its level of risk as measured by beta. It is a measure of the portfolio’s performance not explained by the movements of the market.

One way to analyze this underperformance is to explore the average sector allocation along the same size segments we examined above. In Exhibit 4, the table highlights that larger managers had hefty allocations to liquidity sectors such as US Treasury and Agencies and the lowest allocation to credit related sectors that traditionally offer more yield. Green indicates the highest average allocation in the peer group while red indicates the lowest. We can see that the $50 billion and over category had the lowest allocation to credit sectors and the most benchmark-like sector allocations overall. This helps explain why the largest managers appear to have the most difficulty delivering excess returns as their positioning closely aligns them with the benchmark itself. For the smaller managers who underperformed, sector allocation alone does not offer a clear explanation. However, a likely consideration is they lack the resources or scale to allow full access to bond dealer offerings.

Exhibit 4: Investment Grade Sector Allocation

Source: Average Sector Allocation per Core Strategy Assets. Investment Metrics US Broad Market Core Fixed Income(SA+CF) Universe, Bloomberg Barclays data as of 12/31/2018. Core Managers benchmarked to the Bloomberg Barclays Aggregate Index. Excludes those with 2% or more in Emerging Markets, High Yield, Bank Loans, Non Dollar.

Identification versus execution

It stands to reason that the largest managers have more difficulty allocating to credit sectors simply because these sectors make up a much smaller portion of the investment grade universe. And even if you successfully allocate to these sectors, it is even more challenging to accumulate an overweight position in a particular bond that offers good value. To illustrate this point, Exhibit 5 shows the percentage of the US Investment Grade issuers that are large enough for a manager to accumulate a 0.5% position, again segmented by manager asset size. We highlight 0.5% because it represents the largest corporate holding in the Bloomberg Barclays US Aggregate Index. So by default, a 0.5% represents an overweight position relative to the benchmark for any other holding. In other words, if a manager buys a 0.5% position in a bond and it performs well, your portfolio outperforms the benchmark because you own a larger position.

As you can see in the chart below, the corporate issuers a manager can overweight shrinks dramatically for managers with assets above $50 billion. Less than half of the index is eligible at $50 billion and only 25% of issuers are large enough at $100 billion. This indicates that implementing trade ideas becomes increasingly difficult for strategies above $50 billion given the limited supply of corporate issuers that are large enough to buy a meaningful position. These managers have the ability to purchase the issues of course, but it is much more difficult to accumulate more than the benchmark’s position size, making it challenging to outperform.

Exhibit 5: Percent of Corporate Market Managers can Overweight (0.5% position)

Source: US Corporate Market is Bloomberg Barclays US Corporate Index US Issuers as of 2/28/2019. *As of 2/28/2019 JPM is the largest US Corporate issuer representing 0.5% of the Bloomberg Barclays US Aggregate Index. Assumes the manager is capped at owning 10% of all of the issuers index eligible debt.

While this example addresses issues related to purchasing bonds, it also pertains to the potential difficulties these same firms encounter when trying to sell large positions whenever credit or valuation concerns arise. The ability to trade large bond positions has declined significantly as bond dealer corporate inventories continue to fall as a regulatory consequence of the financial crisis. At the same time, investment grade debt outstanding has ballooned to all time highs. Put together, because dealers have less capital to make markets buying and selling bonds from their customers, trading volumes in larger sizes have contracted. For example, only 13% of the trades that occurred for the 10 largest bonds in the index were $5 million or greater over recent periods. To put that in perspective, $5 million represents a 0.50% position for a $1 billion portfolio.

Exhibit 6: Investment Grade Debt Outstanding

Source: Morgan Stanley, SIFMA, S&P LCD. Data as of 4/1/2019.

Exhibit 7: Corporate Dealer Inventories

Source: Morgan Stanley Research, Bloomberg, Federal Reserve Bank of New York. Data as of 4/1/2019.

Exhibit 8: Percent of Corporate Trades Based on Size

Source: Bloomberg TRACE data as of 3/14/19. Fixed Coupon IG trades previous 50 days.trades as a % of all trades sized 250,000 par and above.

Conclusion

This analysis has focused on the corporate universe because it is the largest credit related sector. A similar evaluation of the ABS and CMBS sectors would show even less flexibility given the smaller size of these markets. The industry can sometimes assume that larger managers provide superior returns given their size and market influence. However, this analysis demonstrates that size can actually limit the ability to implement relative value views across investment grade sectors or individual credits. Scale and trading limitations can result in portfolios with heavy allocations to Treasury and Agency related securities that are not desirable for income oriented insurance investors.

With this analysis, we have shown the connection between the size of a manager’s assets and their portfolio characteristics, which ultimately is reflected in their investment performance. Managers need scale and resources to successfully navigate the market, but being too large can limit execution of investment ideas. At AAM, our philosophy is that insurance portfolios require a yield-oriented approach within a risk-controlled framework. Our research capabilities and size allow the advantage of gaining meaningful allocations to the credit markets and effectively implementing trade ideas within portfolios. That combination has resulted in a track record of consistently competitive total returns.

Exhibit 9: Annualized Returns

Source: Bloomberg Barclays, AAM. Data as of 12/31/2018.

Exhibit 10: US Core Fixed Income Distribution of Returns

Source: Investment Metrics, LLC. All rights reserved. Data as of 12/31/2018. AAM Core Bond Composite includes 9 portfolios and $2,377 million in AUM. Peer group based on IM U.S Broad Market Core Fixed Income (SA + CF) which includes 124 firms and 160 products. 

April 18, 2019 by

Market summary and outlook

The Investment Grade (IG) Corporate bond market (per Bloomberg Barclays Index) returned to positive territory in the first quarter, delivering a 5% total return, with spreads tightening 34 basis points (bps). The IG market underperformed the S&P Index, which returned 14% and High Yield (per Bloomberg Barclays Index) 7%. Worldwide equity markets are very optimistic, while the Treasury market continues to reflect caution. Which market will prove to be correct?

Risk premiums have fallen this year in the equity and credit markets. Investors expect: (1) the Fed to be more apt to cut rates, (2) a China trade agreement and resumption of growth, driving a second half 2019 earnings recovery and (3) the avoidance of a hard Brexit and/or European recession. The Treasury curve reflects the expectation for lower growth, predicting a 27% probability of a recession next year per the NY Fed (see Exhibit 1).

Corporate spreads have tightened more than we expected for the year. We remain comfortable investing in the sector given improved financial conditions and our outlook for 2%+ GDP growth. However, lackluster valuation and our expectation for heightened volatility and margin pressure causes us to build liquidity and flexibility to add at more attractive levels.

Exhibit 1: Probability of US Recession Predicted by Treasury Spread* – Twelve Months Ahead (month averages)

*Parameters estimated using data from January 1959 to December 2009, recession probabilities predicted using data through March 2019. The parameter estimates are α=0.5333, β=-0.6330.
Source: Bloomberg as of 4/2/2019

Performance summary

The year started with more attractive valuations and a heightened level of concern regarding economic growth (China in particular). Since that time, Chinese economic data has surprised to the upside and trade related tensions have eased. Importantly, the Fed has pivoted to a more dovish position, and US economic data seems to support that view. An outlook for lower yields and economic growth around 2% increased the demand for fixed income. As shown in Exhibit 2, shorter maturities have benefited, and credit curves have steepened.

Exhibit 2: IG Cumulative Flows Across Tenors

Source: EPFR, Goldman Sachs Global Investment Research

The Energy, Communications and Banking sectors outperformed, which we would expect in a high beta rally given the liquidity in these sectors. BBB rated securities also outperformed. The basis between BBB and A-/higher rated non-Financial credits has narrowed modestly but remains around its historic average which is fair. Debt issuance has tracked last year’s pace.

Exhibit 3: Contributors to IG Corporate Excess Returns 1Q2019

Source: Bloomberg Barclays, AAM

Credit market fundamentals

We anxiously enter the first quarter reporting season, expecting weak first quarter results to be outweighed by optimistic outlooks. Sectors that were impacted by China trade tensions and/or economic deceleration are expected to rebound sharply in the second half (Materials, Technology). Consumer sectors are also expected to benefit as confidence improves. However, the trajectory of growth has shifted lower and wage pressures are rising. That earnings pressure coupled with low interest rates increases event risk. Companies that have pursued this have been rewarded by equity holders. We expect increased event risk to place more pressure on spreads in the upcoming quarters.

In regards to the expectation for an earnings recession in the first half of 2019, a number of factors are driving this. First, revenue declines are anticipated in sectors like Technology and Energy that are more closely tied to global growth and China in particular. Foreign exchange is a headwind for companies on a revenue and/or cost basis. Lastly, higher wages and labor costs are becoming more problematic. The unemployment gap (difference between actual unemployment rate and long-run natural rate) has been negative since 2017, placing pressure on wage growth. An increasing number of industries are experiencing above-trend wage growth (Morgan Stanley, “Wage Pressures: Risks from Labor Costs Rising,” 04/15,19) and citing labor as their most important problem (NFIB survey). This is an issue as top line growth slows. For fixed income investors, this is especially problematic given the degree of debt leverage at corporations. Despite this, we do not expect material deleveraging this year, and with this margin pressure, leverage may rise. Only those companies that are forced to reduce debt because of their very large capital structures will do so. The cost of debt is simply too low for the majority of companies.

Exhibit 4: Earnings Transcript Mentions of Labor Cost – 4Q2018 Breakdown


Source: Alphasense, Morgan Stanley Research as of 3/31/2019

Liquidity has fallen, with companies maintaining the lowest cash balance relative to debt since 2008. Repatriation was one driver of this, but the trend was not isolated to those companies. This may reflect the confidence companies have in the markets, or the pressure management teams face from activist investors. Debt leverage remained broadly stable in 2018 vs. 2017, as additional debt incurred due to M&A and share repurchases offset the reduction in debt driven by changes in the tax law or industry pressures. In regards to capital spending, we expect very modest growth this year and next. We expect this to largely track economic growth expectations.

February 12, 2019 by

Will auto sales rebound in 2019?

From the floor of the 2019 Chicago Auto Show, AAM Senior Analysts Afrim Ponik and Sebastian Bacchus discuss how China, the US economy, and new technologies will impact auto sales.

January 24, 2019 by

Economic Outlook

Following two strong quarters of economic activity, U.S. real GDP growth for Q4 2018 and for all of 2019 appears to be slowing towards the economy’s long-term trend rate. On a year-over-year basis (q4/q4), real GDP growth is forecasted to slow from a 3.1% pace for 2018 to 2.2% for 2019. Reduced impact from the tax cuts and fiscal stimulus are reasons for the forecasted slowdown. Consumer spending, which increased around 2.8% in 2018, is projected to moderate to 2.4% for 2019. A strong labor market and rising wages should continue to support spending. Also driving the slower growth projection for 2019 is weaker business spending/investment. Recent declines in business sentiment suggest manufacturers and service-sector businesses are becoming less confident with the economic outlook. Additional downside risks to growth include a Fed policy mistake, slowing global growth, trade tensions, and geopolitical risks. We are calling for below-consensus GDP growth in 2019 as we view the risks to growth as skewed to the downside. We do not expect the U.S. economy to fall into a recession in 2019.

The Federal Reserve seems to have become more dovish as downside risks to economic growth have increased. Recent comments from Fed officials suggest they will be more “patient” with future rate hikes, with Fed policy becoming more data dependent. We believe the Fed will be closely monitoring incoming data for signs of increasing inflation (CPI, core PCE), strengthening labor markets (unemployment rate, wages), increases in market based inflation expectations (forward breakeven rates), and increases in survey based measures of inflation (ISM prices paid, consumer inflation expectations). With economic growth slowing and inflation expected to remain near the Fed’s target of 2%, we expect them to increase the Fed Funds target range one time this year, or 25 basis points.

Treasury yields, according to consensus forecasts, are expected to move modestly higher from current levels. The benchmark 10-year Treasury yield is forecasted to end 2019 at 3.15% based on the median forecast among economists. The yield spread between the 10 year and 2 year Treasury notes is expected to remain in a tight range of 20bps. We are calling for the 10 year Treasury yield to end the year modestly higher but below 3%. Exhibit 1 lists our risks to U.S. GDP Growth, Inflation, and Treasury Yields.

Exhibit 1: GDP Growth, Inflation, and Treasury Yield Risks

Source: AAM

Fixed Income

2018 – Going into 2018 we anticipated the Fed to raise the Funds rate, causing the economy to slow and the yield curve to flatten. The Fed raised the Funds rate by 1.0% with the final nail in the coffin coming in December. We saw the economy slowing in Q4 which, when coupled with apparent Fed indifference to the current state of the economy and the market’s gyrations, caused a significant selloff. In December, equities fell, credit spreads widened, and we finished the year with losses and uncertainty across a number of sectors.

2019 – We expect that the Fed will have significantly less impact on the markets in 2019. Recently, they have indicated more of a “wait and see” approach while the market is pricing in zero rate hikes for 2019. Just as investors could only see bad news after the December 19th Fed meeting, it seems that there is nothing but roses since the new year.

Our expectation for interest rates is that the yield curve will not invert, and 10 year Treasury yields will stay below 3.0%. There are number of risks to this benign forecast that include but are not limited to: failed Chinese tariff negotiations, stalling economic growth in Europe, a hard Brexit, or a spike in wage driven inflation.

AAM expects that 2019 will be a positive environment for spread product and equities. However, given the potential impediments to growth, risk assets are NOT attractive enough to aggressively overweight. We recommend that risk allocations be maintained at a conservative level in order to allow flexibility to add should the markets stumble. Once again, we anticipate individual security selection and a focus on risk will prove to be the right call in 2019.

Exhibit 2: 2018 Returns by Asset Class

Source: Bloomberg Barclays Index Series, S&P 500, Barclays Global High Yield Index, VOA0 (Merrill Lynch Convertibles Ex-Mandatory)

Corporate Credit

2018 was a disappointing year for the markets despite record revenue and profit growth. After a period of credit creation in 2016-2017, the unwind of QE programs and higher rates caused a sharp slowdown in credit creation from both the private sector and central banks in 2018. The Investment Grade (IG) market also suffered from idiosyncratic events related to GE, Goldman Sachs, Comcast, PCG and the tobacco companies. The spread to Treasuries for the IG market (OAS) closed the year 60 basis points wider with BBBs and longer maturities underperforming.

Exhibit 3: Global central bank securities purchases, rolling 12 months ($T)

Source: National Central Banks, Citi Research

We expect revenue and EBITDA growth rates to decelerate in 2019 to approximately 5% and 8% respectively on average. Capital spending is also expected to decelerate to 2-3%. Debt leverage for IG companies on aggregate changed very little in 2018, but given the focus on debt by the equity community and rating agencies today, we expect companies with over-leveraged balance sheets to work more proactively to reduce debt leverage in 2019. However we do not expect this to be widespread since: (1) lower growth rates make it more difficult to reduce leverage organically, as the equity market has become accustomed to companies using the majority of their excess cash to repurchase stock, and (2) historically, the C-suite does not get more aggressive with credit improvement unless the cost of debt approaches the cost of equity, which has not yet occurred. Therefore, we believe material fundamental credit improvement will be challenging in 2019, with companies facing uncertain growth outlooks and higher costs (labor, transport, interest, trade).

From a technical or supply/demand perspective, we expect net supply of IG bonds to be down materially in 2019 due to the high level of debt maturing, and gross debt supply to be down modestly. This environment of uncertainty/volatility does not support increased M&A activity, and despite improved economics from year-end 2017 (i.e., the spread between earnings yield and the after tax cost of debt), we would not expect an acceleration of debt financed share repurchase activity. Therefore, net supply should be related to refinancing upcoming maturities and tendering others. We believe the demand for IG debt could be lackluster again in 2019 due to higher short term rates and the shape of the Treasury curve. Therefore, we expect another year of less supportive technicals.  

Valuations have improved with the IG OAS widening to a point at year end 2018 that reflects an approximate 25% probability of a recession, and the spread premium for BBBs vs. A/higher rated securities widening towards its historic average of 88 bps. Our credit cycle signals related to the shape of the Treasury curve and access to funding have weakened but do not flag the end of the credit cycle. However, given our economic outlook which has risks skewed to the downside, we do not consider current spreads to be “attractive.” Therefore, we would recommend maintaining a neutral position vs. a benchmark in the IG credit sector, investing cautiously in the asset class, preferring shorter duration bonds, sectors with stable cash flows through the economic cycle, and credits we consider to be higher quality from a balance sheet perspective. We have a constructive view on the following sectors: Banks, Pharmaceuticals, Midstream, Capital Goods, Food/Beverage, and Insurance. On the contrary, we are concerned with the fundamental performance of: Chemicals, Cable, Autos, Tobacco, Consumer Products, and lower quality Media credits. It is important to stress that security selection is critical at this late stage of the credit cycle.  

Our market and sector outlooks are supported by expectations of: (1) positive albeit lackluster economic growth in the US and EU (2) geopolitical events (i.e., trade talks with China, a hard Brexit, and Italy leaving the EU) remaining at a simmer point (3) Federal Reserve pausing its rate hike cycle.  If growth disappoints, the biggest upside surprise for all markets would be a reversal in the unwind of various QE programs to support and stimulate growth. We are not assigning a material probability to that in the US in 2019, since the labor market is far tighter than it was three years ago with unemployment below the natural rate.        

Structured Products

With the exception of shorter duration Asset Backed Securities (ABS), structured products performed relatively poorly in 2018.  The prospect of slowing domestic growth and dislocations in global trade caused risk assets to underperform less risky Agency and Treasury securities.  We’re cautiously optimistic that structured securities will perform better in 2019, although we do anticipate a fair amount of volatility over the course of the year.  We expect non-agency mortgage backed securities, Commercial Mortgage Backed Securities (CMBS), and consumer backed ABS securities to outperform lower risk assets.

Agency Residential Mortgage Backed Securities (RMBS) experienced their worst yearly performance relative to Treasuries since 2011 as spreads widened 25bps. Unlike in prior years when Federal Reserve asset purchases materially reduced the available supply of RMBS, balance sheet normalization which began in the second half of 2018, will provide an incremental $170b to $180B of supply which the market will struggle to absorb. Traditionally, domestic banks have been big purchasers of agency RMBS, but with the relaxation of liquidity rules for small and mid-sized banks and since money managers have generally been avoiding the sector, we don’t see the market being able to absorb the supply without some spread concession. In the most recent release of the FOMC minutes there was some discussion of selling securities from the mortgage portfolio, but we do not believe the Fed will follow through with any sales. Given the poor technical environment, we favor allocating investments elsewhere within structured products and to other spread sectors.  

Non-agency RMBS still represents an attractive investment option.  Credit fundamentals in the sector still look very good and since underwriting continues to be very conservative, we anticipate the sector outperforming agency RMBS and to a lesser extent Treasuries this year.  Housing price appreciation should slow to roughly 3.5% as compared to levels of 5% and 6% in prior years; however, we don’t anticipate that it will negatively impact the market. With the consumer being in such excellent financial shape due to low unemployment of 3.9% and wage growth of 3.2%, delinquency and default rates should remain at very low levels.

Commercial real estate fundamentals remain in relatively good shape following multiple years of property price appreciation and domestic economic strength. Conduit CMBS supply is estimated to be $70B this year which should prove to be very manageable including only $7.5B of maturing conduit loans in need of refinancing. Ordinarily this type of environment would lead us to conclude that CMBS spreads should tighten in 2019, however, we see more risk to the CMBS market from global economic risks and trade dislocations rather than technical and fundamental factors. Spreads of senior conduit CMBS securities tend to track single A rated corporate bonds fairly closely and we’re anticipating heightened volatility within the corporate sector this year. We expect spread levels to closely track corporate bond spreads but with slightly less volatility which should allow them to modestly outperform Treasuries and single A corporate bonds. Our investment of choice within the sector continues to be conservatively underwritten single asset transactions with low leverage. As in prior years we remain concerned about the retail sector, particularly regional malls in less populated areas, which must be carefully analyzed in any conduit securitization.

ABS was the only structured products sector to outperform Treasuries last year, and we believe they will outperform again in 2019. Healthy consumer balance sheets due to strong job growth and healthy wage gains will support credit performance. We’ll continue to maintain significant portfolio weightings in the asset class particularly in structures backed by consumer receivables. High credit quality and stable cash flows make ABS an attractive alternative to short Corporate Credit, Taxable municipals and Treasuries. Our favorite sub-sectors continue to be prime and some select subprime auto, credit card, and equipment transactions.

Municipal Market

We are maintaining a constructive bias for the tax-exempt sector. During the tumultuous level of volatility that stressed the capital markets during the latter half of 2018, the municipal sector held its ground and performed very well due to very favorable technical conditions. As we enter 2019, we remain constructive on the sector due to similar themes that are expected to see municipal relative valuations continue to improve, especially in the near term.

Tax-reform will once again play a large role in providing a solid technical environment for the tax-exempt sector. The Tax Cut and Jobs Act (TCJA) that passed late in 2017, eliminated the use of tax-exempt advanced refundings, which is a process that allowed issuers to effectively refinance their debt more than 90 days before the actual call date. Its absence resulted in a year-over-year decline in issuance of approximately $100 Billion during 2018 to $339 Billion and, in 2019, its repealed status will continue to suppress supply conditions. We expect to see only a 10% increase in new issuance to $375 Billion, and that level would be 14% below the average annual issuance produced in the three years before tax reform was implemented.

On the demand side, reinvestment flows of coupons/calls/maturities are expected to remain sizable during the year and provide ample support. The record level of refundings that were executed from 2015 to 2017 is expected to result in a large number of maturities during the year that will lead to net supply levels of negative $69 Billion. Although that’s not as extreme as the negative $121 Billion in net supply during 2018, it should remain as a major underpinning to the sector’s solid relative performance during the year.

In looking at the different market segments of demand, we expect that the muted investment behavior from institutional investors (primarily banks and insurance companies) in 2018 will continue to be in play during 2019. Municipal tax-adjusted yield levels at the new 21% corporate rate remain below that of Treasuries inside of 10 years and are well below that of taxable spread product across the yield curve. The Federal Reserve’s Flow of Funds data reported that banks reduced their exposure to municipals by approximately $40 Billion during the first three quarters of 2018, and we expect to see more right-sizing of institutional portfolios during the course of 2019.

However, we are also expecting the retail segment to remain fully engaged in the market. These investors will be flush with cash from reinvestment flows, and tax-adjusted yield levels for investors in the highest tax bracket of 40.8% (37% plus 3.8% Medicare surtax) look very compelling versus taxable alternatives. At the start of the year, grossed-up yields of tax-exempts were 116 basis points north of Treasuries in the 10 year maturity and were at comparable levels to corporates in maturities 10 years and shorter.

Additionally, we do not expect any headline risk to create selling pressure in the space, as we expect credit fundamentals to remain solid during the year. Individual and corporate tax revenues have been growing at a robust rate during 2018 and are expected to continue going forward. That should bode well for solid fiscal performance for state and local governments.

For our insurance portfolios, we believe that tax-adjusted yield levels remain unattractive versus taxable alternatives. However, the relative slope of the municipal curve remains steep from 2 to 20 years and we view the 11 to 20 year relative curve steepness as attractive. We will continue to look at underweighting the sector into any relative outperformance in favor of taxable alternatives that provide a better after-tax yield profile.

The risks to the upside include:

  • Stronger than consensus economic growth that would lead to even stronger tax revenue growth.

The risks to the downside include:

  • A continued downward move in oil prices could pressure the fiscal performance of the heavy oil-producing states.
  • Sharply higher Treasury rates could lead to heavy mutual fund outflows.  
  • Potential passage of federally-sponsored infrastructure spending that leads to higher-than-expected new issuance.

High Yield

After credit spreads fell to a post financial crisis low in early October, the high yield market re-priced significantly in Q4 2018 with spreads widening 223 basis points (bps). This resulted in returns of -2.08% for that year. To put that in perspective, 2018 marks only the 7th time in 35 calendar years of index data the high yield asset class experienced negative total returns. Broad market yields ended the year at 7.95% with credit spreads at +526 bps, both metrics exceeding their 5 year average. Valuations for the sector have become more attractive given the underlying fundamentals as 2019 default rates are expected to remain below the long-term average.

Exhibit 4: High Yield Market Credit Spreads

Source: Bloomberg Barclays US Corporate High Yield Index

Unlike the investment grade market, high yield issuers have generally deleveraged their balance sheets since 2015, as evidenced by a continued positive upgrade/downgrade ratio and the percentage of CCC rated issuers in the market, which has declined to a decade low at 13% of the index. Further, interest coverage ratios remain high, and the level of future debt maturities to be refinanced is manageable.

Exhibit 5: Default Rates

Note: 2018 data is through November 30.
Source: J.P. Morgan

Technicals for the asset class are supportive as the high yield market debt outstanding has been shrinking since 2016. New issue supply for High Yield was $187 billion or -43% year-over-year which was the lowest volume since 2009. In contrast, the loan market has been a funding alternative for high yield corporates, as issuance of $697 billion ranked as the second highest annual total on record despite a 28% drop from 2017. It bears watching that acquisition-related issuance has drifted higher to 21% of volume, but that level remains below the long-term average of 24% which is well below the highs of over 50% in 2007. Additional headwinds for the sector will likely persist if macroeconomic declines exceed expectations. Increased hedging costs have weighed on foreign demand as US monetary policy has diverged from global central banks, and further rate hikes would likely extend this trend. A recession could also impact valuations as BBB issuers are downgraded to high yield, increasing supply. However, higher yields and spreads overall improve break-evens and provide more downside protection around interest rate risks and potential credit concerns. We continue to believe credit risk is best managed with an active approach that emphasizes credit quality and diversification to reduce risk in portfolios. Long-term investors with the ability to act as liquidity providers to the market during periods of volatility are likely to be rewarded.

Convertibles

While convertibles outperformed most asset classes in 2018, the year is best viewed as two distinct periods – the first nine months of the year, and the last three months of the year.

First quarter 2018 through the third quarter saw a continuation of the longest equity bull market on record, and many convertibles moved further “up the curve” becoming ever more equity-like. However, the market capitulation in the fourth quarter highlighted the lack of downside protection afforded by equity-like convertibles. As some individual stocks dropped by a magnitude of 50% or more, equity-like convertibles linked to those shares fell virtually in lockstep with the underlying stock price.

Balanced convertible portfolios, on the other hand, offered downside protection during the fourth quarter as bond floors held up and provided support.

In the aggregate, balanced convertibles did their job in 2018, providing upside participation as equities climbed during the first three quarters, and delivering downside protection as markets fell in the fourth quarter. Over a complete market cycle – which we have not seen in nearly ten years – we expect the “ratchet” effect provided by balanced convertibles will result in equity-like returns with less volatility.

U.S. primary market activity was strong with convertible issuance of $53 billion during 2018. That made 2018 the biggest year for convertible issuance since 2008 (when issuance was $59 billion). The Technology and Healthcare sectors represented 60% of new issuance at 43% and 17%, respectively.

Convertible issuance combined with the fourth quarter equity market decline allowed us to counteract two fundamental issues associated with the convertible market today: technology sector concentration and equity sensitivity.

The sector breakdowns below highlight the Technology concentration in the broader market (using the V0A0 index as a proxy) versus a balanced convertible composite (using the Zazove Associates Blend Strategy Composite as a proxy).

Exhibit 6: V0A0 Sector Breakdown as of 12/31/18

Source: ICE BofAML Convertible Index Data

Exhibit 7: Zazove Associates Blend Composite Sector Breakdown as of 12/31/18

Source: Zazove Associates

Further, the weighted average investment premium (a measure of downside risk exposure) of the V0A0 Convertible Index is 49.4% versus 20.5% for the Zazove Blend Composite. For investors in convertibles, active management of portfolio investment premium mitigates downside risk and leads to superior risk-adjusted returns over market cycles.

To the extent interest rates continue to increase in 2019, the low duration of convertibles (~2 years or less) will insulate our portfolios from the headwinds typically associated with a rising interest rate environment.

Further, if the fourth quarter of 2018 portends renewed 2019 market volatility that would be a positive development for investors in AAM/Zazove balanced convertible strategies.  As an active manager of balanced convertible portfolios, volatility provides abundant trading opportunities and allows us to rebalance, take advantage of attractive valuations, and continue to optimize portfolios. As an aside, volatility increases the value of the embedded option of convertibles.

The opportunity set and trading environment for convertibles is as strong as it has been in years, and we are excited about the prospects for 2019.

Contributions by:
Greg Bell, CFA, CPA | Director of Municipal Bonds
Marco Bravo, CFA | Senior Portfolio Manager
Scott Edwards, CFA, CPA | Director of Structured Products
Elizabeth Henderson, CFA | Director of Corporate Credit
Reed Nuttall, CFA | Chief Investment Officer
Scott Skowronski, CFA | Senior Portfolio Manager
Stephen Bard, CFA | Chief Operating Officer, Zazove Associates
Gene Pretti | Chief Executive Officer, Zazove Associates

  • « Go to Previous Page
  • Page 1
  • Page 2
  • Page 3
  • Page 4
  • Page 5
  • Interim pages omitted …
  • Page 17
  • Go to Next Page »

Get updates in your inbox.

  • Investment Strategies
    • Investment Grade Fixed Income
    • Specialty Asset Classes
  • Our Clients
    • Client Experience
    • Sample RFP Download
  • Insights
    • Video
    • Webinar
    • News
    • Podcasts
  • About
    • Our Team
    • Contact
    • Client Login

Disclaimer: Asset Allocation & Management Company, LLC (AAM) is an investment adviser registered with the Securities and Exchange Commission, specializing in fixed-income asset management services for insurance companies. Registration does not imply a certain level of skill or training. This information was developed using publicly available information, internally developed data and outside sources believed to be reliable. While all reasonable care has been taken to ensure that the facts stated and the opinions given are accurate, complete and reasonable, liability is expressly disclaimed by AAM and any affiliates (collectively known as “AAM”), and their representative officers and employees. This report has been prepared for informational purposes only and does not purport to represent a complete analysis of any security, company or industry discussed. Any opinions and/or recommendations expressed are subject to change without notice and should be considered only as part of a diversified portfolio. A complete list of investment recommendations made during the past year is available upon request. Past performance is not an indication of future returns. This information is distributed to recipients including AAM, any of which may have acted on the basis of the information, or may have an ownership interest in securities to which the information relates. It may also be distributed to clients of AAM, as well as to other recipients with whom no such client relationship exists. Providing this information does not, in and of itself, constitute a recommendation by AAM, nor does it imply that the purchase or sale of any security is suitable for the recipient. Investing in the bond market is subject to certain risks including market, interest-rate, issuer, credit, inflation, liquidity, valuation, volatility, prepayment and extension. No part of this material may be reproduced in any form, or referred to in any other publication, without express written permission. *All figures shown are approximate and subject to change from quarter to quarter. **The accolades and awards highlighted herein are not statements of any advisory client and do not describe any experience with or endorsement of AAM as an investment adviser by any such client.

Copyright © 2024 AAM | Privacy and Disclosures

  • LinkedIn
  • YouTube