• Skip to primary navigation
  • Skip to main content
  • Skip to footer
AAM CompanyTransparent Logo

AAM Company

AAM Company Website

  • Investment Strategies
    • Investment Grade Fixed Income
    • Specialty Asset Classes
  • Clients
    • Our Clients
    • Client Experience
    • Download Sample RFP
  • Insights
    • Video
    • Webinars
    • Podcasts
    • News
  • About
    • Our Team
    • Events
  • Login
  • Contact Us
Contact

Corporate Credit

December 5, 2018 by

Frosty the Snowman’s Summary

The holiday season continues to be a critical time of year for retailers as they earn up to 40% of their annual revenues during this time period. Based on adjusted figures from the U.S. Census Bureau, retail sales (excluding auto and gas) for the 2017 holiday season were up 6.1% which was the best growth in over ten years. That number will be difficult to beat this year. Despite the high hurdle, we think holiday sales will be up around 6.0% on an adjusted basis. Our bias is constrained given the tough comparison to last year and limited extraordinary spending trends. The following report explores some of the key components of our analysis.

Rudolph’s nose may be red, but the consumer is a “beast”

We believe the most important driver of retail sales is consumer confidence. The following table summarizes our analysis of nine factors that contribute to that level of confidence measured year over year.

Exhibit 1

Source: Bloomberg, AAM

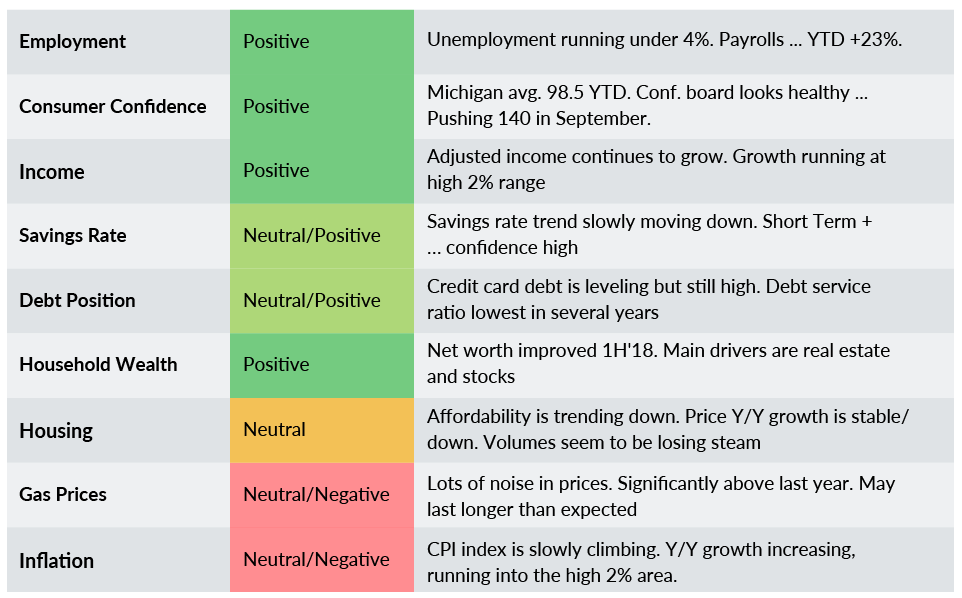
We have been tracking these factors since 2011, and they have never been this strong. Last year was good and this year looks moderately better year over year. Wages, confidence, and unemployment are all showing strong trends going into the end of the year. High gas prices are less of a factor now given the ease of online shopping, and inflation seems to be under control for now.

Ralphie Parker hates ‘back to school’ bullies, but what about his Christmas list?

A review of data from the last twenty years as displayed in Exhibit 2 reveals a significant correlation (78%) between “Back to School” retail sales – as measured in August and September – and holiday sales – as measured in November and December. To model the trend, we used the U.S. Census Bureau’s adjusted monthly retail trade data which includes a variety of retail businesses (excluding motor vehicle sales and parts dealers and gasoline stations; sales in those segments have been more heavily impacted by factors outside the control of consumers).

Exhibit 2

Source: U.S. Census Bureau

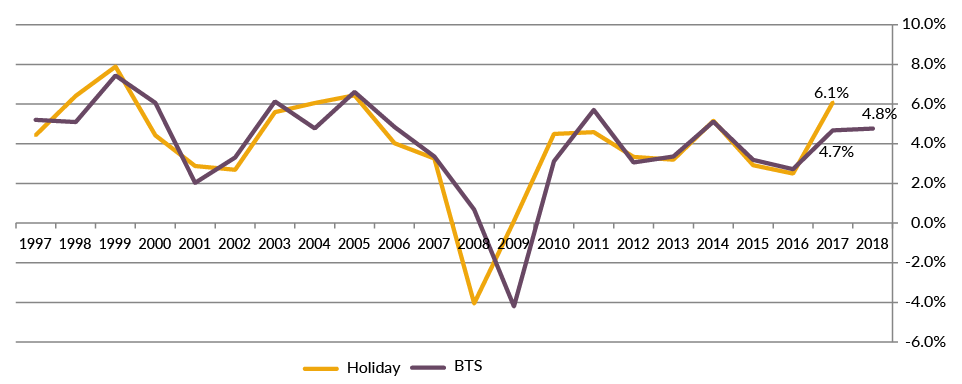
Our regression model predicts adjusted holiday sales of 3.8% when using the 4.8% actual for “Back to School” sales in 2018. This is just above the 20 year average of 3.9%. Comparatively, 2017 “Back to School” sales of 4.7% led to actual holiday sales of 6.1%. Clearly, the model did not do a good job last year in predicting holiday sales.

Same number of elves in the workshop this year

Overall, holiday related hiring is projected to be up this year versus last year. In many cases lower hiring in brick and mortar establishments is being offset by a greater need to support e-commerce sales. One thing for sure, costs to hire new employees is going up especially in those areas involved directly with product distribution.

The following is a graph from the National Retail Federation (NRF) which shows the change in holiday hiring over the past 15 years. The NRF predicts hiring will be up 585,000-650,000 positions compared to last years 582,500.

Exhibit 3

Buddy the Elf loves Gimbels, but consumers love e-commerce

Online retail sales continue to gather momentum and help fuel total retail sales even as store traffic continues to decline. Most industry experts are expecting mid-to-high teen increases this year from e-commerce sales. According to the U.S. Census Bureau, e-commerce now accounts for 11.2% of total retail sales year-to-date. We believe that figure actually is closer to 19% if you take excluded segments that are not currently at significant risk of an internet presence such as auto, restaurant/bar, and gas station sales. Thru October growth for the online category was 10.3% which is almost twice the 5.3% growth of total retail sales year to date.

Mobile shopping continues to be the largest driver of e-commerce. According to Salesforce data for Black Friday, mobile accounted for 67% of online traffic and 49% of actual order share. Salesforce data also showed that mobile traffic from social channels was up 94% on Thanksgiving Day with the vast majority of that originating from Facebook and Instagram.

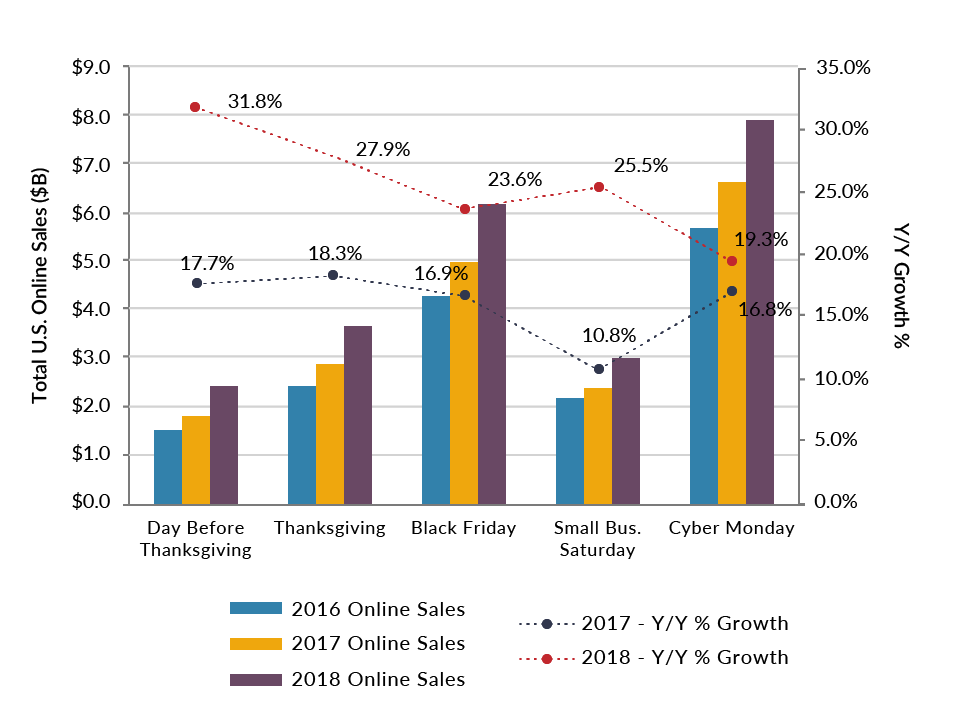
Several third party sources have posted positive results for the 5 day holiday sales weekend starting with the day before Thanksgiving. Adobe seems to provide the most comprehensive results for online sales indicating that online sales were up 24% this year. The following graph details each day of the holiday sales period with comparisons to previous years.

Exhibit 4

Source: Stifel

What are all of the Whos in Whoville saying?

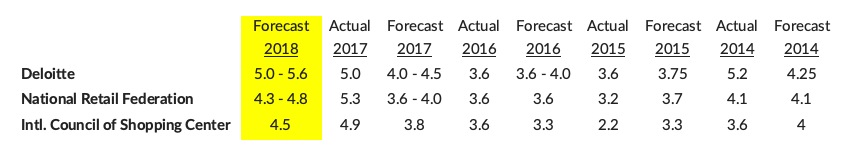
According to a survey released by the National Retail Federation (NRF), shoppers will spend an average of $1,007 in 2018 for a total of approximately $717 billion and they plan to spend most of their time online and in department stores. For the 12th year in a row, the most popular present is expected to be gift cards, while sales and discounts remain the most important factors motivating sales at individual retailers. We thought it would be interesting to look at how accurate different retail trade groups have been with their holiday predictions over the past three years and we have included a summary in Exhibit 5. While each of them uses a different data set to support their expectations, it is still interesting to note the predicted growth year over year. Based on this data, we would not favor any one of these trade group’s prediction over the other because while all three expect sales to grow about the same as last year all three were considerably conservative in their expectations for 2017.

Exhibit 5

Source: AAM

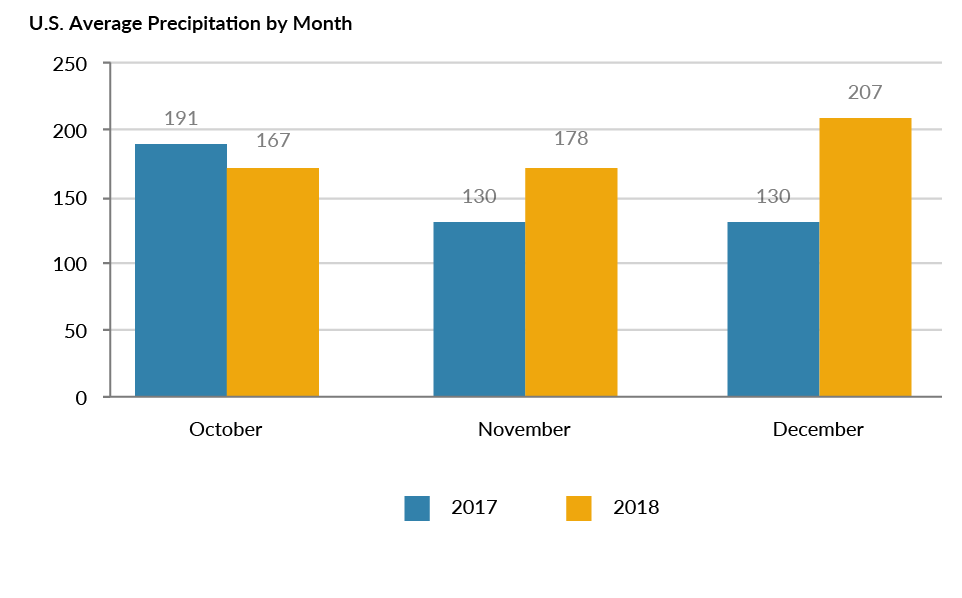
Wind chills and a white Christmas?

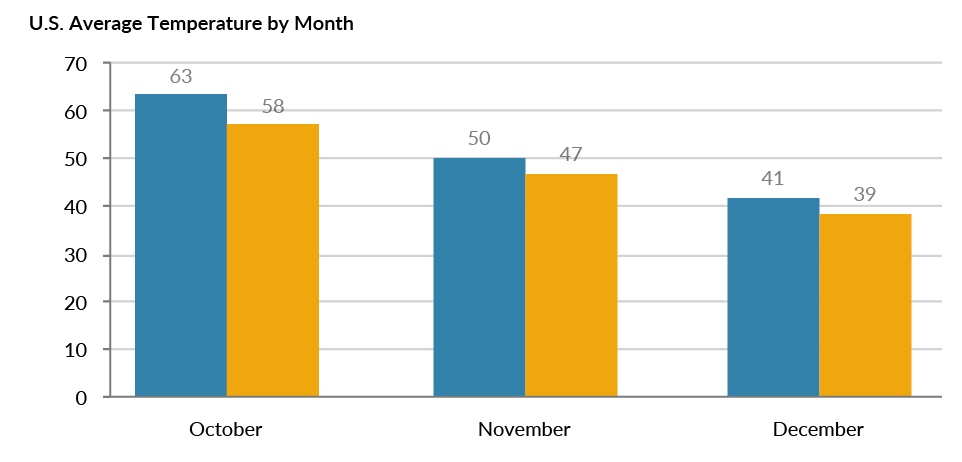
Weather and the shifting calendar are always important factors for holiday spending. According to Weather Trends International (WTI), this holiday season is expected to be somewhat more favorable with cooler temperatures offsetting the expectation of increased precipitation. The ideal weather for holiday shoppers is cold and dry. Retailers want shoppers to buy winter products but not be turned away by heavy snow.

Exhibit 6

Source: Weather Trends International, Morgan Stanley

The days between Thanksgiving and Christmas are key shopping days. This year, those days total 32 (26 is the minimum, 32 is the maximum) versus 31 last year. In addition, there are ten total weekend days to shop (maximum) which is the same as last year.

The way the cookie crumbles

Despite the previously noted favorable developments, there are some issues that could negatively impact sales this holiday season. These include inventory stock outs potentially arising from lower orders from China due to higher tariffs along with difficulty in seasonal hiring given the current low unemployment levels. Also, volatility in the stock market could have a “wealth effect” and could slow spending if investors feel like their net worth has been negatively impacted. Finally, strain on the transportation sector may impact availability of product for the holiday season and may slow holiday deliveries. At the end of the day, some of these potential “issues” probably are more of a concern for profitability versus top line sales for retailers.

So what do we expect under the tree this year?

Overall, we are optimistic about 2018 holiday spending. The typical consumer is in a stronger economic position this year versus last year and advancements in online and mobile retail makes it that much more pleasant to shop. However, beating last year’s impressive growth will be difficult given the lack of significantly positive ancillary factors this year.

July 18, 2018 by

 MARKET SUMMARY AND OUTLOOK

The Investment Grade (IG) Corporate bond market (per Bloomberg Barclays Index) delivered a lackluster -1% total return in the second quarter 2018, with spreads widening 14 basis points (bps). The IG market underperformed the S&P Index which returned 3.4% and high yield (1%). As trade tensions escalated and the USD strengthened, Emerging Markets (debt and equity) underperformed. Corporate bonds with longer maturities underperformed with demand increasing for shorter maturity bonds given the flattening of the yield curve. Spread widening was fairly even across credit ratings, with ‘BBB’s slightly underperforming ‘A’s. Financials outperformed Industrials.

A solid earnings season and optimistic outlook was overshadowed by headlines regarding Italy, trade wars, and M&A in addition to a continuation of weak market technicals. Demand from foreign investors and funds for IG bonds remains lower vs. last year, and supply remains an overhang with higher than expected new issue supply and dealer inventory levels.

One of our credit cycle indicators is raising a cautionary flag given the flattening that has occurred in the Treasury curve. While many are quick to say “it’s different this time,” we understand the curve itself has an effect on investment behavior and economics, which eventually causes risk to reprice. An inverted yield curve is a more serious signal, but one should not ignore a flat curve even though it may take some time for credit spreads to reprice. Looking at points in history when the curve is flattening, spreads are on average about 40 bps wider than the subsequent year.

We expected very pedestrian performance from the IG market this year given the OAS at year end 2017 of 93 bps. While spread volatility has remained fairly low year-to-date (11 bps YTD), the potential for spread widening is higher over the intermediate term. We believe there will be attractive entry points as a result of the increased size of the debt markets, higher debt leverage of companies at this point in the cycle along with the structural changes in the market. Despite starting this year in a fairly defensive position, we are taking the opportunity to reduce our BBB exposure to increase flexibility when spreads widen materially. Historically, spreads for BBB rated credits widen twice the rate of A/higher rated credits.

Performance Summary Year-To-Date
Spreads widened in the second quarter, with OAS 14 bps wider for the market index. The widening related to: (1) headlines associated with mergers and acquisitions (M&A) in sectors such as Telecom, Cable and Media (2) weaker technicals, specifically related to higher than expected new issue supply and dealer inventories particularly on the long end, impacting longer duration sectors such as Railroads and Life Insurance and (3) headlines related to Italy, impacting the Bank sector, subordinated bonds in particular. Sectors that outperformed included: Energy, Consumer related sectors, and more defensive sectors such as Capital Goods and Utilities. Despite these nuances, spreads are wider for all sectors year-to-date.

Source: Bloomberg Barclays Index as of 6/30/2018 AAM (Other – Transportation, Utilities, Capital Goods)

Source: Bloomberg Barclays Index as of 6/30/2018, AAM

Credit Market Fundamentals
Stronger worldwide growth continued to benefit EBITDA growth in the first quarter of the year, allowing firms to slightly deleverage as it outpaced the growth rate of debt.

Source: AAM, Factset data as of 3/31/2018

While the number of issuers with very high leverage (i.e., >4.0x) has fallen from the peak in mid 2016, it remains elevated as does leverage for the group as a whole. While we had expected leverage to improve this year, we believe that may be postponed in light of debt funded M&A. We expect deal activity to remain elevated in growth challenged sectors like Media, Healthcare, Food & Beverage, among others which represent about 20% of the market.

Source: AAM, Factset data as of 3/31/2018 (IG companies; excludes commodities based firms, autos, construction machinery, utilities and financials)

Market Opportunities
The IG market has more than doubled in size and a lot of that growth has come from BBB rated securities, as the exhibit below shows.

Source: Wells Fargo “Q3 Outlook” 6/28/2018

Given the lack of risk premium for BBB rated securities, the level of debt levearge previously discussed and likely pause in fundamental improvement due to leveraging M&A concurrent with late cycle indicators (namely flattening of 2s-10s Treasury curve), we are using this opportunitiy to reduce risk in the Corporate Credit sector, namely BBBs.

Source: Bloomberg Barclays , AAM

_____________________________________________________________________________________________________________________________________________

Disclaimer: Asset Allocation & Management Company, LLC (AAM) is an investment adviser registered with the Securities and Exchange Commission, specializing in fixed-income asset management services for insurance companies. Registration does not imply a certain level of skill or training. This information was developed using publicly available information, internally developed data and outside sources believed to be reliable.  While all reasonable care has been taken to ensure that the facts stated and the opinions given are accurate, complete and reasonable, liability is expressly disclaimed by AAM and any affiliates (collectively known as “AAM”), and their representative officers and employees.  This report has been prepared for informational purposes only and does not purport to represent a complete analysis of any security, company or industry discussed. Any opinions and/or recommendations expressed are subject to change without notice and should be considered only as part of a diversified portfolio. A complete list of investment recommendations made during the past year is available upon request. Past performance is not an indication of future returns. This information is distributed to recipients including AAM, any of which may have acted on the basis of the information, or may have an ownership interest in securities to which the information relates.  It may also be distributed to clients of AAM, as well as to other recipients with whom no such client relationship exists.  Providing this information does not, in and of itself, constitute a recommendation by AAM, nor does it imply that the purchase or sale of any security is suitable for the recipient. Investing in the bond market is subject to certain risks including market, interest-rate, issuer, credit, inflation, liquidity, valuation, volatility, prepayment and extension. No part of this material may be reproduced in any form, or referred to in any other publication, without express written permission.

December 22, 2017 by

2017 Summary

Markets surpassed expectations in 2017, supported by synchronized global growth, low volatility, and the prospect of tax reform. The Investment Grade (IG) Corporate Credit Market, as represented by the Bloomberg Barclays Index, generated a return of over 3% in excess of Treasuries. The high yield default rate improved from 6% to 3%. Moreover, after two years of rating downgrades to high yield outpacing upgrades to IG, the trend reversed in 2017. All IG sectors performed well, especially Energy, Basic Materials, and Insurance. Companies took advantage of the strong demand for IG bonds, issuing a record breaking $1.3 trillion. Revenue and cash flow growth accelerated in 2017, due to increasing commodity prices, interest rates, and worldwide growth. Companies took a pause from merger and acquisition (M&A) activity, waiting for policy clarity from the new Administration. This activity started to pick up later in the year. Median debt leverage for IG companies declined in 2017, driven mainly by commodity related firms, as leverage excluding commodity related sectors remained essentially unchanged.

Source: FactSet as of 9/30/2017, AAM (317 IG credits, excluding financials, autos, construction machinery)

2018 Outlook

For 2018, we expect continued worldwide growth to support revenues with corporate tax reform in the US enhancing cash flows for the majority of IG companies. Those with domestic focused operations are expected to benefit the most from tax reform, as they have higher effective tax rates. Importantly, while we expect most of the benefits to accrue to equity holders, there will be companies that will use the tax savings to deleverage (i.e., Pharmaceuticals). We will monitor the potential negative consequences of this reform, such as the reduction in financial flexibility for growth challenged, highly leveraged companies and/or consumers in high property and income tax states or conversely, higher than expected inflation causing the Federal Reserve to raise rates more aggressively to dampen growth.

We expect Sales growth to be around 5% with EBITDA growth approaching 10% on average in 2018. Capital spending is expected to return to the levels experienced before the commodity correction (6%+). We expect M&A activity to pick up meaningfully next year, as technology and other catalysts drive companies to vertically or horizontally consolidate. Similar to 2017, we are not expecting a material reduction in debt leverage despite positive fundamental trends due to the low cost of debt relative to equity. Given the number of companies with elevated debt leverage relative to other cycles, the credit market remains vulnerable to an unexpected shock to revenues or cash flows. This is not only an IG issue but a high yield and loan market issue as well given the percentage of credits rated B3 and lower. Due to the positive top line trend, our fundamental outlook for the corporate sector overall is stable with the most dispersion in non-financials.

The demand from investors for corporate credit remained very strong in 2017. Inflows into IG bond funds and ETFs was two to five times higher than the annual flows of the last three years respectively. In addition, demand from foreign investors remained elevated, as yields net of hedging costs remained attractive in USD denominated IG bonds. For 2018, we believe corporate credit will remain attractive to investors seeking yield (pension, insurance), but with higher hedging costs, increased supply of alternatives related to QE unwinds, and the likelihood of lower prospective total return given the expectation for higher rates, the risks are skewed to the downside. We expect credit curves to flatten, with the short end underperforming.

Developed Market fixed income supply to increase meaningfully in 2018

Our expectation is for volatility to remain historically low in 2018, with little movement in the average option adjusted spread (OAS) for the market, generating projected excess returns vs. Treasuries in IG corporate credit of between 75-125 basis points. Corporate bond spreads vs. Treasuries are ending 2017 at very low levels historically, especially for higher rated credits, reflecting the expectation for low defaults and volatility. In this environment, we are prioritizing fundamentals and credit selection. We believe identifying idiosyncratic risk at the sector and especially credit level will be very important to portfolio returns in 2018.

The sectors we believe will outperform include: Metals & Mining, Diversified Manufacturing, Wireline, Supermarkets, Pharma, Tobacco, Independent Energy, Midstream, Rail, Electric Utility, Natural Gas, Life Insurance, and P&C Insurance. Those we believe will underperform the market overall include: Health Insurance, Technology, Integrated Energy, Consumer Products, Food/Beverage, Healthcare, Auto, Cable, Media, and Chemicals.


Elizabeth Henderson

Written by: Elizabeth Henderson, CFA

Director of Corporate Credit


Disclaimer: Asset Allocation & Management Company, LLC (AAM) is an investment adviser registered with the Securities and Exchange Commission, specializing in fixed-income asset management services for insurance companies. Registration does not imply a certain level of skill or training. This information was developed using publicly available information, internally developed data and outside sources believed to be reliable.  While all reasonable care has been taken to ensure that the facts stated and the opinions given are accurate, complete and reasonable, liability is expressly disclaimed by AAM and any affiliates (collectively known as “AAM”), and their representative officers and employees.  This report has been prepared for informational purposes only and does not purport to represent a complete analysis of any security, company or industry discussed. Any opinions and/or recommendations expressed are subject to change without notice and should be considered only as part of a diversified portfolio. A complete list of investment recommendations made during the past year is available upon request. Past performance is not an indication of future returns. This information is distributed to recipients including AAM, any of which may have acted on the basis of the information, or may have an ownership interest in securities to which the information relates.  It may also be distributed to clients of AAM, as well as to other recipients with whom no such client relationship exists.  Providing this information does not, in and of itself, constitute a recommendation by AAM, nor does it imply that the purchase or sale of any security is suitable for the recipient. Investing in the bond market is subject to certain risks including market, interest-rate, issuer, credit, inflation, liquidity, valuation, volatility, prepayment and extension. No part of this material may be reproduced in any form, or referred to in any other publication, without express written permission.

December 13, 2017 by

August 8, 2017 by

By Mike Ashley
Senior Analyst, Corporate Credit

My fifteen year old son is only a month away from getting his driver’s license. This event has sparked some pretty interesting discussions in the Ashley house. The other day, my ten year old daughter, who is in better touch with the world than her two older brothers, asked me if I thought she would ever need to get a driver’s license when she was older. Knowing I only had her attention for about twenty seconds and wanting to be as honest as possible I simply said, “I don’t know.”

Saying that the auto industry is going through dramatic changes is an understatement. Ford just promoted its previous head of Ford Smart Mobility to President & CEO. Tesla, a company founded just thirteen years ago with no dealer network and no advertising, recently surpassed both Ford and GM in terms of market capitalization. The purpose of this report is to explore the trends in the auto industry and to discuss AAM’s thoughts on expected auto sales.

AUTO SALES – Past, Present, & Future

As we forecasted in our 2017 Corporate Market Outlook, auto sales have been weaker than expected. Each month, it becomes clearer that we are near the peak of auto sales in the U.S. In fact, we may have already passed that point. The chart below compares monthly auto sales (blue line) with year-over-year growth (red line). We have seen a slowing trend in growth since 2012 and now have experienced negative growth in ten of the last twelve months. Some of the reasons for this include slowing incentives, lower trade in values (falling used car prices), and more conservative underwriting within auto lending, especially in sub-prime. Most major auto manufacturers agree that lower sales at better/similar margins is a better alternative to higher sales at lower margins. This most likely translates into lower production and then stagnating new auto sales.


Source: AAM, Bloomberg

Combine slowing sales with huge advancements in technology, new competitive threats, and evolving consumer behavior and you get a very unpredictable and exciting industry outlook. While we wouldn’t expect the size of the pie (market) to be that much different, we would expect the number of slices (competitors) and layers (customers) to change significantly. Our base assumption is for U.S. auto sales to tail off for the next three years, ending the decade at around the mid-15 million Seasonally Adjusted Annual Rate (SAAR). For 2017, we expect sales will come in around 17 million.

While the average consumer is in good shape, we don’t expect the industry to continue to benefit from strong used car prices and attractive financing. We believe these tailwinds have been partly responsible for annual sales exceeding analyst expectations over the past several years. Going forward, the industry expects a record number of leased cars to come due which should help to push used car prices down, and we would generally expect lending conditions to tighten as subprime performance deteriorates. Beyond 2020, forecasting auto sales could prove very difficult given three potentially game-changing developments.

#1 Autonomous Vehicles

There are different levels of self-driving cars, also known as autonomous vehicles. Currently, there are no vehicles on the road in the U.S. that require zero human input (known in the industry as “Level 5”).  But beware – this is coming and it is coming soon. The second generation Tesla Model S and Model X have the necessary equipment to drive completely on their own but have not yet been enabled. For Tesla, the goal of full autonomy is an evolving process which involves slowly rolling out self driving features and testing them against real life data as miles driven by these cars pile up by the millions.

Ideally, a world with autonomous vehicles would mean less accidents and traffic, lower economic costs, more efficient energy/fuel consumption, and increased mobility for children and the elderly. Most automakers have picked up on the trend and are heavily investing in it, although it is still up for debate as far as which companies will excel in this area. In any case, we would expect a significant number of fully autonomous vehicles on the road from multiple manufacturers in the next five years.  However, regulatory issues could cause a major roadblock which could delay the process, especially for higher level automation.  It should also be noted that this technological advancement touches several other industries including bars & restaurants (about one third of traffic fatalities are alcohol related) and providers of auto insurance (fewer accidents and injuries). The following graphic, put together by Morgan Stanley, is a nice overview of key participants in the area of autonomous driving.

#2 Electric Vehicles

Morgan Stanley believes that by the year 2040 electric vehicles will account for 51% of global sales and will comprise 24% of the global passenger car fleet (Morgan Stanley, p.4, May 5 2017, One Billion BEVs by 2050?). Volvo recently announced that by 2019, every car it produces will have an electric engine. This trend away from gas powered engines started with Toyota’s Prius introduction in 1997, the first mass produced hybrid vehicle, although less than 5% of vehicles sold today in the U.S. fall into the hybrid/electric category. Electric cars started to gain more consumer acceptance with the introduction of vehicles by Tesla which were mostly geared towards high income consumers. This category is expected to grow quickly as the total cost of ownership gets closer to similar gas combustion engine vehicles. In addition, consumers’ concerns regarding limited range, access to plug-in stations, and battery life are becoming less pressing as the appropriate infrastructure is being built and battery technology improves. Currently, there are several concepts being kicked around regarding the future of electric vehicle charging. These ideas include solar roof charging, autonomous “park & charge” facilities, and wireless road charging as conceptualized in the picture below.

Other inputs relevant to the demand for electric vehicles include the continuation of government subsidies and the cost of gasoline. If Morgan Stanley is correct with its estimates, we would expect a number of industries to be significantly impacted. For example, there is six times the amount of semiconductor content in an electric vehicle versus a gas powered vehicle (UBS, p.76, May 18 2017, UBS Evidence Lab Electric Car Teardown- Disruption Ahead?). Companies such as Infineon, Intel and Texas Instruments are already treating this area as a significant source of growth with capital already invested.

#3 Car Sharing

On Zipcar’s website one of its slogans reads, “The genius of car sharing…it’s like owning a car, without the sucky parts.” Car sharing has gained popularity in urban environments where public transportation, biking, and walking are often the primary ways to get around. Cars can be rented by the hour versus on a daily basis. Members are not responsible for any maintenance and insurance and gas are included in the price. The process is very convenient, and cars come in a wide variety of shapes and sizes.

Car sharing companies are typically owned by either major rental car providers (i.e., Avis owns Zipcar) or by auto manufacturers (e.g., GM started Maven). We would not expect car sharing to be used by drivers who use their cars on a daily basis, such as those who commute to work, but at the end of the day, we believe car sharing should theoretically limit the growth of auto sales. This trend seems to be more of a reshuffling of sales for the rental car industry than anything else. Outside of the U.S., in those countries with a higher rate of urbanization and population growth, car sharing could result in additional auto sales growth. The exhibit below shows the differences in urbanization rates between developed countries such as the U.S. and Japan versus emerging countries, like China and India.

Auto Trends Not Expected to Enhance Sales Growth

We expect the coming years in the auto industry to be extremely exciting for consumers and highly challenging for manufacturers. Competition has never been more intense as the race to incorporate new technology and consumer trends has piqued the interest of non traditional auto makers with excesses of cash. However, even with this excitement, we don’t expect these trends to support higher auto sales on their own. We forsee more of a transition and replacement type of cycle where older gas combustion cars are phased out, and longer term, we expect auto sales to follow demographic trends and economic growth.

To put it simply, the companies with the most resources are expected to do the best. So far, Tesla has benefited from its “first mover” strategy and impressive execution led by the visionary leadership of Elon Musk. Others have followed by either developing the product on their own or using technology from existing products. Earlier this year, BMW, Mobileye, and Intel announced a collaboration that would result in autonomous vehicles by 2022. Later in March, Intel announced the purchase of Mobileye for $15.3 billion. Daimler is probably the most aggressive among the global automakers with at least €10 billion expected to be spent on electric mobility alone. Recently, Daimler announced an agreement to supply Uber with self driving vehicles. We expect these examples of collaboration, partnerships, and acquisitons to continue on a large scale. The race to develop a high tech, fully autonomous, eco friendy vehicle is on!

Written by:
Mike Ashley

Michael J. Ashley is a Principal and Corporate Credit Senior Analyst at AAM with 19 years of investment experience. Prior to joining AAM, Mike worked at Northern Trust Global Investments with responsibility for following investment grade industrials including credits in the basics, energy, consumer products, media, and retail sectors. Mike earned a BA from the University of Iowa in Management Information Systems and an MBA from DePaul University in Finance.


Disclaimer: Asset Allocation & Management Company, LLC (AAM) is an investment adviser registered with the Securities and Exchange Commission, specializing in fixed-income asset management services for insurance companies. Registration does not imply a certain level of skill or training. This information was developed using publicly available information, internally developed data and outside sources believed to be reliable.  While all reasonable care has been taken to ensure that the facts stated and the opinions given are accurate, complete and reasonable, liability is expressly disclaimed by AAM and any affiliates (collectively known as “AAM”), and their representative officers and employees.  This report has been prepared for informational purposes only and does not purport to represent a complete analysis of any security, company or industry discussed. Any opinions and/or recommendations expressed are subject to change without notice and should be considered only as part of a diversified portfolio. A complete list of investment recommendations made during the past year is available upon request. Past performance is not an indication of future returns. This information is distributed to recipients including AAM, any of which may have acted on the basis of the information, or may have an ownership interest in securities to which the information relates.  It may also be distributed to clients of AAM, as well as to other recipients with whom no such client relationship exists.  Providing this information does not, in and of itself, constitute a recommendation by AAM, nor does it imply that the purchase or sale of any security is suitable for the recipient. Investing in the bond market is subject to certain risks including market, interest-rate, issuer, credit, inflation, liquidity, valuation, volatility, prepayment and extension. No part of this material may be reproduced in any form, or referred to in any other publication, without express written permission.

July 24, 2017 by

Elizabeth Henderson


By Elizabeth Henderson, CFA
Director of Corporate Credit


Market summary and outlook

The Investment Grade (IG) Corporate bond market delivered a 3% total return in the second quarter 2017, with spreads tightening 9 basis points (bps). Risk assets performed similarly, as the S&P Index returned 3% in the second quarter, high yield 2%, and Emerging Markets 2% as well. Corporate bonds with maturities greater than 10 years outperformed shorter dated securities, contributing more than two-thirds of the total return performance of the IG Index per Bloomberg Barclays. Similarly, BBB rated securities outperformed and drove more than 50% of the performance.

We continue to see strong demand from bond funds for investment grade securities, and foreign buying of USD IG debt remains a source of demand despite the less attractive yield advantage (net of hedging costs). New issue supply normalized in the second quarter, and the relatively light new issuance in longer dated maturities was one contributor to the outperformance of long corporate bonds. The unwind of QE may be a headwind for spreads in the intermediate term, but the market has digested the information constructively thus far.

We expect returns to be generated largely from income over the near term, as the potential for spread tightening remains limited unless growth surprises to the upside and/or companies begin to meaningfully reduce debt. Despite lackluster valuations, we have a neutral opinion on the IG corporate sector, expecting technicals to remain supportive and fundamentals relatively stable over the near term given policy related uncertainty, improving overseas growth, and favorable lending conditions. Margin pressures such as rising labor costs and/or disappointing growth remain a risk given the elevated level of debt leverage and size of the credit market, BBB rated securities specifically. Tactically, we are maintaining flexibility to add on spread widening related to the unwind of central bank quantitative easing (QE).


Source: Bloomberg Barclays, AAM

Performance summary year-to-date

Spreads continued to tighten in the second quarter, with OAS 14 bps tighter year-to-date. Energy spreads underperformed in the second quarter due to the heightened volatility of oil prices. Year-to-date, every corporate sector has generated positive returns, with the Basic Materials and Finance sectors outperforming.

Rating actions have been positive with more than two times the number of “rising stars” (bonds moving from High Yield to Investment Grade) vs. “fallen angels” (from IG to HY). Improving fundamentals was the driver of 78% of the upgrades, with M&A being a smaller contributor. The same held true for the downgrades. M&A activity has remained active this year for larger deals. M&A related leverage loan volumes were down in the first half. LBO related activity has stalled due to high valuations and the limitation on leverage by the Federal government, although more leverage is being used to fund deals this year vs. prior years. Net demand for leveraged loans has been strong, resulting in weak covenant protection. We continue to monitor loan market fundamentals for signs of stress.

Source: Bloomberg Barclays Index (as of 6/30/2017), AAM 

Credit fundamentals

Credit metrics remained fairly stable in the first quarter of 2017. We expect continued revenue and EBITDA growth in the second quarter, although it’s likely to moderate vs. the first quarter. Sectors expected to drive growth include Technology, Materials, and Energy with Telecom expected to be a drag. While it is early in the financial reporting season, we are pleased at the rate of loan growth for large, diversified banks given the weakness witnessed in the first quarter. Moreover, small business lending conditions as reported in the Credit Managers Index have improved, and the high yield and leverage loan markets remain accommodative. That said, we are not seeing signs of a break-out in growth that would cause U.S. GDP forecasts to be revised materially higher.

Policy uncertainty remains high, with tax reform unlikely in 2017. Sectors that were expected to benefit from firms repatriating cash from overseas have continued to access the debt market to fund acquisitions and debt maturities. A survey by Bank of America (Shin, John; “2017 Risk Management Survey” 7/10/2017) asked companies how they plan to use repatriated earnings, and of those that expect to benefit, 65% would use earnings to reduce debt as well as other uses such as share repurchases (46%), M&A (42%) and capital expenditures (35%).

Interestingly, the companies that have been the most aggressive buyers of their common stock have seen their stocks lag in performance relative to the broad market (S&P 500). Since the financial crisis, this has not occurred on an annual basis except in 2014. We view that constructively from a credit perspective since firms have been using debt to fund share repurchase programs.

Margins remain historically high for many sectors, with management increasingly communicating labor cost related pressures. This remains a concern of ours especially as we saw the JOLTS Quits rate for the private sector increase to a level not seen since 2006. This has been a reliable indicator in the past for predicting increasing labor costs. Sectors like Consumer Discretionary and Healthcare are particularly exposed to rising labor costs. We have been very selective within these sectors, monitoring ROE and projected revenue growth. Sectors that are more immune to rising wages include Energy, Technology, and Insurance.

Source: Factset, AAM as of 3/31/2017 (Data excludes Energy, Metals/Mining, Financials, Utilities)

QE unwind

This Fall, the market expects the ECB to announce plans to taper its bond buying program and the Fed to announce that it has begun to shrink its balance sheet. If bond buying is reduced by half, what will happen to the demand for IG fixed income? While there has been a correlation between central bank purchases and the direction of US IG credit spreads, the cause of this relationship is less certain.

Since the financial crisis, there has been less net spread product issued due mainly to the contraction in the Structured Product and Muni markets. If we see MBS spread widening related to the unwind, it could put pressure on the Corporate market. However, we believe spread widening risk is higher for MBS since the net supply related to the unwind would be material as a percentage of the total MBS net supply expected in 2017 (>50%) vs. a much larger net supply of IG Corporates (<20%)** (footnote JPM Eric Beinstein June 2017; US High Grade Credit Market Trends and Outlook)

We acknowledge this technical risk, and given lackluster valuations, maintain flexibility to add on spread widening.

Source: National central banks, Citi Research, EMFX reserve changes are FX-adjusted


Written by:

Elizabeth Henderson, CFA


Disclaimer: Asset Allocation & Management Company, LLC (AAM) is an investment adviser registered with the Securities and Exchange Commission, specializing in fixed-income asset management services for insurance companies. Registration does not imply a certain level of skill or training. This information was developed using publicly available information, internally developed data and outside sources believed to be reliable.  While all reasonable care has been taken to ensure that the facts stated and the opinions given are accurate, complete and reasonable, liability is expressly disclaimed by AAM and any affiliates (collectively known as “AAM”), and their representative officers and employees.  This report has been prepared for informational purposes only and does not purport to represent a complete analysis of any security, company or industry discussed. Any opinions and/or recommendations expressed are subject to change without notice and should be considered only as part of a diversified portfolio. A complete list of investment recommendations made during the past year is available upon request. Past performance is not an indication of future returns. This information is distributed to recipients including AAM, any of which may have acted on the basis of the information, or may have an ownership interest in securities to which the information relates.  It may also be distributed to clients of AAM, as well as to other recipients with whom no such client relationship exists.  Providing this information does not, in and of itself, constitute a recommendation by AAM, nor does it imply that the purchase or sale of any security is suitable for the recipient. Investing in the bond market is subject to certain risks including market, interest-rate, issuer, credit, inflation, liquidity, valuation, volatility, prepayment and extension. No part of this material may be reproduced in any form, or referred to in any other publication, without express written permission.

  • « Go to Previous Page
  • Page 1
  • Page 2
  • Page 3
  • Page 4
  • Page 5
  • Page 6
  • Interim pages omitted …
  • Page 17
  • Go to Next Page »

Get updates in your inbox.

  • Investment Strategies
    • Investment Grade Fixed Income
    • Specialty Asset Classes
  • Our Clients
    • Client Experience
    • Sample RFP Download
  • Insights
    • Video
    • Webinar
    • News
    • Podcasts
  • About
    • Our Team
    • Contact
    • Client Login

Disclaimer: Asset Allocation & Management Company, LLC (AAM) is an investment adviser registered with the Securities and Exchange Commission, specializing in fixed-income asset management services for insurance companies. Registration does not imply a certain level of skill or training. This information was developed using publicly available information, internally developed data and outside sources believed to be reliable. While all reasonable care has been taken to ensure that the facts stated and the opinions given are accurate, complete and reasonable, liability is expressly disclaimed by AAM and any affiliates (collectively known as “AAM”), and their representative officers and employees. This report has been prepared for informational purposes only and does not purport to represent a complete analysis of any security, company or industry discussed. Any opinions and/or recommendations expressed are subject to change without notice and should be considered only as part of a diversified portfolio. A complete list of investment recommendations made during the past year is available upon request. Past performance is not an indication of future returns. This information is distributed to recipients including AAM, any of which may have acted on the basis of the information, or may have an ownership interest in securities to which the information relates. It may also be distributed to clients of AAM, as well as to other recipients with whom no such client relationship exists. Providing this information does not, in and of itself, constitute a recommendation by AAM, nor does it imply that the purchase or sale of any security is suitable for the recipient. Investing in the bond market is subject to certain risks including market, interest-rate, issuer, credit, inflation, liquidity, valuation, volatility, prepayment and extension. No part of this material may be reproduced in any form, or referred to in any other publication, without express written permission. *All figures shown are approximate and subject to change from quarter to quarter. **The accolades and awards highlighted herein are not statements of any advisory client and do not describe any experience with or endorsement of AAM as an investment adviser by any such client.

Copyright © 2024 AAM | Privacy and Disclosures

  • LinkedIn
  • YouTube