By Elizabeth Henderson, CFA
Director of Corporate Credit

[toc]
Market Summary and Outlook
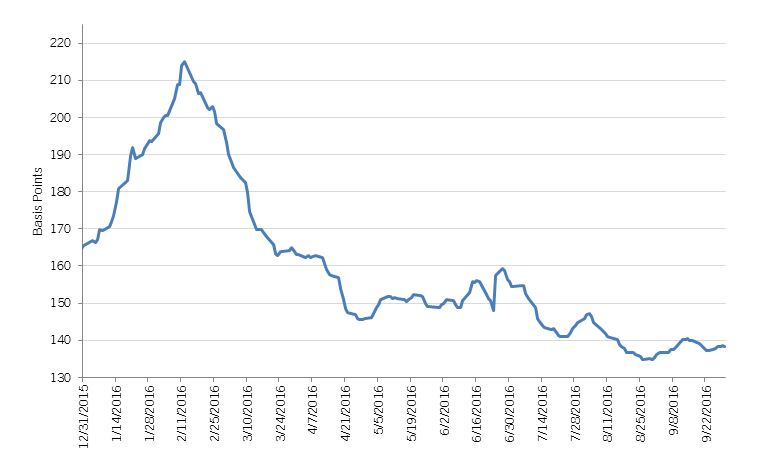
The Investment Grade (IG) Corporate bond market delivered a 1% total return in the first quarter 2017, with spreads tightening 5 basis points (bps) since year-end 2016. Risk assets outperformed, as the S&P Index increased close to 6% in the first quarter, high yield returned approximately 3%, and Emerging Markets also returned approximately 3%. After outperforming in the fourth quarter 2016, corporate bonds with maturities greater than ten years underperformed in the first quarter.
We continued to see strong demand from bond funds for investment grade securities despite volatility in high yield fund flows. Foreign buying of IG debt has fallen from the very strong levels in 2015-2016, but we continue to expect it to remain a source of demand given the yield advantage (net of hedging costs) of U.S. IG bonds. New issue supply was higher than expected to start the year, with companies accessing the market in anticipation of higher rates, a modest headwind for spreads.
The Option-Adjusted Spread (OAS) is approaching our target for the year; therefore, we expect returns to be generated largely from income over the near term. Our base case expects stable to improving commodity prices, approximately 2% domestic economic growth, containment of risks overseas, regulatory relief in the U.S., and some tax relief. If risks to our base case increase to the downside, we would expect spreads to widen as Treasury yields fall. However, we believe the risk of material spread widening due to an increase in default risk is low given the availability of credit and low probability of a recession. Uncertainty should keep event (and ratings) risk more subdued as well.
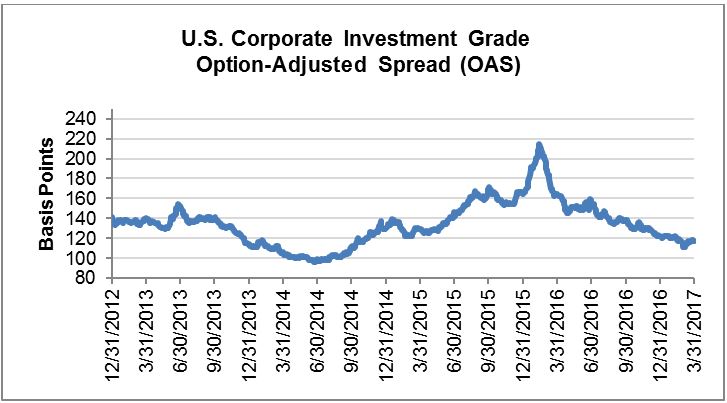 Source: Bloomberg Barclays, AAM
Performance Summary and Year-to-Date
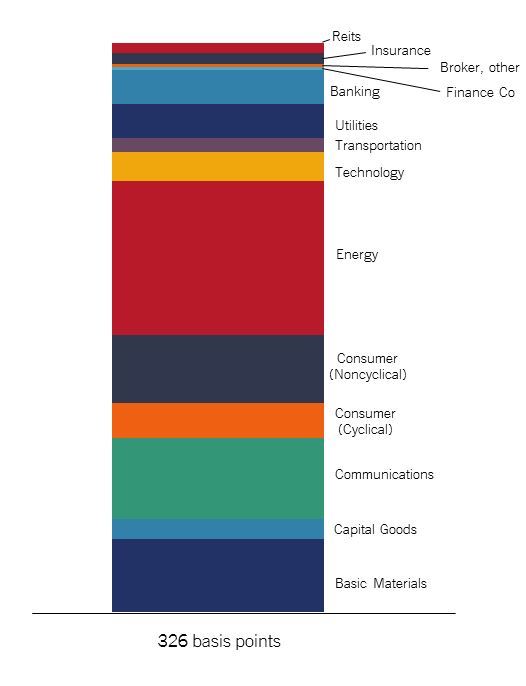
The driver of returns for Investment Grade Corporates in the first quarter 2017 was primarily coupon income with spreads starting the year at relatively low levels. Performance has been driven primarily by the higher yielding sectors, Energy and Basic Materials, as well as Financials that tightened due to the prospect of higher interest rates and regulatory relief. For Metals and Mining, metals prices stabilized due to supply disruptions caused by weather and political issues and solid Chinese economic data. This coupled with credit rating upgrades drove tighter spreads for Metals and Mining issuers. The risk of debt funded acquisitions caused the Telecom/Media/Technology sector to underperform even though it is one of the wider spread sectors.
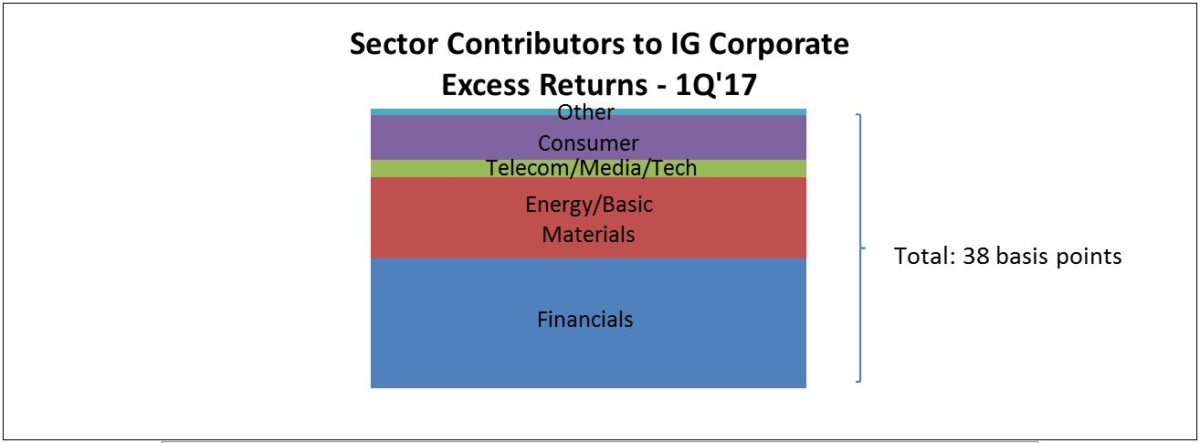
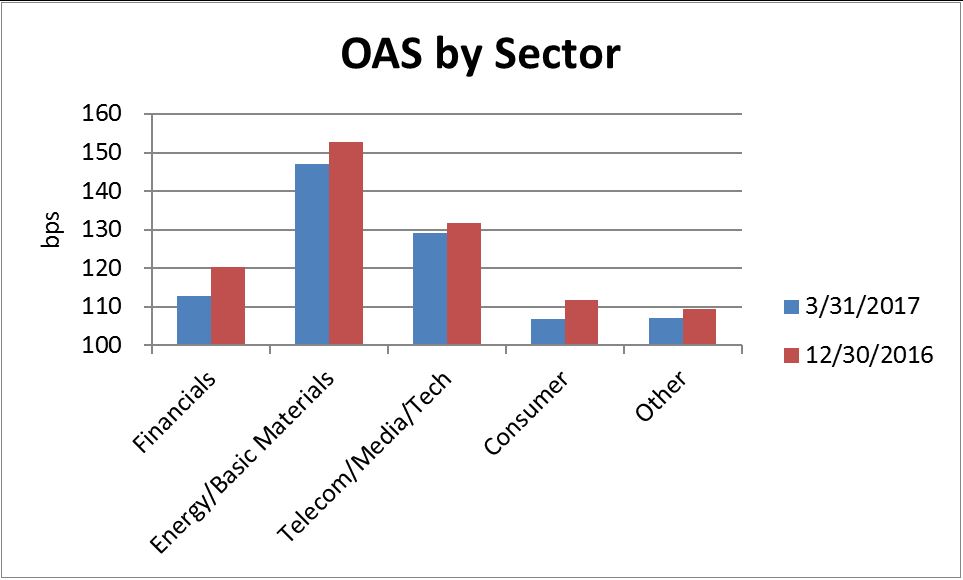 Source: Bloomberg Barclays Index (as of 3/31/2017), AAM
Credit Fundamentals Expected to Improve From Cyclically Weak Levels
Credit metrics continued to weaken in 2016, as EBITDA growth did not keep up with rising debt levels, resulting in debt leverage to increase once again. That said, companies became more parsimonious with debt leverage in the second half of 2016 in response to the capital markets closing and spreads widening meaningfully with a rising probability of a recession earlier in 2016.
- We project improving revenue and EBITDA growth in 2017 driven mainly by:
Higher commodity prices, benefitting energy and basic material issuers - Higher interest rates relative to 2016 and modest loan growth, benefitting banks
- Improving emerging market economies, consumer demand for PCs and smartphones (iPhone 8, new features), and investment in cloud infrastructure, benefitting technology issuers.
Optimism remains elevated post the election, and analyst estimates for EBITDA and capital spending for the majority of sectors remains higher as well. Entering 2017, our outlook for credit fundamentals was generally positive except for a handful of sectors where we expected growth to disappoint (e.g., Autos, Retail, Cable). Growth disappointments related to secular challenges or cyclical slowdowns keep event risk (and thus, ratings risk) elevated. For example, after a disappointing fourth quarter and forecast, S&P downgraded Under Armour from investment grade to high yield.
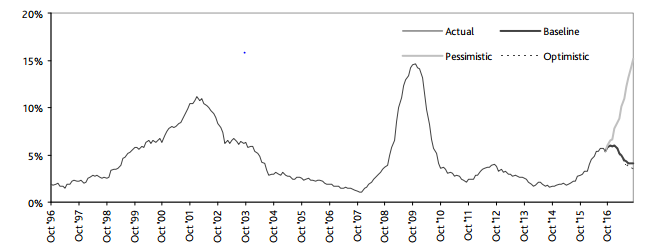
Default Risk Falls
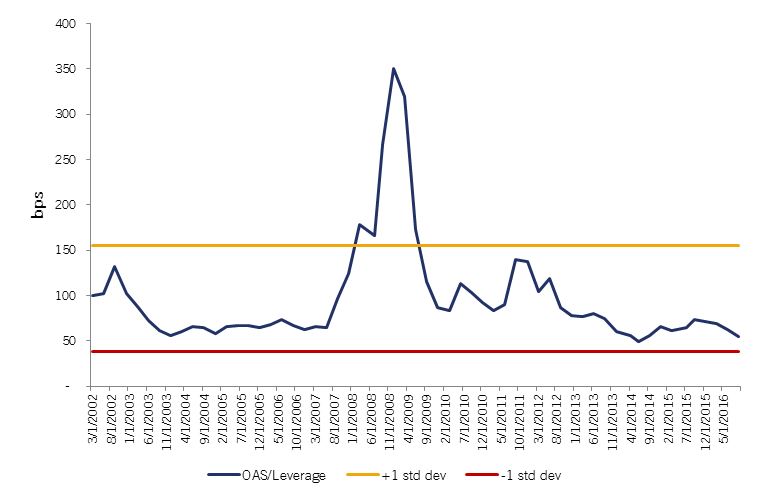
We expect the default rate to fall in 2017 due to higher commmodity prices and a much improved credit market. Bank standards have loosened, yields have fallen (high yield, investment grade and emerging markets), and the leveraged loan market is wide open after being closed for a period of time in 2015-2016. Demand is especially strong for leveraged loans, causing spreads to tighten in CLOs and bank loans. This has resulted in loan refinancings and investor willingness to accept looser covenants (“covenant lite”). Lastly, the Credit Manager Index continues to reflect a favborable environment for non-bank lenders.
The credit cycle, which had appeared to have peaked in late 2015, has been rejuvenated. Until we see evidence of credit contraction, we expect spreads to remain range bound (OAS between 110 – 140 bps).
Rating Stability Expected
The credit rating of the IG Corporate market has fallen over the last ten years as the percentage of BBB rated securities has increased due primarily to: (1) rating downgrades as companies take advantage of lower rates to increase shareholder returns (share repurchase, M&A), (2) changes in rating methodologies in the Finance sector post the financial crisis, and (3) an increase in the number of non-Financial issuers, which tend to be capitalized with more debt.
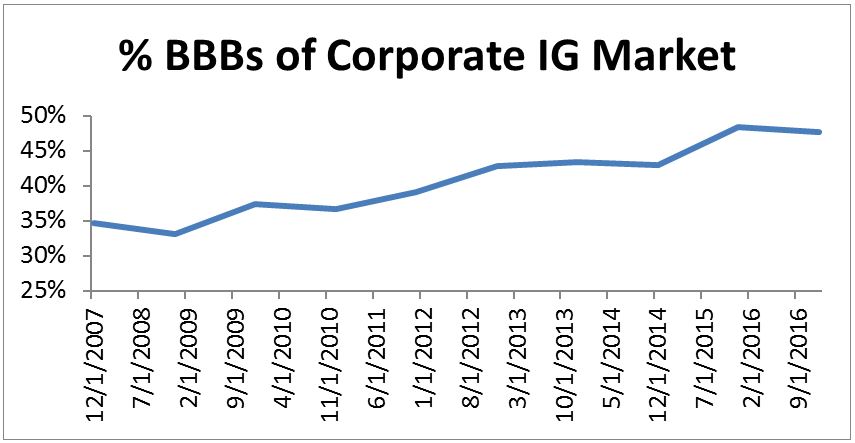 Source: Bloomberg Barclays (based on market values); AAM
Tax policy is uncertain, and the changes being discussed have varying consequences to IG issuers. While we have an understanding of how this may affect firms in various industries, we (and management teams) are at a standstil until there is more clarity on what is likely to pass. At this point, we do not expect meaningful changes to the tax code with a modest reduction in the corporate tax rate most likely. Except for industries that face structural issues such as Retail, we expect ratings to remain largely stable in this period of uncertainty despite a historically flat WACC curve by credit rating.
Market supply and demand technicals remain supportive
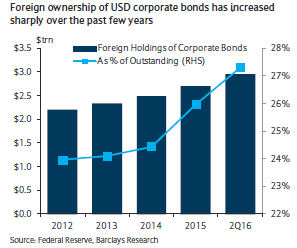
Insurance and Pension Funds, traditional holders of corporate bonds, increased purchases in 2016, on the prospect of increased rates and because competing asset classes were less attractive. Comparatively, money market funds sold corporate bonds due to money market reform. But, the real story was the increase in demand from foreign investors. Foreign ownership of corporate bonds has been rising over the past twenty years with an acceleration over the past couple years given very low (or negative) interest rates in overseas markets. Buying was especially strong from European investors, as the ECB included corporate bonds in its bond buying program, causing yields and supply to fall.
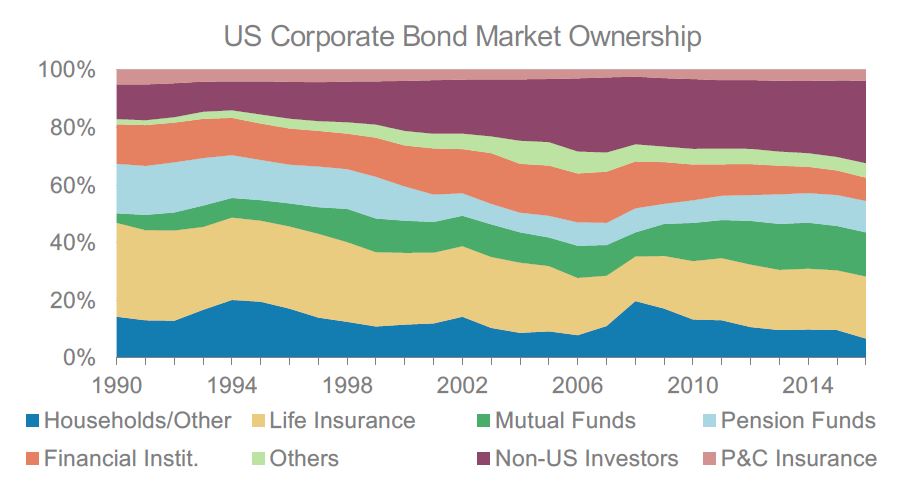
Source: Morgan Stanley
What do we expect this year from foreign buyers? We believe the political and geopolitical uncertainty in Europe will support an accomodative ECB and keep rates low over the near term. The risk is that the ECB becomes more hawkish due to higher than expected economic growth or inflation. We do not believe that risk is incorrectly priced today.
The other technical benefit to IG corporate bonds today is the relative attractiveness to fixed income asset classes such as Structured Products and Municipals, which have experienced spread tightening year-to-date. Moreover, with equity valuations rising and credit spreads tightening in risk sectors such as high yield and emerging markets, it increases the relative attractiveness of IG corporate bonds.
One risk over the near-to-intermediate term is related to balance sheet management by the Fed. Mutual Funds reduced their holdings of MBS after 2008 (per Fed Flow of Funds data), increasing their allocation to credit. If a Federal Reserve unwind of its QE program makes Treasuries and/or Mortgage Backed Securities (MBS) more attractive then a subsequent rotation out of credit and into MBS by fund managers would likely put pressure on corporate spreads.
Written by:
Disclaimer: Asset Allocation & Management Company, LLC (AAM) is an investment adviser registered with the Securities and Exchange Commission, specializing in fixed-income asset management services for insurance companies. Registration does not imply a certain level of skill or training. This information was developed using publicly available information, internally developed data and outside sources believed to be reliable. While all reasonable care has been taken to ensure that the facts stated and the opinions given are accurate, complete and reasonable, liability is expressly disclaimed by AAM and any affiliates (collectively known as “AAM”), and their representative officers and employees. This report has been prepared for informational purposes only and does not purport to represent a complete analysis of any security, company or industry discussed. Any opinions and/or recommendations expressed are subject to change without notice and should be considered only as part of a diversified portfolio. A complete list of investment recommendations made during the past year is available upon request. Past performance is not an indication of future returns. This information is distributed to recipients including AAM, any of which may have acted on the basis of the information, or may have an ownership interest in securities to which the information relates. It may also be distributed to clients of AAM, as well as to other recipients with whom no such client relationship exists. Providing this information does not, in and of itself, constitute a recommendation by AAM, nor does it imply that the purchase or sale of any security is suitable for the recipient. Investing in the bond market is subject to certain risks including market, interest-rate, issuer, credit, inflation, liquidity, valuation, volatility, prepayment and extension. No part of this material may be reproduced in any form, or referred to in any other publication, without express written permission.
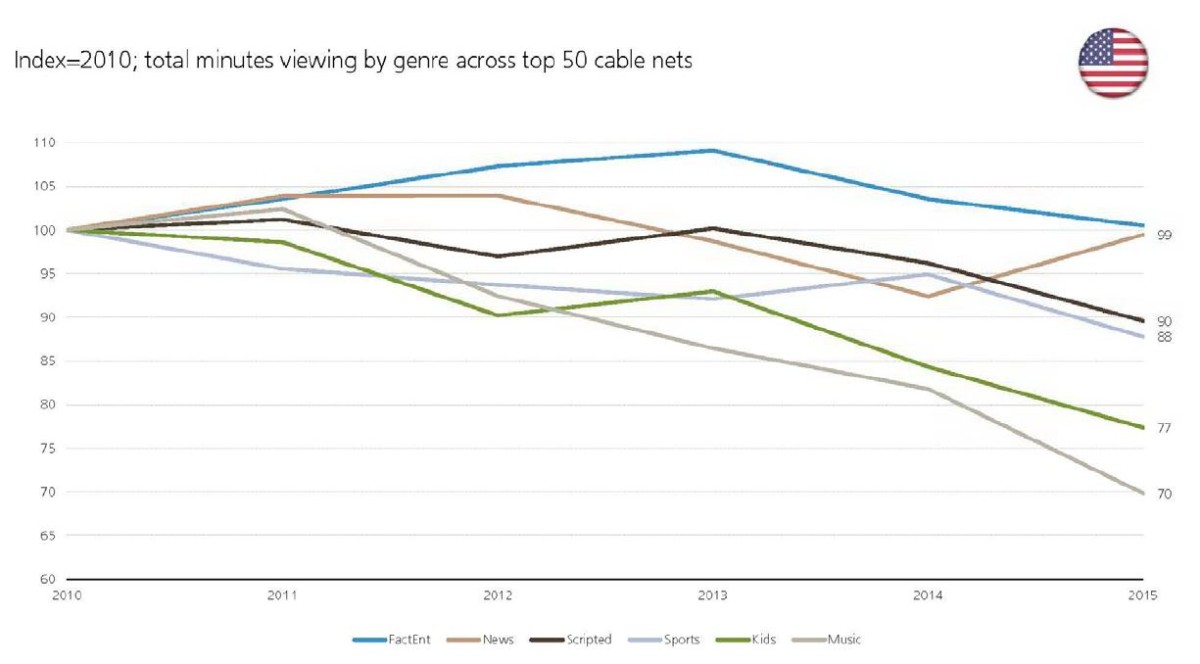 Source: UBS, Nielsen; Top 50 channels includes 12 factual entertainment networks (e.g., Discovery, History); 18 scripted networks (e.g., AMC, FX, USA, TBS); 7 kids networks (e.g., Nickelodeon, Disney Channel); 4 news networks; 3 sports networks; 2 music networks.
 Source: AAM
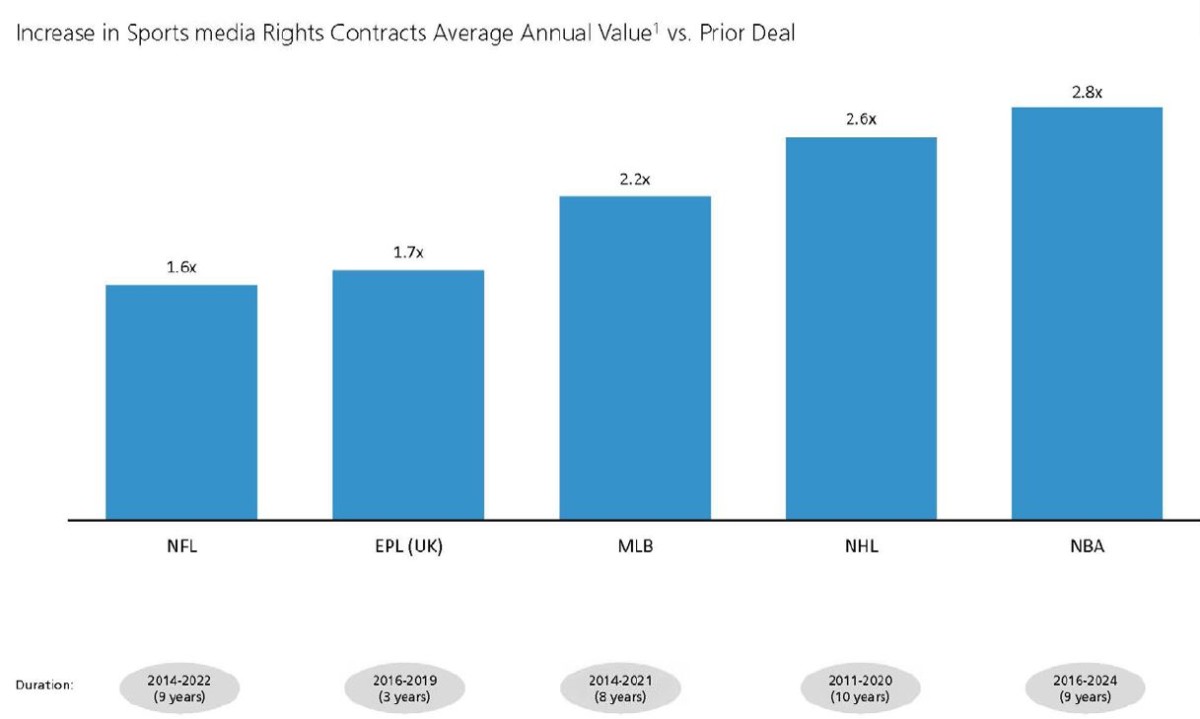 Source: Liberty Media