• Skip to primary navigation
  • Skip to main content
  • Skip to footer
AAM CompanyTransparent Logo

AAM Company

AAM Company Website

  • Investment Strategies
    • Investment Grade Fixed Income
    • Specialty Asset Classes
  • Clients
    • Our Clients
    • Client Experience
    • Download Sample RFP
  • Insights
    • Video
    • Webinars
    • Podcasts
    • News
  • About
    • Our Team
    • Events
  • Login
  • Contact Us
Contact

Corporate Credit

April 21, 2015 by

A couple of weeks ago Teva held a call to announce the company’s acquisition of Auspex for about $3 billion.  During the call, Teva’s CEO, Erez Vigodman, commented that “if the right large transaction shows itself, we might be engaged.” He wasn’t kidding!

This morning, Teva announced an offer for Mylan. The offer is for $82/share in cash (50%) and stock (50%), which equates to around $40 billion plus about $8.5 billion in assumed Mylan debt. Proforma 2016 leverage increases from 2.0X to 4.2X, not including synergies or asset sales.  If a deal goes through, we would expect credit rating downgrades.  Current ratings are A3/A-/BBB+.

Following rumors last week, Mylan publically announced the company would not be interested in selling to Teva.  Complicating the situation, Mylan made a $29 billion offer for Perrigo on April 8, 2015.  Strategically, we think a Teva/Mylan transaction would be positive.  A transaction of this size would help to insulate Teva from the recent generic approval of its blockbuster Multiple Sclerosis drug, Capoxone (20mg dose).  We believe this situation is far from over.  Clearly, Mylan is not a willing participant.  Laws/defense tactics in the Netherlands do not support hostile takeovers, so the transaction would most likely need to be “friendly.”  Also, a few weeks ago, Mylan put a poison pill in place to make a takeover difficult.  In addition, we believe there could be anti-trust issues.

There are many scenarios that could play out, including a sweetened offer from Teva.  Other large pharmaceutical companies could step in and make an offer for Mylan, Perrigo, or both.  Perhaps the deal falls through completely.  In that case, we believe Teva hunts for another large company. Most analysts agree that a Teva/Mylan transaction makes sense over a Mylan/Perrigo merger.  We think Mylan board members will be hard pressed to consider a transaction with Teva, especially if the valuation is improved.

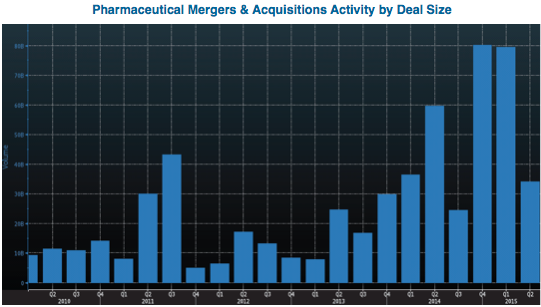
The graph below illustrates just how active mergers and acquisitions have been in the pharmaceutical space over the last two years.  We expect 2015 to be another record year.  Limited organic growth is being offset by acquisitions which are being financed with large cash balances and low interest rate debt. Despite the releveraging that we expect to take place, the sector has significant capacity to add debt given solid balance sheets and strong cash flow generating abilities.  While this trend is typically not good for credit ratings and spreads, we believe the business risk of the sector is improving as operations become better diversified and growth prospects are improved.  We continue to position portfolios to take advantage of attractively priced opportunities.

Source: Bloomberg
Source: Bloomberg


Michael J. Ashley
Principal and Senior Corporate Credit Analyst
Disclaimer: Asset Allocation & Management Company, LLC (AAM) is an investment adviser registered with the Securities and Exchange Commission, specializing in fixed-income asset management services for insurance companies. This information was developed using publicly available information, internally developed data and outside sources believed to be reliable. While all reasonable care has been taken to ensure that the facts stated and the opinions given are accurate, complete and reasonable, liability is expressly disclaimed by AAM and any affiliates (collectively known as “AAM”), and their representative officers and employees. This report has been prepared for informational purposes only and does not purport to represent a complete analysis of any security, company or industry discussed. Any opinions and/or recommendations expressed are subject to change without notice and should be considered only as part of a diversified portfolio. A complete list of investment recommendations made during the past year is available upon request. Past performance is not an indication of future returns.

This information is distributed to recipients including AAM, any of which may have acted on the basis of the information, or may have an ownership interest in securities to which the information relates. It may also be distributed to clients of AAM, as well as to other recipients with whom no such client relationship exists. Providing this information does not, in and of itself, constitute a recommendation by AAM, nor does it imply that the purchase or sale of any security is suitable for the recipient. Investing in the bond market is subject to certain risks including market, interest-rate, issuer, credit, inflation, liquidity, valuation, volatility, prepayment and extension. No part of this material may be reproduced in any form, or referred to in any other publication, without express written permission.

April 10, 2015 by

Big Changes Announced This Morning by General Electric & Co. (GE) Today.

The company announced this morning that it will exit all of its stand alone financial services businesses by Year End 2018 via sales and/or spin-offs.  This is a capital allocation decision and represents a dramatic reversal of the build-up of General Electric Capital Corp (GECC) into a non-bank finance behemoth during the Jack Welch years.  Directionally, the move is unsurprising as the vulnerabilities exposed during the global financial crisis, and the financial regulations and investor discount imposed in subsequent years, have been a drag on returns.  However, the dramatic and material move to exit the bulk of the GECC businesses is a surprise, notwithstanding GE’s willingness to engage in transformational activities over the years (those GECC units that directly support the industrial businesses will be retained; aircraft leasing, energy financial services, healthcare finance).

IMPORTANTLY, because of the way GE is structuring the exit, this will be a net credit positive for bondholders.  The historic support mechanism between parent GE and GECC was an income maintenance agreement (IMA) and the repeated assurance that GECC was a core strategic business for consolidated GE (but no explicit guarantee).  Concurrent with today’s announcement, GE has amended the IMA to fully guarantee all tradable senior and subordinate debt of GECC, as well as all outstanding commercial paper.  The company also stated that they expect no new issuance out of GECC for at least five years.  As a result, GECC net debt outstanding is expected to fall from around $275 billion currently to roughly $70 billion at Year End 2018.  The combined fundamental (full guarantee) and technical (dwindling supply) supports meant that spreads should continue to tighten (15 basis points tighter today).

GECC bonds have performed well over the past several years, and tightened further today following the announcement.  We expect that these bonds should continue to outperform given supportive technicals, and no immediate fundamental concerns.  Although GE could ultimately lever the balance sheet in pursuit of more optimal shareholder returns, they appear to be focused on repaying debt, maintaining liquidity and pursuing only bolt-on acquisitions over the next several years (Alstom notwithstanding).

As a side note, S&P affirmed GE’s AA+ rating while Moody’s downgraded GE to A1 (equalizing it to the GECC rating).

N. Sebastian Bacchus, CFA
Vice President, Corporate Credit

December 2, 2014 by

Excess returns of the energy sector have significantly lagged the investment grade corporate market in 2014 due to the unexpected decline in crude oil prices.  Credit profiles of those companies in the energy sector are highly dependent on oil prices and a thorough review of the fundamentals of oil is warranted.  In this paper we describe the factors affecting supply and demand of oil. Given that there are many variables affecting both supply and demand, we narrowed our review to the issues we believe will most affect crude oil in 2015: Libyan supply and the recent OPEC decision, Russian production, domestic oil shale production; demand from China, the European Union (EU) and the U.S.  We conclude our analysis by reviewing the marginal cost of supply of crude oil, which suggests the floor for prices is about $40 per barrel in a worst case scenario.  


The price of oil has declined more than 25% in the past quarter (Exhibit 1) in a pattern that resembles similar moves from 1998 and 2012.  In 1998, oil continued to decline for more than a year, only rebounding once OPEC gained discipline and reduced production.  In 2012, the price decline was relatively short-lived, as market concerns regarding Europe were offset by the Arab Spring induced supply curtailment.  Our opinion is that this decline will resemble the price movements of 2012, not 1998 or 2008.

Source: AAM, Bloomberg

Libyan Supply

At the beginning of 2014, there were several issues at the center of the debate about Middle Eastern crude oil supply: Libyan production, Iranian sanctions and concerns that the Syrian civil war would spill over to Saudi Arabia and Iran.  Given the instability in that region throughout the past three years, it appeared that the risk of a supply disruption was much greater than the prospect of an increase in production.

However, OPEC unexpectedly added more than 1 million barrels of oil per day (>1%) to the market since oil prices peaked in June 2014.  The country most responsible for adding supply has been Libya, where production increased more than 600,000 per day (Exhibit 2).  In our opinion, the big spike in Libyan production is the single biggest factor for the decline in oil prices since June 2014 since it was largely unexpected.

Source: AAM & Energy Information Agency

We are skeptical that Libyan production can be maintained at the current 850,000 barrel per day level in 2015 due to the violence in the region along with a lack of financial and human capital devoted to operations.  In mid-November, armed opponents of the existing government took control of the country’s largest oil field, the 200,000 barrel per day El Sharara in southwest Libya (Exhibit 3).  Additionally, unreliable power to the El Feel field near the Algerian border is curtailing production there.

Source: Energy Information Agency

Furthermore, three of the four largest service companies revealed in their third quarter 2014 earnings call that they are not engaged in Libya currently, which suggests future production will very likely decline.  Halliburton management stated, “Libya’s down for the count right now”; Weatherford management commenting on Libya stated, and “Our activity has effectively halted.” Schlumberger management commented that Libya “continues to be challenging with a very complex security situation and with activity remaining at the minimal level. We are currently carefully evaluating our operational structure in the country and will resize resources in accordance with the 2015 activity outlook.”  Other operators such as ConocoPhillips and OMV were equally pessimistic about production.  As a result, we believe Libyan production, which has averaged about 436,000 barrels per day this year could easily be cut by 20%.

OPEC’s Dilemma

Many believe that a cut in OPEC production will help to stabilize crude oil prices.  However, Saudi Arabia has made it clear in recent months that any cuts to OPEC production will have to be multilateral across all members and that it will not be the sole responsibility of the Saudis.  This is a difficult proposal to accept for many OPEC members, particularly Iran, Libya and to a lesser extent Iraq.  As Exhibit 4 indicates, Iran and Libya are not currently producing near their recent peak capacity.  However, Saudi Arabia is still producing at the same high levels as when the Kingdom supported the international community’s release of oil from strategic petroleum reserves to fend off supply fears during the Arab Spring.

Source: AAM & Energy Information Agency

Saudi Arabia clearly won the debate with other OPEC members at the semiannual meeting in Vienna on November 27th.  OPEC surprisingly kept its oil production quota of 30 million barrels per day unchanged, which implies a cut in actual production of only about 300,000 barrels per day if members adhere to their quotas.  We agree with those who have speculated that Saudi Arabia and OPEC are no longer willing to shoulder the burden as a swing producer to higher cost competition.  Nevertheless, this is a painful decision for most members of OPEC due to their dependence on oil revenues to meet governmental budgets.  Should oil prices remain in the $60 per barrel range for more than one quarter, we expect OPEC to revisit this most recent decision and possibly be joined by non-OPEC members in a production cut.

Russian Supply

Russia is the third largest producer of oil (including lease condensate) in the world at more than 10 million barrels per day, behind only the U.S. and Saudi Arabia.  Given the turmoil in Russia, we believe it is useful to review its production profile from the 1997 to 1999 period when the macroeconomic environment bore some similarities to today.  Recall that in 1998, oil prices declined by more than 50% to $10 per barrel, the ruble was under intense pressure and Russia eventually defaulted on its domestic debt.  Many had forecast Russian oil production to rise in response to the weaker ruble back then and  Russian oil producers wanted to take advantage of this scenario.  However, it took a full two years and high oil prices for production from Russia to actually increase as Exhibit 5 suggests.

Source: AAM, Bloomberg & Energy Information Agency

Not only is Russia facing the macroeconomic headwinds from 20 years ago, it is now also facing sanctions from the U.S. and the EU.  On September 12, 2014, the U.S. Treasury imposed sanctions that prohibit the exportation of goods, services (not including financial services), or technology in support of exploration or production for Russian deep water, Arctic offshore, or shale projects that have the potential to produce oil, to five Russian energy companies – Gazprom, Gazprom Neft, Lukoil, Surgutneftegas, and Rosneft – involved in these types of projects.  This measure complements restrictions administered by the Commerce Department and is similar to new EU measures published that same day.  The weakened ruble, the recently imposed sanctions, historical precedent and much weaker commodity prices suggest Russian production should decline in 2015.

Domestic Supply

The biggest contributor to worldwide crude production growth in 2014 was the U.S. and more specifically, the Eagle Ford Shale in southern Texas, the Permian Basin in west Texas and the Bakken Shale in North Dakota.  While the growth was expected by the marketplace, the efficiency and cost improvements have been surprising.  In just over one year, production from these regions has increased by 1 million barrels per day and is largely responsible for U.S. production reaching more than 13 million barrels per day including lease condensate.  Moreover, the time to complete the wells is declining as are costs.  Based on a bottom up analysis of the key producers in those domestic regions we believe that production should increase by more than 800,000 barrels per day in 2015 (see Exhibit 6), even in a $75 per barrel environment.

Screen Shot 2016-01-27 at 16.13.52
Source: AAM, Company reports and Morgan Stanley Shale Data Book – Fall 2014, Volume 3

Based on the analysis above of the regions we believe will be key in 2015, we are forecasting worldwide production of about 92 million barrels per day, which is basically flat from the second quarter of 2014.  In addition to the regions we highlighted above, we believe that modest production growth could come from Canada and Brazil.

Global Demand for Crude Oil

We base our oil consumption forecast on the International Monetary Fund (IMF) worldwide GDP estimate, which for 2015 is 3.8%.  Based on data since 1970, about 48% of the variability in oil consumption is explained by changes in GDP, which is shown in Exhibit 7.  Using this regression equation, we are forecasting oil consumption of slightly more than 92 million barrels per day in 2014.  If worldwide economic growth in 2015 is near 3.8% as the IMF suggested in October 2014, then oil consumption should exceed 93 million barrels per day in 2015.  If we use a more conservative 2.8% for 2015 worldwide economic growth, oil consumption would approach 93 million barrels per day.

Many market participants have cast a skeptical eye at the latest growth forecasts out of the IMF due to expected weakness from China and worse than expected results from Europe.  In fact, we would not be surprised to see the IMF revise down their 2015 growth forecast in April of next year.  However, we note that worldwide economic growth would have to be cut in half from its current estimate for expected oil consumption to be flat from the expected 92 million barrels per day in 2014.

Equally important, since 1970 there have been seven years when year-over-year oil consumption actually declined (1974-1975, 1981-1984 and 2008).  The average global economic growth during those years was just under 2% and the U.S. was in recession in five of those seven periods.

Source: AAM, International Monetary Fund and Energy Information Agency

China Consumption

Many market participants are concerned about China demand and justifiably so as current China oil consumption represents a larger percentage (11%) of global demand than any other time in history.  As shown in Exhibit 8, Chinese consumption has been increasing since the late 1980’s.  While there have been five occasions since 1980 when consumption actually decreased year over year, the average decrease was only 60,000 barrels per day and the maximum decrease was 83,000 barrels per day in 1990.

We are of the opinion that the pace of China’s economic growth will slow, (the IMF estimate of 7.3% seems high, but it’s still growth).  Similarly, we believe that Chinese oil demand may not grow meaningfully in 2015, but we are skeptical that consumption will actually decline by a substantial amount.

Source: AAM, International Monetary Fund and Energy Information Agency

EU Consumption

The data suggests that consumption from the EU is deteriorating the most of all regions, with demand in 2014 about 200,000 barrels per day lower than the previous year.  Estimating EU consumption using historical data is difficult because there is a limited track record of EU GDP and oil consumption.  Moreover, the correlation coefficient between the two variables is weak, making predicting future demand based on economic growth impractical.  Nevertheless, our estimate is based on the recent trend, which suggests consumption may be 250,000 barrels per day lower in 2015.

Source: AAM and Energy Information Agency

U.S. Consumption

The U.S. is the largest consumer of oil in the world at 19 million barrels per day and its consumption is largely influenced by economic growth.  Exhibit 10 shows the relationship between economic growth and oil consumption in the U.S.  Since 1980, there has been only one year in which economic growth in the U.S. was at least 3% and oil consumption did not increase – that was 1983.  Based on the regression analysis of data from the last 35 years, consumption should increase as long as U.S. GDP is at least 2.4%.  In fact, AAM expects the U.S. economy to grow 3% in 2015, which implies that oil consumption in the U.S. should rise by about 100,000 barrels per day.

Source: AAM, International Monetary Fund and Energy Information Agency

Marginal Cost of Supply

The pace at which oil prices have declined from the recent peak clearly suggests that the market believes that either supply is much greater and/or demand is much less than 92 million barrels per day.  An analysis of marginal cost of supply of crude oil provides investors a basis to understand at which price point existing production becomes unprofitable.  While we are not forecasting a scenario where production has to be “shut-in,” a review of marginal cost of supply is worthwhile (Exhibit 11).  The chart describes the cumulative worldwide production along the X-axis, the marginal cost of supply on the Y-axis and the cost of an existing producing well in these different regions.  Though capital might stop flowing to new exploratory efforts in a sub-$70 per barrel environment affecting future production, Exhibit 11 shows that oil would have to decline to $50, before current production from Kazakhstan and the Canadian oil sands wells would be uneconomic.

Source: Morgan Stanley; OPEC Outlook: Some Perspective Is Required

Based on the above analysis, we believe supply in 2015 will approximate 92 million barrels per day and demand should be at least 92 million barrels of oil per day, which is supportive for crude oil prices.  Many domestic companies recently described in detail their production plans for 2015, which we believe they will achieve adding to overall supply.  However, we are concerned that the instability in Libya and economic conditions in Russia will more than offset the domestic supply gains.  We expect oil consumption to rise in 2015 based on a conservative economic growth forecast of 2.8% versus the International Monetary Fund’s 3.8%.  While European consumption will continue to contract, Chinese and U.S. consumption should mitigate that loss.

Patrick McGeever
Senior Analyst, Corporate Credit


For more information, contact:

Colin T. Dowdall, CFA
Director of Marketing and Business Development
colin.dowdall@aamcompany.com

John Olvany
Vice President of Business Development
john.olvany@aamcompany.com

Neelm Hameer
Vice President of Business Development
neelm.hameer@aamcompany.com


Disclaimer: Asset Allocation & Management Company, LLC (AAM) is an investment adviser registered with the Securities and Exchange Commission, specializing in fixed-income asset management services for insurance companies. This information was developed using publicly available information, internally developed data and outside sources believed to be reliable.  While all reasonable care has been taken to ensure that the facts stated and the opinions given are accurate, complete and reasonable, liability is expressly disclaimed by AAM and any affiliates (collectively known as “AAM”), and their representative officers and employees.  This report has been prepared for informational purposes only and does not purport to represent a complete analysis of any security, company or industry discussed. Any opinions and/or recommendations expressed are subject to change without notice and should be considered only as part of a diversified portfolio. A complete list of investment recommendations made during the past year is available upon request. Past performance is not an indication of future returns.

This information is distributed to recipients including AAM, any of which may have acted on the basis of the information, or may have an ownership interest in securities to which the information relates.  It may also be distributed to clients of AAM, as well as to other recipients with whom no such client relationship exists.  Providing this information does not, in and of itself, constitute a recommendation by AAM, nor does it imply that the purchase or sale of any security is suitable for the recipient. Investing in the bond market is subject to certain risks including market, interest-rate, issuer, credit, inflation, liquidity, valuation, volatility, prepayment and extension. No part of this material may be reproduced in any form, or referred to in any other publication, without express written permission.

October 15, 2014 by

Investment Grade Corporate Credit Remains Resilient Despite Heightened Volatility

By Elizabeth Henderson, CFA
Director of Corporate Credit

Elizabeth Henderson

[toc]

Market volatility has increased, and although investment grade corporate bonds outperformed riskier asset classes such as high yield (-1.9%) during the third quarter, spread volatility increased modestly.

In this newsletter, we support our near term outlook for corporate credit by focusing on two important drivers of expected performance for the fourth quarter 2014: energy prices and consumer spending. We expect spreads to tighten over the near term, as U.S. GDP growth meets or exceeds expectations and as oil prices stabilize. We also expect the negative market technicals we experienced in September to reverse. Lastly, we close the newsletter with a brief discussion of the private placement market. The biggest near term risk to our forecast is a retrenchment by the consumer due to Ebola concerns.

Corporate credit spreads widened due to falling commodity prices and technical pressure

Corporate credit spreads widened 13 basis points (bps) (Exhibit 1) in the third quarter with the majority of the widening taking place in September. Market volatility increased due to the uncertainties regarding the timing of Federal Reserve interest rate increases, geopolitical issues, the Ebola virus, and the impact slowing European and China growth will have on company fundamentals. Specifically, in regard to the Investment Grade (IG) Corporate bond market, we believe spread widening was driven more by: 1) lower commodity prices, affecting the Energy and Metals and Mining sectors, and 2) weaker market technicals. The expected supply of bonds increased due to a larger than expected amount of new bonds issued by companies in September ($70 billion for the first eight days in September versus a monthly estimate of $100 billion) as well as the threat of selling as a result of the changes at PIMCO.   In early October, spreads stabilized with demand increasing from mutual funds. However, entering mid-October, Treasury yields are falling and spreads are increasing in reaction to weaker than expected economic data and Ebola concerns.

Exhibit 1

AAM Corp Credit Fall-2014 1

Source: Barclays, AAM


Exhibit 2: Weekly mutual fund net flows in HG credit funds

AAM Corp Credit Fall-2014 2

Source: BofA Merrill Lynch Global Research, EPFR

The IG Corporate market generated 0.2% total return (-0.8% excess return) in the third quarter, as represented by the Barclays Corporate Index. As investors fled to higher quality securities, BBB rated securities generally underperformed (Exhibit 3), widening the basis between A and BBB rated Industrial securities from 44 bps at the end of the second quarter to 50 bps. Spread volatility picked up slightly in the third quarter, but still remains very low at 6 bps year-to-date.

Exhibit 3

AAM Corp Credit Fall-2014 3

Source: Barclays, AAM (YTD as of 10/9/14)

Last quarter, we wrote that we believed defensive, not bearish, positioning was appropriate given the low spread levels and increasing idiosyncratic risks. One can see the benefits of a more defensive portfolio, as shown by Exhibit 4, detailing the number of tickers that had excess returns greater or less than the mean. It is clear that last month’s performance was driven by a number of mid-to-low BBB credits, mainly in the Energy and Metals and Mining sectors.

Exhibit 4

AAM Corp Credit Fall-2014 4

Source: Barclays, AAM

Economic growth is accelerating from a weather driven first half of the year

Third quarter GDP for the U.S. is estimated at 3%, and domestic economic data has surprised to the upside in the third quarter. Importantly, the JOLTS (Job Openings and Labor Turnover) survey continues to report a higher level of job openings, now on par with what we experienced in 2001 (Exhibit 5). The rate at which employees quit their jobs (“quit rate”), a measure analyzed by the Fed, continues to lag. We note that the correlation between job openings and quit rate is quite high (0.8, using data since 2000); therefore, one could expect the quit rate to increase. Based on a regression analysis, about one third of wage growth can be explained by the quit rate with a correlation of 0.6. We continue to watch these measures closely since rising wage growth at a time of weak worldwide economic growth would negatively impact credit quality and result in wider spreads. We would expect rising wage growth to positively impact domestic economic growth, helping offset overseas weakness.

Exhibit 5

AAM Corp Credit Fall-2014 5

Source: Bureau of Labor Statistics

In terms of economic growth in the fourth quarter of 2014, we expect consumer spending to accelerate, buoyed by higher savings and net worth, available credit, lower gasoline and food prices, rising consumer confidence as well as an improving job market. Risks to this forecast include increased geopolitical risk, unfavorable weather, and/or an increase in Ebola cases in the U.S. or surrounding countries.

In addition to the consumer’s contribution to growth in the fourth quarter, we see positive signs for continued growth in the industrial segment with rail car loadings continuing to climb throughout the year (Exhibit 6).

Exhibit 6

AAM Corp Credit Fall-2014 6

Source: Association of American Railroads, AAM

AAM expects oil prices to stabilize and the price of natural gas to decrease

 Our oil forecast of $90 – $95/barrel for WTI over the near term is based on three key items: worldwide consumption, supply and the marginal cost producer (oil sands in Canada and the Bakken Shale). Our forecast of consumption is based on a regression of worldwide oil consumption and GDP since 1970. The International Monetary Fund (IMF)’s worldwide GDP estimate for 2015 is 3.8%, which suggests worldwide oil consumption should increase by about 3% or about 3 million barrels to more than to 95 million barrels per day.

Incremental worldwide supply in 2015 will come from the Bakken Shale in North Dakota, the Permian Basin in west Texas, the Eagle Ford Shale in south Texas (+1.5 million barrels per day) and western Canada (0.4 million barrels per day); potential disruptions in Libya, along with declines in Russia, Mexico and the North Sea should largely offset the production increase in North America.

To meet the 95 million barrels per day of demand in 2015, we believe production from places like the Bakken Shale and the oil sands in Canada will be necessary. We believe that production from those regions require about $90-$95 per barrel to generate a 10% return   (Exhibit 7).

­­ Exhibit 7

AAM Corp Credit Fall-2014 7

Note: Reserves determine bubble size.

Source: Wood Mackenzie (August 2014), Barclays Research

Our forecast for Henry Hub Natural Gas is $4.00 per MMBtu (million British thermal units). We believe 2015 natural gas demand will be approximately flat with 2014 levels based on a normalized weather pattern (less consumption). Our demand forecast is based on a regression of natural gas consumption and weather degree days (population weighted days above and below 65 degrees Fahrenheit) since 2003. This regression suggests that 83% of the variability in natural gas consumption is determined by weather degree days. Weather degree days (consumption) are 2.5 standard deviations above the long term mean. We believe a reversion to the mean should result in lower demand. Supply remains very abundant. Productivity of 221 million cubic feet per day per rig is 18% greater than 2013 and 52% greater than its three year average.

This forecast results in a bias towards more “oily” Energy credits (vs. natural gas). Recently, we changed our fundamental outlook for the Oil Field Service and Contract Drillers to Negative due to three main reasons. First, the increased supply of rigs concurrent with a decrease in deep water rig demand is causing the daily rental rate for rigs to drop.   This is a result of major oil companies focusing more on return on capital employed instead of growth. Secondly, Brazil is unlikely to soak up the excess supply of rigs given the uncertainty in Brazilian economic policy. Lastly, activist shareholders are involved in this sector and will continue to pressure management to generate returns for shareholders at a time when stock prices are at multi-year lows.   Spreads widened in this sector, and are currently at levels last seen versus the broad Corporate market in April 2013 when shareholder activists entered the sector, creating uncertainty. We are not ready to buy on this dip since the weakness is fundamentally driven, and we expect it will take time to repair.

Private Placement Market Update

After a slow first half, deal flow has picked up in the private placement market. Generally, we continue to believe we are not getting compensated appropriately for the credit and liquidity risk and/or delayed funding, which is becomingly increasingly common. We recommended one deal that we believe offers at least 100 bps of value versus the comparable public credit, compensating investors for the structural risks and illiquidity.

Outside of private placements, we analyzed less liquid new issues in the public market that were small or had structural nuances. We believed many deals priced with yields too low for the risks assumed, recommending only a few.

Written by:

AAM Corporate Credit Research Team

For more information about AAM or any of the information in the Corporate Credit View, please contact:

Colin Dowdall, CFA, Director of Marketing and Business Development

colin.dowdall@aamcompany.com

John Olvany, Vice President of Business Development

john.olvany@aamcompany.com

Neelm Hameer, Vice President of Business Development

neelm.hameer@aamcompany.com

Disclaimer: Asset Allocation & Management Company, LLC (AAM) is an investment adviser registered with the Securities and Exchange Commission, specializing in fixed-income asset management services for insurance companies. This information was developed using publicly available information, internally developed data and outside sources believed to be reliable. While all reasonable care has been taken to ensure that the facts stated and the opinions given are accurate, complete and reasonable, liability is expressly disclaimed by AAM and any affiliates (collectively known as “AAM”), and their representative officers and employees. This report has been prepared for informational purposes only and does not purport to represent a complete analysis of any security, company or industry discussed. Any opinions and/or recommendations expressed are subject to change without notice and should be considered only as part of a diversified portfolio. A complete list of investment recommendations made during the past year is available upon request. Past performance is not an indication of future returns.

This information is distributed to recipients including AAM, any of which may have acted on the basis of the information, or may have an ownership interest in securities to which the information relates. It may also be distributed to clients of AAM, as well as to other recipients with whom no such client relationship exists. Providing this information does not, in and of itself, constitute a recommendation by AAM, nor does it imply that the purchase or sale of any security is suitable for the recipient. Investing in the bond market is subject to certain risks including market, interest-rate, issuer, credit, inflation, liquidity, valuation, volatility, prepayment and extension. No part of this material may be reproduced in any form, or referred to in any other publication, without express written permission.


August 5, 2014 by

The latest sanctions against Russia are just the most recent bout of volatility that energy companies have had to manage over the past quarter century.  We believe these sanctions have teeth and that Russian oil production will be negatively affected.  However, the investment grade companies with exposure in that country have very strong risk profiles. We would expect each company to be negatively affected by these sanctions, but not enough to meaningfully hurt their risk profile with the exception of BP.    


Effect of Sanctions on Russian Economy

As part of the latest round of sanctions imposed on Russia for their occupation of Ukraine, the United States and Europe have banned exports of technology for use in Russian deep-water and in Arctic and shale oil exploration in the hope of negatively affecting the country’s economic engine.  We believe that these latest sanctions on Russia will hurt its economy within 12 to 18 months. Our views are based on the likelihood that future oil production would almost certainly decline under these restrictions, which would curtail oil export revenue.  This will eventually create significant problems for Russia, as oil and gas revenues accounted for 52% of federal budget revenues and over 70% of total exports in 2012.

We also believe that the sanctions will negatively affect a number of investment grade companies including BP, Weatherford, Shell and Schlumberger.  However, the investment grade energy companies active in Russia are, for the most part, diversified enough to withstand stalled operations in that region without negatively affecting their risk profile or expected returns.

Below, we detail the latest sanctions, provide a brief on Russian oil production and the key participants in the Russian energy industry.  We conclude by updating our opinions on companies which will be affected by the developments in Russia.

Details on the Russian Sanctions

On July 29, 2014, European Union (EU) Ambassadors approved the following sanctions that ban long term financing (of more than 90 days maturity) to state-owned Russian banks; ban arms exports to Russia; ban exports of dual use technology to Russia (civilian technology that has military uses); and ban exports of specified oil exploration and production equipment to Russia.  The U.S. expanded similar sanctions as well.

The sanctions are scheduled to be released and implemented August 1, 2014 and will initially last for 12 months.  However, after three months the EU will evaluate the Russian/Ukraine situation at which point the sanctions could be removed.  The elimination of the restrictions reportedly would require unanimity from all 28 members of the European Union bloc.

Russian Producing Regions and Notable Participants

According to the Energy Information Agency, the fields in the Western Siberian Basin produce the majority of Russia’s oil. Production of oil in the region is dominated by Rosneft, the Russian state run oil company.  Additionally, western energy companies, notably Shell and BP, have secured access to production in Western Siberia in recent years.  BP and Rosneft recently began to explore for shale opportunities in Western Siberia along the Ural Mountains.  The restrictions imposed by the EU and the U.S. are clearly targeted at stopping further activity here.

Source: The World Factbook, CIA

East Siberia has become the center of production growth for Rosneft.  We believe the new sanctions would likely target production in this region as well. The start-up of the Vankor oil and gas field located south of Noril’sk, but north of the Arctic Circle in Exhibit 1 has been a significant contributor to Russia’s increase in oil production since 2010.  Vankor was the largest oil discovery in Russia in nearly three decades and produces about 430,000 barrels per day.

Additionally, Gazprom, Royal Dutch Shell, Mitsui and Mitsubishi are involved in the development of Sakhalin Island oil resources on the east coast of Siberia: Sakhalin I and Sakhalin II.  We believe that the recently announced sanctions would also curtail further production progress in this region.

In Exhibit 2, we highlight some of the more affected investment grade energy companies.  Exhibit 2 also provides a summary of investment grade energy companies’ exposure to Russia.  Unfortunately, the oil service companies do not provide country level exposure.  The figures for the service companies are AAM’s estimates based on available geographic data.

Source: Wood Mackenzie and AAM

BP

BP has a 20% stake in Rosneft, which it acquired through the exchange of its investment in TNK (Tyumenskaya Neftyanaya Kompaniya, Tyumen Oil Company) in March 2013.  Robert Dudley, CEO of BP, sits on the Board of Directors of Rosneft.   We believe BP’s risk profile will deteriorate as much as any investment grade company from these sanctions.

ExxonMobil

ExxonMobil does not currently produce much oil or generate significant cash flow in Russia.  However, in April 2012 it announced a very significant partnership with Rosneft to develop offshore reserves in Russia’s Arctic and Black Seas.  The deal according to some estimates is worth up to $500 billion over several decades.  We believe that progress in this joint venture will stall under the constraints.  Notably, Donald Humphries, a former executive vice president of ExxonMobil sits on the Board of Directors of Rosneft.

Royal Dutch Shell

The Netherlands-based Shell is in a very precarious position given its reasonably large position in Russia, combined with the fact it is the Netherland’s largest company and that it lost three important employees in the Malaysia Airlines Flight 17 (MH17) tragedy.  Only four months ago, Shell stated it remained committed to Russia despite the U.S. sanctions.  Now, given how the conflict between Russia and Ukraine has affected the Dutch, it remains to be seen how the super major will proceed.

Total

After BP, Total has the most exposure to Russia.  However, its exposure is primarily natural gas related, which does not seem to be included in the sanctions.  Total has a 20% interest in the $27 billion Yamal liquefied natural gas project in Siberia.  According to Total management, the impact of sanctions on the project was not yet clear.  What is clear is that funding from western companies like Total to Russian natural gas projects like Yamal will certainly slow given the uncertainty there.

Weatherford

On August 1, 2014, Weatherford completed the sale of it Russian land drilling and workover operations to Rosneft for $500 million cash. With the conclusion of this transaction, Weatherford’s remaining Russian revenue base declined from 7% of total company revenue in the first half of 2014 to 3% on a pro forma basis.

Investment Grade Energy Companies Can Manage Volatility in Russia

Subsequent to the collapse of the Soviet Union, the oil patch in Russia has experienced the privatization of the industry, a jailed oil CEO and a coerced sale of a $55 billion joint venture to a state run company – essentially, lots of turmoil.  The only western-based energy companies that can withstand this kind of unruliness are those that are very well-capitalized, diversified and liquid – basically strong investment grade companies.

We believe the investment grade energy companies that are exposed to Russia will be able to manage disruptions caused by the sanctions.  In fact, we do not expect any of the companies listed in Exhibit 3 to see a material change to their risk profile, with the exception of BP which will be negatively affected if the sanctions last more than 12 months.

Source: Market sources, AAM


Patrick J. McGeever
Senior Analyst, Corporate Credit


Disclaimer: Asset Allocation & Management Company, LLC (AAM) is an investment adviser registered with the Securities and Exchange Commission, specializing in fixed-income asset management services for insurance companies. This information was developed using publicly available information, internally developed data and outside sources believed to be reliable.  While all reasonable care has been taken to ensure that the facts stated and the opinions given are accurate, complete and reasonable, liability is expressly disclaimed by AAM and any affiliates (collectively known as “AAM”), and their representative officers and employees.  This report has been prepared for informational purposes only and does not purport to represent a complete analysis of any security, company or industry discussed. Any opinions and/or recommendations expressed are subject to change without notice and should be considered only as part of a diversified portfolio. A complete list of investment recommendations made during the past year is available upon request. Past performance is not an indication of future returns.

This information is distributed to recipients including AAM, any of which may have acted on the basis of the information, or may have an ownership interest in securities to which the information relates.  It may also be distributed to clients of AAM, as well as to other recipients with whom no such client relationship exists.  Providing this information does not, in and of itself, constitute a recommendation by AAM, nor does it imply that the purchase or sale of any security is suitable for the recipient. Investing in the bond market is subject to certain risks including market, interest-rate, issuer, credit, inflation, liquidity, valuation, volatility, prepayment and extension. No part of this material may be reproduced in any form, or referred to in any other publication, without express written permission.

July 11, 2014 by

Market Summary: Be Defensive, Not Bearish

By Elizabeth Henderson, CFA
Director of Corporate Credit

Elizabeth Henderson

[toc]

AAM hosted its biannual client conference last month. A popular question was “Is corporate credit overvalued?” To benefit those who missed the conference, we decided to share our answer in this quarter’s AAM Corporate Credit View as well as how we are positioned for the risks ahead.

Corporate Credit Continued to Perform Well in the Second Quarter

Corporate credit spreads tightened 7 basis points (bps) in the second quarter, supported by dovish comments from the Federal Open Market Committee (FOMC), constructive domestic economic data, and persistent low market volatility.  Similar to the first quarter, the Investment Grade corporate market generated 2.8% total return (0.66% excess return) in the second quarter, as represented by the Barclays Corporate Index. BBB rated securities generally outperformed, narrowing the basis between A rated Industrial securities from 60 bps at year-end 2013 to 44 bps. Comparing credit spreads to credit fundamentals such as leverage over time, we consider BBB rated securities fairly valued (Exhibit 1). Moreover, spread volatility has been minimal (6 bps YTD), thus OAS-to-spread volatility remains above average.   We expect this low level of volatility to persist for the next quarter, which is supportive for spreads.

Exhibit 1: Spreads have tightened while leverage has increased

AAM Corp Credit Summer-2014 1

Source: Barclays, CapitalIQ, AAM


Market Technicals Remain Supportive for Spreads

Demand remains very strong for Investment Grade securities. The secondary market continued to benefit from positive fund flows, and new issues remained oversubscribed with little concession versus outstanding securities. We are starting to see an increasing number of infrequent issuers with more credit risk (e.g., small REITs, Baidu) issue debt at negative concessions to their secondary spreads. And, issuers are taking advantage of investors’ quest for yield by issuing 50 year debt with minimal additional spread.

Long end maturities performed better in the second quarter, but intermediate (7-10 year) debt continued to outperform. Importantly, JP Morgan revised its forecast for fixed income supply down from $712 billion to $562 billion (vs. 2013’s actual of $864 billion) due mainly to lower supply of structured products and high yield. Investment Grade corporate supply is tracking ahead of forecast, but issuance in the second half may underwhelm if companies pushed forward their issuance due to lower than expected rates. Issuance to fund mergers and acquisitions (M&A) is increasing, and we expect this to support the level of issuance next year.   However, outside of Investment Grade corporates, we do not expect issuance in other fixed income sectors to materially increase. This strong technical is driving spreads and should remain supportive for corporate credit.

Economic Growth Remains Muted

Economic data improved in the second quarter but remained in line with expectations. Given inflation targets set by the European Central Bank and the Bank of Japan, we could be entering a period when the U.S. is tightening monetary policy while Europe and Japan are easing. This has implications for the U.S. Dollar and thus, commodity prices. China remains committed to its GDP target of 7% and continues to be accommodative. We believe it will be difficult for U.S. GDP growth to exceed 3%, as consumers feel the effects of rising gasoline and electricity prices along with rising food and rent costs.

We Expect Management Teams to Pursue Mergers & Acquisitions and Add Leverage to Boost ROE

Little has changed in credit fundamentals in the second quarter except for management teams’ willingness to pursue M&A. Return on equity (ROE) has fallen post crisis (Exhibit 2) despite increasing margins, debt leverage, and share repurchases due to the low level of revenue growth. Revenue growth for the median firm is approximately 2 percentage points lower than it was before the recession. As you would expect, firms get more aggressive in the latter part of the credit cycle, willing to accept financial risk and stretching to produce the returns shareholders expect. In 2007, M&A deal volume was high and few deals were equity financed. Year-to-date, the dollar volume of deals financed with stock is high due to the very large deals that have been announced. But, on a deal volume basis, it doesn’t look as favorable with a high proportion funded with debt and/or cash. Our expectation is for the number of deals to increase and financing to be more cash based.

Exhibit 2: ROE continues to fall

AAM Corp Credit Summer-2014 2

Source: AAM, Capital IQ (Universe includes 435 Industrial companies

We believe event risk will be the main contributor to credit rating downgrades and spread widening over the next 12 to 24 months. We expect the downgrades to mainly come from companies leaving the single-A category, moving into the BBB-category, as there is little difference from a cost of capital standpoint (Exhibit 3), and companies continue to have access to the Investment Grade market. While that is not great for performance for that particular issuer, with the potential for prices to fall 1-6%, we believe it will remain relatively contained.

Exhibit 3: Weighted Average Cost of Capital (WACC) curve is relatively flat

AAM Corp Credit Summer-2014 3 

Source: Morgan Stanley, Yieldbook, Bloomberg

The sectors listed in Exhibit 4, we believe are more vulnerable to event risk (e.g., M&A, increasing leverage) and the commensurate degree of spread widening. Assuming we are correct with the projected spread widening, we would still expect the market to generate modestly positive excess returns, as the income associated with 55% of the market that is not vulnerable to event risk offsets the spread widening of the sectors below.

Exhibit 4: Spread Widening Risk is Higher in Growth Challenged Sectors

AAM Corp Credit Summer-2014 4

Source: Barclays, AAM; SWR = Spread widening risk; est = estimate)

Regulatory Oversight Should Prevent a Large LBO

What would be detrimental to the Investment Grade market is a large leveraged buyout (LBO). While we would not be surprised to see select LBOs like we did last year, we are not expecting a large deal like we saw in 2006-2007 because of increased regulatory involvement. Regulators are not allowing the banks to underwrite secured loans with more than six times debt to earnings because they do not believe it is good for the economy. And, while nonbank financial institutions are happy to pick up that business, they don’t have the balance sheets to fund large deals (>$20 billion).

Spreads are Fully Valued but Reflect The Cost of Liquidity and Credit Loss

Exhibit 5: OAS remains within one standard deviation of its 20 year mean

AAM Corp Credit Summer-2014 5

Source: Barclays, AAM

We recognize that spreads are at the low end of the range historically (Exhibit 5). This reflects the lower level of systemic risk and uncertainty and the very strong technical bid with fixed income supply half its pre-crisis level. Corporate default rates are expected to remain low over the near term. Citigroup’s strategist states that using the worst 10 year default period for credit and a 40% recovery assumption, the data suggests High Grade bond spreads would be just 32 bps. That assumes they only reflect expected losses from defaults. Of course they should be wider because of other risks such as liquidity, which has increased post financial crisis. We estimate the cost of market liquidity to be approximately 35 bps, bringing the OAS floor to 67 bps. This compares to a market OAS at June 30, 2014 of 99 bps. The additional 32 bps is

We recognize that spreads are at the low end of the range historically (Exhibit 5). This reflects the lower level of systemic risk and uncertainty and the very strong technical bid with fixed income supply half its pre-crisis level. Corporate default rates are expected to remain low over the near term. Citigroup’s strategist states that using the worst 10 year default period for credit and a 40% recovery assumption, the data suggests High Grade bond spreads would be just 32 bps. That assumes they only reflect expected losses from defaults. Of course they should be wider because of other risks such as liquidity, which has increased post financial crisis. We estimate the cost of market liquidity to be approximately 35 bps, bringing the OAS floor to 67 bps. This compares to a market OAS at June 30, 2014 of 99 bps. The additional 32 bps is compensating investors for volatility, which given a market duration of 7, assumes it falls 1 bps from the current level[note]Note: We are assuming investors require sufficient income to compensate for a one standard deviation move in OAS. Therefore, a market duration of 7 and OAS standard deviation of 5 would require 35 bps of spread to break even over 12 months if OAS widened one standard deviation. The same applies to the cost of liquidity. The bid ask spread is 5 bps on average, and given a duration of 7, investors would need 35 bps of income to offset this cost over a 12 month timeframe.[/note]. We believe this is a reasonable assumption given where we are in the credit cycle (Exhibit 6), but it leaves little room for further spread tightening.

Exhibit 6: Standard deviation is expected to remain low over the near term

AAM Corp Credit Summer-2014 6

Source: Barclays, AAM

Position the Portfolio Defensively, Using Credit and Sector Selection

In conclusion, over the near term, we expect spreads to stay in this narrow band. The downside risks that would likely result in spread widening include a sudden move in rates, an exogenous shock, or a large LBO. Upside risks include better economic data or unexpected deleveraging by companies. Market technicals are benefitting spreads and are likely to continue to do so over the near term. Credit quality is good today and systemic risk is low, and even though spreads are tight, they are wide of the cost of liquidity and loss given default and compensate investors for the expected low level of volatility. We are not recommending portfolio managers upgrade the quality of their portfolios because we expect more ratings migration down from A to BBB than we do from BBB to BB. Case in point, after a failed merger with Syngenta, Monsanto decided to increase its leverage, resulting in ratings falling from A1/A+ to A3/BBB+. Monsanto’s spreads widened more than 25 bps. We believe it’s more prudent to be selective or defensive in this environment, not bearish.

­­­­­

Private Placement Market Update

We have participated in the private placement market in the first half of 2014. Currently, we are seeing frothiness in that market as well as project loans. The grab for yield has resulted in aggressive pricing and terms with investor demand outpacing supply. Volume is tracking lower than 2013, as issuers are increasingly accessing the European corporate market after the spread tightening that has materialized over the last couple of years. Therefore, we are investing selectively in this asset class as well.

For more information about AAM or any of the information in the Corporate Credit View, please contact:

Colin Dowdall, CFA, Director of Marketing and Business Development

colin.dowdall@aamcompany.com

John Olvany, Vice President of Business Development

john.olvany@aamcompany.com

Neelm Hameer, Vice President of Business Development

neelm.hameer@aamcompany.com

Disclaimer: Asset Allocation & Management Company, LLC (AAM) is an investment adviser registered with the Securities and Exchange Commission, specializing in fixed-income asset management services for insurance companies. This information was developed using publicly available information, internally developed data and outside sources believed to be reliable. While all reasonable care has been taken to ensure that the facts stated and the opinions given are accurate, complete and reasonable, liability is expressly disclaimed by AAM and any affiliates (collectively known as “AAM”), and their representative officers and employees. This report has been prepared for informational purposes only and does not purport to represent a complete analysis of any security, company or industry discussed. Any opinions and/or recommendations expressed are subject to change without notice and should be considered only as part of a diversified portfolio. A complete list of investment recommendations made during the past year is available upon request. Past performance is not an indication of future returns.

This information is distributed to recipients including AAM, any of which may have acted on the basis of the information, or may have an ownership interest in securities to which the information relates. It may also be distributed to clients of AAM, as well as to other recipients with whom no such client relationship exists. Providing this information does not, in and of itself, constitute a recommendation by AAM, nor does it imply that the purchase or sale of any security is suitable for the recipient. Investing in the bond market is subject to certain risks including market, interest-rate, issuer, credit, inflation, liquidity, valuation, volatility, prepayment and extension. No part of this material may be reproduced in any form, or referred to in any other publication, without express written permission.


  • « Go to Previous Page
  • Page 1
  • Interim pages omitted …
  • Page 5
  • Page 6
  • Page 7
  • Page 8
  • Page 9
  • Interim pages omitted …
  • Page 17
  • Go to Next Page »

Get updates in your inbox.

  • Investment Strategies
    • Investment Grade Fixed Income
    • Specialty Asset Classes
  • Our Clients
    • Client Experience
    • Sample RFP Download
  • Insights
    • Video
    • Webinar
    • News
    • Podcasts
  • About
    • Our Team
    • Contact
    • Client Login

Disclaimer: Asset Allocation & Management Company, LLC (AAM) is an investment adviser registered with the Securities and Exchange Commission, specializing in fixed-income asset management services for insurance companies. Registration does not imply a certain level of skill or training. This information was developed using publicly available information, internally developed data and outside sources believed to be reliable. While all reasonable care has been taken to ensure that the facts stated and the opinions given are accurate, complete and reasonable, liability is expressly disclaimed by AAM and any affiliates (collectively known as “AAM”), and their representative officers and employees. This report has been prepared for informational purposes only and does not purport to represent a complete analysis of any security, company or industry discussed. Any opinions and/or recommendations expressed are subject to change without notice and should be considered only as part of a diversified portfolio. A complete list of investment recommendations made during the past year is available upon request. Past performance is not an indication of future returns. This information is distributed to recipients including AAM, any of which may have acted on the basis of the information, or may have an ownership interest in securities to which the information relates. It may also be distributed to clients of AAM, as well as to other recipients with whom no such client relationship exists. Providing this information does not, in and of itself, constitute a recommendation by AAM, nor does it imply that the purchase or sale of any security is suitable for the recipient. Investing in the bond market is subject to certain risks including market, interest-rate, issuer, credit, inflation, liquidity, valuation, volatility, prepayment and extension. No part of this material may be reproduced in any form, or referred to in any other publication, without express written permission. *All figures shown are approximate and subject to change from quarter to quarter. **The accolades and awards highlighted herein are not statements of any advisory client and do not describe any experience with or endorsement of AAM as an investment adviser by any such client.

Copyright © 2024 AAM | Privacy and Disclosures

  • LinkedIn
  • YouTube