When contemplating an investment, it is important to step back and look at the big picture. Baby Boomers, Generation X’ers, and Millennials are all large groups of the population which carry their own unique characteristics and are defined by the time in which they live. We believe that Millennials and Hispanics will help shape the future of the consumer sector, and an understanding of both demographics will be critical for successful analysis of investment grade credits in insurer’s portfolios.
A Paradigm Shift in Popular “Trends”: Re-Shaping Focus
Smart phones… Online shopping… Organic Foods… Eat-in vs. Eat-out…
The combination of population change, economic conditions, and technological advancements have helped to accelerate these trends. The U.S. population is rapidly aging and evolving into a predominately non-white race/ethnicity. These are a couple of important trends that have been clearly distinguished by the demographic community. From a business perspective, it’s absolutely imperative to take into consideration these types of longer term changes. Many companies are reshaping their strategy and recognize that long term survival may depend on making major changes to their business.
We believe that the two most important demographic groups to explain the continued shift in popular trends will be Hispanics and Millennials.
Hispanics: Nearly 25% of the U.S. Population within 20 years
In 2010, Hispanics accounted for about 50 million people which represented 16% of the U.S. population. By 2035, Hispanics are expected to grow rapidly to 23% of the population. This is a large group of the population which must be addressed by any consumer focused business. One interesting observation is that Hispanics spend a lot of money on apparel: approximately 20% more than the non-Hispanic consumer (U.S. Census Bureau). This makes the retail industry particularly sensitive to Hispanics spending trends. The following is a quote from Macy’s Chief Financial Officer, Karen Hoguet, during their fourth quarter earnings conference call:
”And obviously as you look at the population base, there are stores in local areas where you need to think through the Latino strategy or an African-American strategy or Asian. But interestingly, there isn’t one Latino strategy, because in different parts of the country in different countries of origin, it can be very different.”
This approach fits well with the company’s “My Macy’s” strategy, which customizes merchandise to a store specific location. The “right” fashion decision may be customized around the geography of the store. Nation-wide or even regional fashion decisions may have a more difficult time being successful. With that said, it’s important for retailers to understand the risks associated with the geographic concentration of their stores. In the U.S., Hispanics are heavily concentrated in the southwest states including Texas, California, Arizona, and New Mexico. This makes sense given their proximity to the Mexican border. Investment grade companies with high exposure to these areas include Nordstrom, Macy’s, TJ Maxx, and Target. Of course, a higher concentration of exposure makes it more critical for a particular retailer to get the fashion call right, which is true for any ethnic group. Major retailers and consumer products companies support such well known Latin stars as: Jennifer Lopez, Shakira, and Sofia Vergara. For example, Jennifer Lopez has an entire line of apparel and home goods at Kohl’s. Also important for retailers, are fully functioning Spanish web sites and Spanish speaking customer service representatives. For example, Best Buy offers a very easy option to convert to Spanish with the click of one button.
Another interesting area of spending for Hispanics is in the food category. About 16% of spending by Hispanics is on food versus 13% for non-Hispanics. Hispanics are spending more at-home versus at restaurants. About 63% of Hispanic’s food budget is spent at-home compared to 59% for non-Hispanics. This can be explained, in part, by Hispanic traditions including larger, more family focused meal time. This is an important trend for food retailers and manufacturers. Grocery stores have evolved with new signage and aisles dedicated to specific ethnic groups including Hispanic, Italian, and Asian. Additionally, food manufacturers need to understand the important buying behavior of their Hispanic customer. Exposure to this specific group of customers can occur via mergers and acquisitions or through product innovation. It’s common to see such ingredients as quinoa (Peruvian), acai (Brazil), chipotle, and habanero in restaurants and at the grocery store. Interestingly, in the U.S. more tortillas are sold than pasta, hamburger/hot dog buns, and bagels, while salsa has more than twice the sales of ketchup and mustard.
Rapid growth for Hispanics is definitely positive for the economy. Unfortunately, some of this growth is offset by lower than average spending power. Exhibit 1 illustrates the financial position of Hispanics versus other groups.
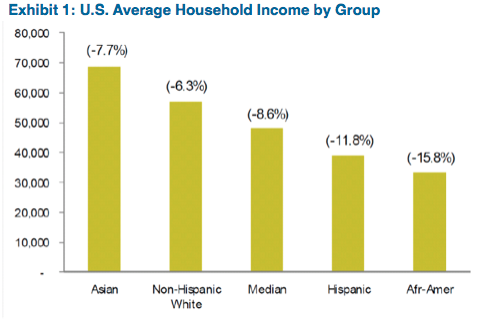
Source: U.S. Bureau of Labor Statistics, Wells Fargo Securities, LLC
Hispanic household income is at the low end of the spectrum and has fallen by double digits since 2000. Hispanics earn on average $593/week compared to the average of $796/week, according to the Bureau of Labor Statistics (BLS). This may be partly explained by the lower level of education. Just 40% of Hispanics have a college education versus 65% for non-Hispanics.
By 2025, Three Out of Four Workers Will Be Millennials
Millennials were born between 1980 and 2000 and account for over 85 million people in the U.S. Similar to other generations, the unique characteristics of Millennials will help shape the world, including the way businesses target consumers and adapt to significant change. Several studies on Millennials have yielded similar outcomes when it comes to defining characteristics. Millennials are politically independent, more liberal on social issues, racially diverse, not very religious, and well educated. Student loans and a higher level of unemployment have led to a higher rate of Millennials living at home and waiting to get married and start a family. In addition, this group is very tech savvy and heavily entrenched in online social networking. Online shopping has become very popular and represents the highest area of growth for many major retailers. Anyone with online access can write an opinion on a product that has the potential to reach millions of people across the globe. Millennials are easily swayed by opinions and are less brand loyal. Also, this group is very cost conscious and demands high quality/service.
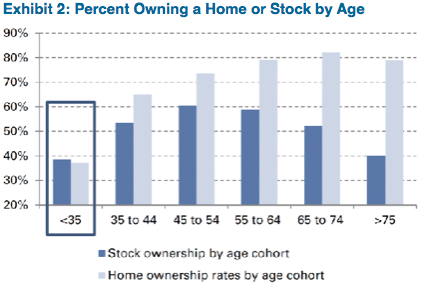
Currently, the economic power of the Millennials is lacking, but the potential is high. A significantly higher level of unemployment exacerbates the spending problem. The unemployment rate at the end of May 2014 for individuals ranging in age from 18-34 was 8.0% compared to 5.9% for the entire population (BLS). Also, Millennials have not benefited from the recent rise in the stock market and improvement in housing as illustrated below in Exhibit 2.
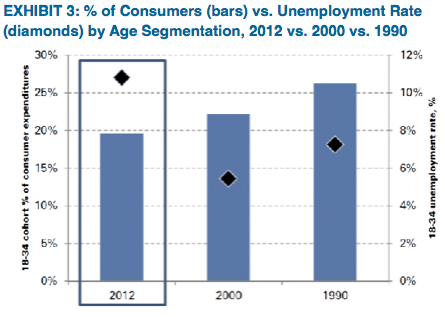
Looking forward, we believe the upside to economic growth from Millennials is substantial. Typically, peak spending occurs at about age 40 and tails off significantly around 65 years of age. For Millennials, the peak cycle will start in approximately five years. Another positive is the higher degree of optimism that this group exhibits. Several surveys, including the University of Michigan consumer sentiment index, have been consistently higher for the 18-34 year old age group. Exhibit 3 makes a solid case for growth potential when taking a look at the unemployment rate and percentage of consumer spending. The graph compares the 18-34 year old age group at three different points in time (1990, 2000, and 2012). The takeaway is that as the unemployment rate comes down, the percentage of spending should go up.
A projection of relative share of consumer spending shows that spending by Millennials will exceed that by the Baby Boomers in the next ten years, accounting for about 35% of all spending.
This has major implications for the food and consumer products industries. We expect Millennials’ desire for improved health and convenience will continue at a strong pace. Food companies are focused on “clean” foods, including gluten free and protein enriched products. These trends have led to significant mergers and acquisitions, including Campbell Soup’s acquisition of Bolthouse and product innovation yielding new products such as Yoplait’s 100 calorie Greek Yogurt and Quaker’s High Fiber Instant Oatmeal. Millennials are also looking for a meal that is easy to put together and doesn’t cost a lot. For example, Velveeta’s Liquid Gold inspired Cheesy Skillet Dinner Kits have experienced strong sales growth. Another area of interest is in cosmetics and skin care. An article in Cosmopolitan titled, “10 Solutions for Annoying Skin Issues Plaguing Millennials” writes about skin problems associated with stress and sallow looking skin from staying out all night. Millennials are seeing the impact that aging has on their parents. In addition, women want to look their best given the social pressures of keeping healthy and looking good. With the proliferation of smart phones, nearly everyone has a camera with them at all times, increasing the perceived importance of beauty products.
Most retailers are making major changes to their business to accommodate the specific requirements of Millennials. This includes a special focus on mobile/online shopping, branding, and exposure to all forms of social networking. The way retailers manage their inventory is entirely different from ten years ago. This omni-channel strategy allows the customer to shop online and in the store from a computer or mobile device. A customer in the store can buy a product on the shelf in a different location which can be shipped to that store or delivered directly to the customer’s home. In addition, sales that originate online draw inventory from distribution centers or directly from a brick and mortar store. Pricing is very important to customers. Shoppers have become more intelligent when shopping for the “best deal.” The frugal nature of shoppers was emphasized in the latest economic recession. We would not expect this type of mindset to change any time soon. In addition, shoppers have simple online tools available to compare prices, and the commonplace practice of “price matching” also makes shopping in an actual store competitive. Millennials are very tuned into hot trends. This group is not shy about publicizing their opinions and is easily swayed by popular trends and celebrity endorsements. Branding and image are critically important for retailers. Retailers are actively partnering with established, well known leaders in their field. An example of this is Target’s collaboration with Giada de Laurentiis in their food department and Nate Berkus in home goods. As the Millennials improve their financial positions and move into their own homes, we expected the home improvement retailers, including Home Depot and Lowe’s, to prosper.
We See Opportunities in the Consumer Sectors
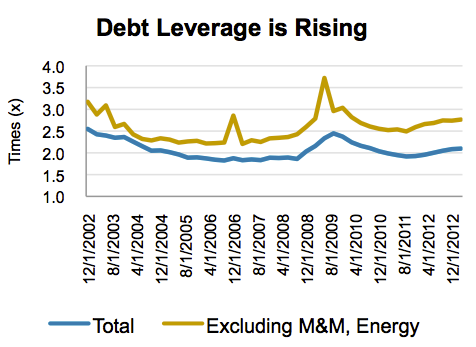
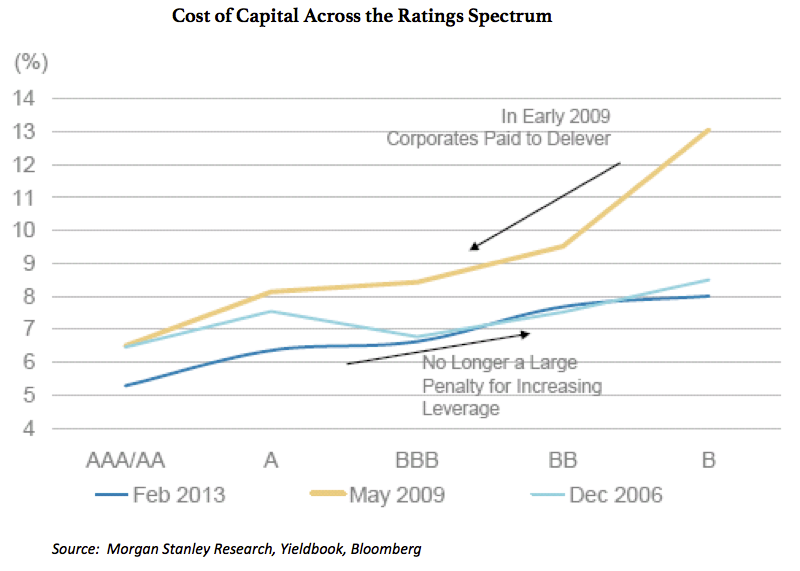
We expect the Retail and Consumer Products industries will continue to transform. We believe most companies are well aware of the changing landscape and are trying to make smart decisions. What were once strong companies (Sears, JCPenny, RadioShack, Polaroid) are now worn out concepts that didn’t adapt to change. For our client’s portfolios, we focus on companies that are open to change whether it’s through mergers and acquisitions or through internal development. For the most part, we believe that “bigger is better” especially for a mature business in a highly competitive environment. We would expect companies to continue to expand overseas and look for strategic acquisitions in the U.S. where trends such as Hispanics and Millennials can be emphasized. We do not avoid those companies that have increased their debt leverage as long as the use of cash is strategic for the company and ultimately benefits all stakeholders.
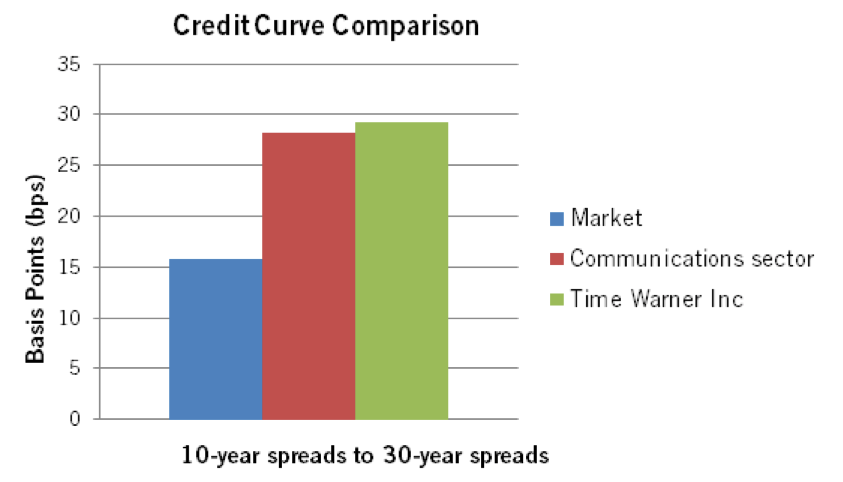
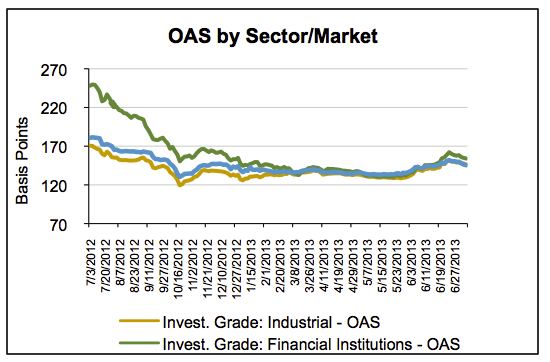
The Retail and Consumer Products sectors trade significantly tighter than the overall market. At the end of April, the OAS of the Retail sector was 89 basis points and for Consumer Products it was 85 basis points. This compares to 101 basis points for the OAS of the Corporate bond market, as reflected by the Barclays Investment Grade Corporate Index. We would need to see significant relative spread tightening for these sectors to outperform the broader market. We don’t expect credit measures for these industries to improve markedly. Event risk is very high. Shareholder friendly action has become ordinary with the range of options including share buybacks, asset spinoffs, and leveraged buyouts. We expect this kind of activity to continue. As bondholders, we would rather see debt used for mergers and acquisition purposes. While it may be difficult for the sectors to outperform, we are confident that there are still many good opportunities to pursue.
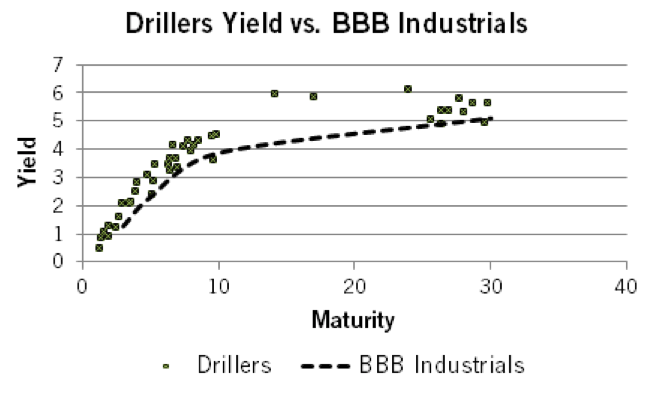
Our strategy is to focus on “best in class” companies or subsectors that benefit from a positive secular development or an attractive niche. In addition, we generally prefer the BBB rated credits because they offer more yield with a greater opportunity for relative spread tightening. Despite severe competitive challenges Macy’s, Kroger, CVS, and Home Depot have consistently proven their market leading positions. Large home appliance leader Whirlpool will continue to benefit from an attractive replacement cycle and the steady improvement in the housing sector. Kerry Group is one of the largest ingredient and flavor manufacturers in the world. We like this business given the diversified nature of its customers and the innovative, value added products that it offers.
Michael J. Ashley
Principal and Senior Analyst, Corporate Credit
For more information, contact:
Colin T. Dowdall, CFA
Director of Marketing and Business Development
colin.dowdall@aamcompany.com
John Olvany
Vice President of Business Development
john.olvany@aamcompany.com
Neelm Hameer
Vice President of Business Development
neelm.hameer@aamcompany.com
1 Paul Lujuenz, Matt Nemer, Evren Koppelman, Trisha Dill, and Kate Wendt, “Retail Weekend Reading: Who Can Win Over the Hispanic Population,” Wells Fargo Securities Equity Research, January 30, 2014, page 2.
2 John Baumgartner and Kristina Westura, “Food: Evaluating Hispanic/Millennial Opportunities,” Wells Fargo Securities Equity Research, March 13, 2014, page 1.
3 Baumgartner and Westura, “Food: Evaluating Hispanic/Millennial Opportunities.”
4 Elaine Watson, “Hispanic food and beverage market set for more ‘aggressive growth’ Predicts Packaged Facts,” Food Navigator USA, December 7, 2012, accessed May 7, 2014, https://www.foodnavigator-usa.com/Markets/Hispanic-food-and-beverage-market-set-for-more-aggressive-growth-predicts-Packaged-Facts.
5 Baumgartner and Westura, “Food: Evaluating Hispanic/Millennial Opportunities.”
6 Michael Kelter, Matthew Fassler, Steven Kent, and Ivan Holman. “4Q13 macro survey suggests middle income and Millennial strength,” Goldman Sachs Equity Research – Americas: Retail, January 28, 2012, page 15.
7 Kelter, Fassler, Kent, and Holman, 4Q macro survey suggests,” page 18.
Disclaimer: Asset Allocation & Management Company, LLC (AAM) is an investment adviser registered with the Securities and Exchange Commission, specializing in fixed-income asset management services for insurance companies. This information was developed using publicly available information, internally developed data and outside sources believed to be reliable. While all reasonable care has been taken to ensure that the facts stated and the opinions given are accurate, complete and reasonable, liability is expressly disclaimed by AAM and any affiliates (collectively known as “AAM”), and their representative officers and employees. This report has been prepared for informational purposes only and does not purport to represent a complete analysis of any security, company or industry discussed. Any opinions and/or recommendations expressed are subject to change without notice and should be considered only as part of a diversified portfolio. A complete list of investment recommendations made during the past year is available upon request. Past performance is not an indication of future returns.
This information is distributed to recipients including AAM, any of which may have acted on the basis of the information, or may have an ownership interest in securities to which the information relates. It may also be distributed to clients of AAM, as well as to other recipients with whom no such client relationship exists. Providing this information does not, in and of itself, constitute a recommendation by AAM, nor does it imply that the purchase or sale of any security is suitable for the recipient. Investing in the bond market is subject to certain risks including market, interest-rate, issuer, credit, inflation, liquidity, valuation, volatility, prepayment and extension. No part of this material may be reproduced in any form, or referred to in any other publication, without express written permission.