• Skip to primary navigation
  • Skip to main content
  • Skip to footer
AAM CompanyTransparent Logo

AAM Company

AAM Company Website

  • Investment Strategies
    • Investment Grade Fixed Income
    • Specialty Asset Classes
  • Clients
    • Our Clients
    • Client Experience
    • Download Sample RFP
  • Insights
    • Video
    • Webinars
    • Podcasts
    • News
  • About
    • Our Team
    • Events
  • Login
  • Contact Us
Contact

Corporate Credit

May 31, 2013 by

The relationship between the oil and rail industries goes back over 100 years to the days of the Standard Oil Company, run by John D. Rockefeller.  Rockefeller offered the railroads a steady volume of business for a preferred rate.  Soon competitors either went out of business or were acquired by Standard Oil.  That close relationship deteriorated in the early 1900’s when a system of pipelines was built, which effectively eliminated the need for railroads to ship crude oil given the cost effectiveness of the pipelines.  It has only been in the last couple of years that the rail industry has, once again, proved its importance to the oil industry.  In this white paper, we will talk about why this has occurred and how important it is to the rail industry.  We will also debate the longer term prospects for the rail industry with a focus on a couple of expected trends.


The Growth in Oil-by-Rail Has Been Incredible

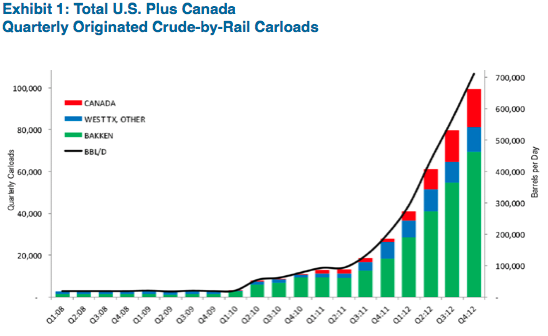
The growth in the shipment of crude oil-by-rail has boomed in the last couple of years as illustrated in Exhibit 1. In the U.S. alone, carloads have increased from 9,500 in 2008 to 233,811 in 2012.

Source: Association of American Railroads (AAR), Surface Transportation Board (STB), Raymond James research

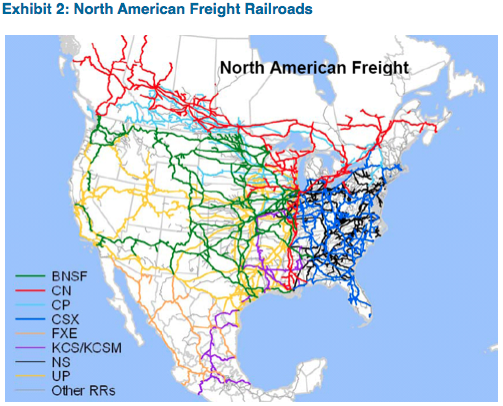
Major advancements in drilling technology, especially horizontal drilling and hydraulic fracturing, coupled with attractive commodity prices have led to rapid crude oil production in major shale formations in North America, most notably the Bakken in North Dakota. Refineries are generally located on the Coasts and in the Gulf, far away from shale plays in the middle of the continent such as the Bakken. The ramp in production has left a huge demand for transport of crude oil given the lack of pipeline infrastructure currently available to move the oil from production sites to downstream facilities. Also, we expect the oil sands in western Canada will be a huge source of production in coming years. The extensive network of track (Exhibit 2) made railroads an easy solution to this problem.

Source: Association of American Railroads

Based on current data, railroads move about 10% of the oil production in the U.S. In some areas, such as the Bakken, rails transport about two thirds of the production.

In addition to transporting oil, rails also ship large amounts of frac sand (crush resistant sand used in the hydraulic fracturing process), cement, and casing to producers of oil and natural gas. According to Burlington Northern Santa Fe, every horizontal drilling rig requires about 40 railcars of materials. Rails also transport chemicals to producers of heavy oil which combine with the oil to allow for movement through a typical pipeline.

Many Advantages When Shipping by Rail

The vast rail footprint gives shippers the ability to move oil to almost any refinery in North America. This has become very important given changing demand factors and pricing opportunities in different regions of North America. For example, a refinery on the East Coast, which historically has bought Brent crude oil barged in from the North Sea, has switched to West Texas Intermediate (WTI) oil. Even with the extra cost of transporting WTI by rail, the lower cost of WTI versus Brent still leaves the refinery at a cost advantage.

Movement of oil by rail is quick. In unit train configurations, which translate into about 72,000 barrels of crude oil, transit time is about five to six days for travel from the Bakken to the U.S. Gulf Coast compared to about 40 days for a pipeline. In addition, new infrastructure (loading and unloading terminals) for railroads can be built in a matter of months while building a pipeline can take years to complete. These factors make it much easier for the oil and gas industry to respond to production issues and price discrepancies.

Typical contracts for railroads are one to five years compared to ten to twenty year take-or-pay contracts for pipelines. This allows small to medium sized producers with a lack of financial resources to secure transportation at a reasonable cost. This also increases flexibility for producers given volatile commodity markets and offers protection against pipeline operating problems.

Product purity and efficiency is higher when using rails. Products are not mixed when moved by rail. Refiners have lower risk of contamination and are able to target certain grades of oil. In addition, diluents are not needed to transport heavy oil given the use of heated tank cars. When transporting heavy oil, pipelines require mixing with chemicals or lighter oil which can account for about 30% of the volume. This requires additional cost and time for separation at the refinery.

Rails do not have the same regulatory issues that pipelines confront. Pipelines need to cross extensive environmental hurdles when being built. In addition, there are substantial geographic obstacles when building a new pipeline especially in heavily populated, urban areas such as the East Coast.

The biggest disadvantage for rail transport of oil is the cost. The typical cost of moving crude oil from the Bakken to the Gulf Coast by rail is $14 to $19 per barrel compared to $7 to $11 per barrel using a pipeline. There are more components involved when shipping oil by rail including getting the oil to the uploading facility, transferring the oil to tank cars, leasing the cars, and off-loading the oil once the tank cars get to the refinery. In addition, with more “touches” there are more opportunities for problems to occur.

Impact on Railroad Industry is Growing

For the railroad industry, the risk/cost is minimal as the majority of capital is borne by the midstream and refining companies. Numerous participants in these sectors have been actively investing in infrastructure, including new transload facilities and tank cars. These costs come at a fraction of the cost of building a new pipeline which can run into the billions of dollars. The railroad industry needs to maintain the tracks and locomotives, which also comes at a cost; but, of course, are also used to ship other products.

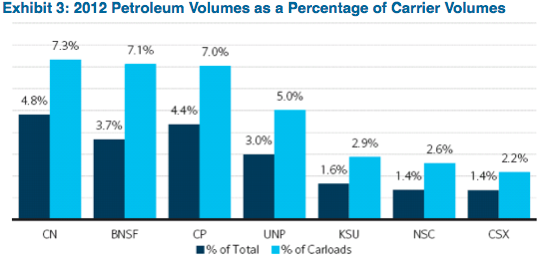
All of the large railroad companies are benefitting from the oil-by-rail craze, especially those operating in the west where the Bakken resides. Exhibit 3 is a chart of the Class 1 rails and their percentage of business coming from the transport of petroleum products which includes crude oil, gasoline, and other related products. When you exclude intermodal traffic (only look at commodity business), the impact is much more significant. For the first quarter of 2013, petroleum products accounted for 5.6% of commodity carloads compared to 1.8% for the fourth quarter of 2007.

Source: Association of American Railroads, Barclays Research estimates

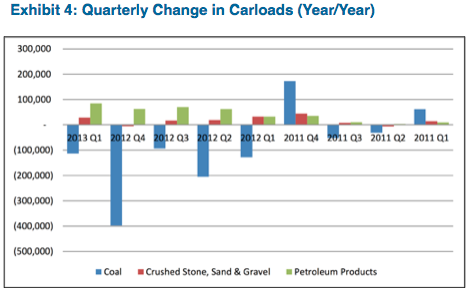
The same developments that have helped the railroad industry with the growth of oil-by-rail have hurt the rail’s coal business. The energy industry has produced a lot of natural gas which has resulted in low gas prices that are now competitive with coal prices. As a result, the railroad industry has lost a lot of carloads of coal to natural gas as electricity generation has switched to natural gas. While this continues to hurt the rails, the transport of crude-by-rail has eased the pain and in some quarters completely offsets lower coal shipments, as shown in Exhibit 4. We also account for added shipments of frac sand due to the oil-by-rail craze.

Source: Association of American Railroads, AAM

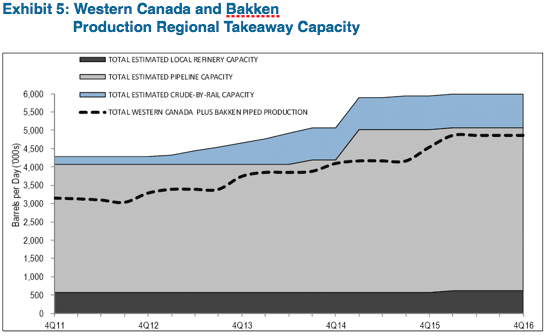
Over the next two to three years we feel confident that the oil-by-rail story will continue to be strong. As shown in Exhibit 5, pipeline capacity is expected to be tight as production growth stays strong. This leaves little room for delays or operational errors and bodes well for improving oil carloadings.

Source: Association of American Railroads, Canadian Association of Petroleum Producers, Raymond James research

According to Raymond James, U.S. and Canada carloads of oil are expected to more than double in three years from 281,022 in 2012 to 772,527 in 2015. This would represent a much more significant piece of the pie for the rails especially given our expectation of strong margins for this business. There are several things that could slow down this growth including limited tank car availability, less than expected loading and unloading capacity, and environmental concerns. Bigger picture, we would expect that volumes of oil shipped by rail would fall if oil prices were to drop significantly from current levels as producers might cut production.

Longer Term Impact Vary

This oil-by-rail trend is very fluid driven by a number of different factors. Longer term, we do not expect rails to replace pipelines but to serve more as a complement. The pipelines have an unbeatable cost structure which will help them regain market share once the system is up and running. We believe that the rail industry has proven itself in a short amount of time as a legitimate source of crude oil transportation. The rails offer a good source of diversification for producers and users of crude oil. The large amount of investment in the oil-by-rail platform by the refining and midstream industries makes us feel comfortable that this is not just a passing fad. In some geographic areas (East Coast) we expect the oil-by-rail story to remain strong and for some products (Alberta Oil Sands) we believe the competition with pipelines will still be compelling.

One area to watch longer term is movement of oil-by-rail to the coasts. We are already seeing this ramp up, especially in the East, as pipeline capacity is low and expected to be limited in the future. Coastal refineries are taking advantage of lower cost shale oil while displacing more expensive foreign waterborne crude imports. In addition, the oil shipped from the Bakken is higher quality oil which is more easily processed and more environmentally friendly, key demands for these particular refineries. New pipeline capacity and changing pricing dynamics will have a lot to do with the direction of oil transport across North America. As new pipelines are constructed on route to the Gulf Coast, we believe that a glut of oil will hit that will discount the local oil price of Light Louisiana Sweet (LLS). Producers of oil will be incentivized to ship oil to the coasts where the benchmark is Brent, which we expect will be significantly higher than LLS.

As mentioned before, we expect production of Canadian heavy oil to be very strong in the near to intermediate term. We expect that a lot of that oil will end up in the Gulf Coast. That grade of oil works well with the more advanced refineries in that region. New pipelines running through the middle of the United States will facilitate the transport of that oil. In addition, oil imported from Mexico and Venezuela continues to be on the decline which will free up refining capacity. There are a couple of extra costs associated with the shipment of this heavy oil via pipeline. First, is the volume penalty. A chemical, called diluent, has to be added to this heavy oil to enable movement through a pipeline. For example, 40 barrels of diluent would need to be added to 100 barrels of heavy oil. So transportation costs are based on 140 barrels not 100 barrels raising costs by 40%. The other major cost is getting the actual diluent, which many producers in Canada may have to import from the southern U.S. Therefore, producers are effectively shipping 180 barrels which raises the cost by a total of 80%. This makes the shipment of this heavy Canadian oil by rail much more cost competitive as the rail industry uses heated tank cars which do not require the addition of a diluent.

Oil-By-Rail Has Neutral to Positive Implications for Our Credit Outlook

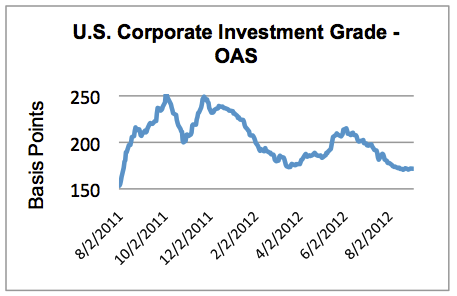
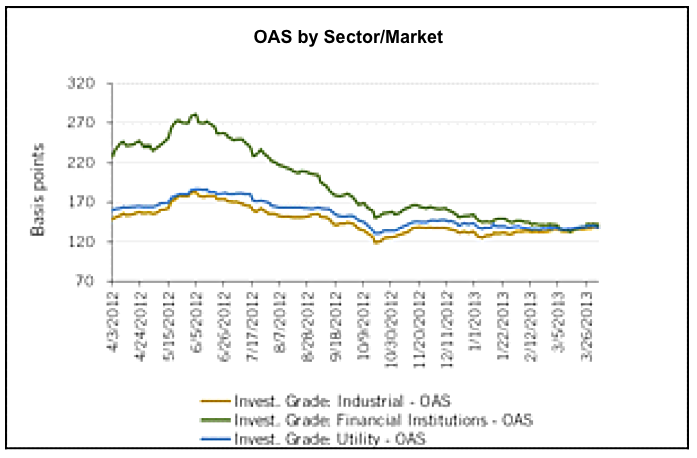
From a credit perspective, we continue to be positive on the railroad industry. The rails have grown into a better diversified and more efficient mode of transportation. The industry has gained market share and profits from pricing opportunities given the cost benefit advantage enjoyed by shippers. We expect volumes to follow U.S. GDP as the rail industry ships most of the everyday items used by the typical consumer. While we don’t believe that the oil-by-rail opportunity is a game changer, we think it can only help the bottom line for all of the class 1 rails. As explained above, the boost to the railroad’s oil business comes at a good time given disappointing results from coal. In the short to intermediate term, we expect the oil business for rails to be a much bigger part of the overall business than ever before assuming the price of oil stays relatively high and production remains robust. In terms of credit ratings, we expect the rail industry to migrate into the high-triple-B to low-single-A category. The OAS of the sector is almost on top of the broader set of industrials. We have assigned an attractive relative value recommendation to the rail industry given our expectation of fundamental improvements and spreads that should trade significantly through industrials.

Michael J. Ashley
Vice President, Corporate Credit


For more information, contact:

Colin T. Dowdall, CFA
Director of Marketing and Business Development
colin.dowdall@aamcompany.com


1 “Moving Crude Petroleum by Rail,” Association of American Railroads,(December 2012):1, accessed May 8, 2013, https://www.aar.org/keyissues/Documents/Background-Papers/Moving%20Crude%20Petroleum%20by%20Rail%202012-12-10.pdf
2 “Moving Crude Petroleum by Rail,” 4.
3 Justin Yagerman, Robert Salman, CFA, and Joshua Katzeft, “Takeaways from Houston Crude By Rail Summit,” Deutsche Bank Markets Research: Crude by Rail Update (March 4, 2013): 2.
4 Steven P. Hansen, CMA, CFA, Patrick Tyler Brown CFA, Arthur W. Hatfield, CFA, et al., “Crude Oil Comes of Age: Walk, Run, Sprint: Positioning for the Marathon,” Raymond James Global Research: Transportation and Energy Industry Report (March 25, 2013): 5.
5 Steven P. Hansen, CMA, CFA, Patrick Tyler Brown CFA, Arthur W. Hatfield, CFA, et al., “Crude Oil Comes of Age: Walk, Run, Sprint: Positioning for the Marathon,” 5.
6 Steven P. Hansen, CMA, CFA, Patrick Tyler Brown CFA, Arthur W. Hatfield, CFA, et al., ., “Crude Oil Comes of Age: Walk, Run, Sprint: Positioning for the Marathon,” 6.
7 Steven P. Hansen, CMA, CFA, Patrick Tyler Brown CFA, Arthur W. Hatfield, CFA, et al., “Crude Oil Comes of Age: Walk, Run, Sprint: Positioning for the Marathon,” 31.
8 Steven P. Hansen, CMA, CFA, Patrick Tyler Brown CFA, Arthur W. Hatfield, CFA, et al., “Crude Oil Comes of Age: Walk, Run, Sprint: Positioning for the Marathon,” 14.


Disclaimer: Asset Allocation & Management Company, LLC (AAM) is an investment adviser registered with the Securities and Exchange Commission, specializing in fixed-income asset management services for insurance companies. This information was developed using publicly available information, internally developed data and outside sources believed to be reliable. While all reasonable care has been taken to ensure that the facts stated and the opinions given are accurate, complete and reasonable, liability is expressly disclaimed by AAM and any affiliates (collectively known as “AAM”), and their representative officers and employees. This report has been prepared for informational purposes only and does not purport to represent a complete analysis of any security, company or industry discussed. Any opinions and/or recommendations expressed are subject to change without notice and should be considered only as part of a diversified portfolio. A complete list of investment recommendations made during the past year is available upon request. Past performance is not an indication of future returns.

This information is distributed to recipients including AAM, any of which may have acted on the basis of the information, or may have an ownership interest in securities to which the information relates. It may also be distributed to clients of AAM, as well as to other recipients with whom no such client relationship exists. Providing this information does not, in and of itself, constitute a recommendation by AAM, nor does it imply that the purchase or sale of any security is suitable for the recipient. Investing in the bond market is subject to certain risks including market, interest-rate, issuer, credit, inflation, liquidity, valuation, volatility, prepayment and extension. No part of this material may be reproduced in any form, or referred to in any other publication, without express written permission.

April 12, 2013 by

First Quarter – 2013

  • Corporate Market Generates Modest Excess Returns vs. Treasuries
  • Financial Sector Outperforms Industrials and Utilities; BBBs Outperform As
  • Company Fundamentals Remain Sound But Idiosyncratic Risk Has Increased with Two Leveraged Buyouts Announced
  • Headlines in Europe and Sequestration in the US Resulted in Minimal Spread Volatility
  • AAM Expects Similar Performance from Corporate Bonds in the Second Quarter

Investment Grade Corporate Bond Spreads Tighten Modestly

The Investment Grade Corporate market started the year well, as spreads tightened 8 basis points (bps) in response to fiscal cliff resolution and better than expected economic data. After the first week, the enthusiasm waned with increased event risk (e.g., Dell leveraged buyout (LBO)) and investor concern with the technical support of the fixed income market if rates moved sharply higher. Spreads have been stable despite the government spending reductions, Italian election uncertainty, and the Cyprus bail-out (Exhibit 1). New issuance in all markets remains healthy, and new issue demand has been very strong with deals remaining well oversubscribed.

Exhibit 1
AAM Corp Credit 1Q2013 1
Source: Barclays Capital, AAM

The Investment Grade Corporate market earned 0.28% over Treasuries in the first quarter 2013 per Barclays. The Finance sector continued to outperform as did BBB rated securities (Exhibit 2). Investors looked to Finance and Utilities as safe haven sectors as opposed to the more event risk prone Industrial sectors like Energy, Telecommunications, Technology, and Consumer NonCyclicals. Industrial bonds with long maturities performed particularly poorly (-101 bps), as investors recognized the lack of spread protection in the face of increased volatility.

Exhibit 2
AAM Corp Credit 1Q2013 2
Source: Barclays Capital, AAM
Exhibit 3
AAM Corp Credit 1Q2013 3
Exhibit 3 shows the difference in industry excess returns vs. the Corporate market overall for the first quarter of 2013 and our expectation for the entire year. It is clear that Finance has exceeded our expectations thus far. Not only has Insurance performed strongly, but Banks and REITs as well. In Industrials and Utilities, we are taking advantage of current market levels, and believe the following are particularly:

Unattractive

  • Telecom, Media (Networks), Technology – We believe softening credit fundamentals, heightened event risk, and the prospect for new issuance are not reflected in relatively tight spread levels.
  • Electric Utilities – We anticipate fundamentals to remain relatively stable in 2013 given our modest domestic growth expectations.  However, we anticipate the sector’s excess returns to be among the weakest due to limited spread compression opportunities and its OAS, which trades well inside of its one year average.
  • Food & Beverage – Event risk is very high in this sector due to LBO risk (e.g., Heinz) and pressure to generate satisfying returns for shareholders including spin-offs and mergers and acquisitions. Fundamentally, we like the large, global participants with strong brand equity and balance sheets, but they offer little value from a spread perspective.

 Attractive

  • Energy – We believe that most of the Energy space is fairly valued.  However threats of increased investor activism at Hess, Transocean and Nabors in January 2013 combined with good fundamentals has provided opportunities in the Oil Service subsector, which we now value attractively (To read more, please see our recent white paper, “[download id=”11″]”
  • Metals & Mining – New issuance has re-priced this sector, and we have taken advantage of that opportunity. We expect that commodity prices will be volatile but should be supported by better demand from China. We expect mergers and acquisitions will pick up this year, resulting in attractive new issuance opportunities.
  • Pipelines – We have a favorable relative value opinion of the Pipeline sector due to positive growth characteristics, improved credit profiles and comparatively cheap valuations.

Industry Highlights – Banking and Energy

As part of our investment process, analysts internally present industry specific topics that are relevant to fixed income investing. Two of these presentations in the first quarter included Banks – Orderly Liquidation Authority (OLA) and Energy – Transformational Times in North America.

We highlighted OLA in our “[download id=”10″]” and since that time, Moody’s reiterated its Negative Outlook on the systemically important U.S. Banks. This Outlook reflects its concern that regulatory support is weakening given the prospect of a credible resolution regime (enshrined in OLA). Concurrent with the expectation for a formal OLA proposal later this year, Moody’s expects to update its bank holding company rating support assumptions by year-end. Worst case, if Moody’s removed its notching for systemic support, Bank of America and Citigroup could see their bank holding company ratings lowered to Ba1. Our expectation is for Moody’s to remove a notch of rating support, resulting in one-notch downgrades across the board. Given our fundamental outlook and the spread tightening to date, we do not expect material spread tightening for the large domestic banks in the near term. To read more about the risks on the horizon for the banking sector, see “[download id=”9″]”

In Energy, we presented the potential for liquefied natural gas (LNG) exports from the U.S, in the intermediate term with the expectation of a domestic oil production surge and ultimate approval and construction of the Keystone XL pipeline. We expect the energy revolution to be a driver of economic activity in the U.S. in addition to the housing recovery and a deleveraging consumer. Specifically, we are taking advantage of transportation companies such as relevant pipelines and railroads. Railroads will benefit from the production regardless of the construction of the Keystone XL pipeline, as they currently transport crude oil from the burgeoning Bakken Shale in the Great Plains to the refineries located in the Gulf Coast, mid-Continent and Rust Belt. If the Keystone XL pipeline was built, they would remain critical in the transportation of materials such as the chemicals used to transport the oil to the refineries through the pipeline. Moreover, the low natural gas prices in the near to intermediate term is beneficial to US manufacturers, potentially allowing them to reclaim manufacturing activities lost in the 2000s from emerging market countries.[1]

Fourth Quarter Earnings Season Exceeded Lowered Expectations

Earnings and sales growth were better than expected in the fourth quarter of 2012, with the companies in the S&P 500 reporting sales growth of 3.7% and earnings growth of 9.2% versus the fourth quarter of 2011. All sectors but Energy reported positive sales growth in the fourth quarter. The Finance sector posted the strongest performance with sales growth of 22%. The aggregate EBITDA margin fell modestly in the fourth quarter, continuing its downward path since the peak in 2011. Management commentary was marginally positive in particular about China.

As earnings growth slows and debt balances grow, gross debt leverage continues to creep higher, but it remains lower than its peaks in 2003 and 2009, especially on a net debt basis (Exhibit 4).

Debt leverage has increased for Metals & Mining companies due more to falling cash flows, as the global economy (mainly China) has cooled, bringing commodity prices down. Whereas, acquisitions have resulted in increased debt balances for sectors such as Consumer and Healthcare. The level of cash on balance sheets continued to grow throughout the year.

Exhibit 4
AAM Corp Credit 1Q2013 4 
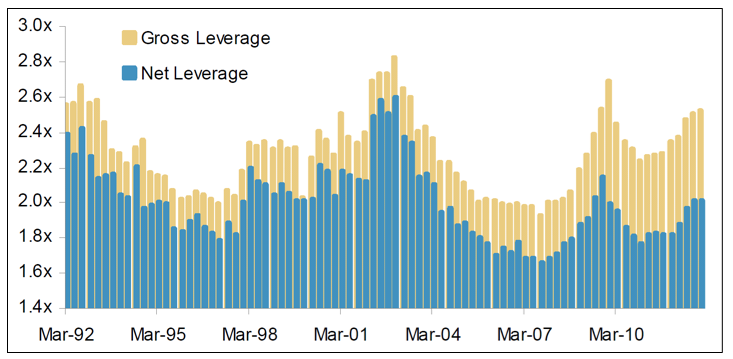
Notes: Gross leverage is Total Debt/ LTM EBITDA. Net leverage is (Total Debt Less Cash/EBITDA.
Source: Morgan Stanley Research, Bloomberg, Yieldbook

Capital spending remained quite strong in the fourth quarter, increasing 13% year-over-year or 4% vs. the third quarter. We continue to believe that the low cost of funds and the lower level of systemic risk (given the central bank support) will incentivize management teams to invest in their businesses. That said, we expect the rate of growth to continue to decline in 2013, driven primarily by the lower level of spending from Metals/Mining and Energy companies, which comprise a dominant share of the overall level of capital spending (Exhibits 5A and 5B).

Exhibit 5A 
AAM Corp Credit 1Q2013 5A
Exhibit 5B
AAM Corp Credit 1Q2013 5B

Source: AAM, CapitalIQ (analysis based on 280 Industrial companies)
Lastly, the very low cost of debt and reduced systemic risk (given worldwide central bank support) are resulting in an increased appetite for leverage. We are witnessing this as credits such as CenturyLink, AT&T, ADT and Safeway increase debt to reward shareholders, resulting in modest rating downgrades. Extreme examples are the leveraged buyouts for Dell and Heinz, and Verizon’s publically stated goal of buying Vodafone’s 45% stake in Verizon Wireless, which would cost more than $100 billion and likely result in its low-A ratings to fall to mid/high BBB.

AAM Expects Similar Performance from Corporate Bonds in the Second Quarter

First quarter earnings season has started and we expect companies to continue their trend of surprising to the upside, as expectations have been set fairly conservatively. The second quarter is expected to be the softest from an economic perspective in the U.S. due to the fiscal tightening. Since the second quarter is expected to be soft, we expect spreads to remain relatively stable. The catalyst for change is likely to occur later in the quarter when investors should have a more informed opinion of the trajectory of growth in the second half. We would not expect that to occur earlier based on management outlooks or commentary in earnings calls, but it is a possibility.

We continue to expect the Corporate market to generate positive excess returns vs. Treasuries in 2013 driven primarily by yield (vs. spread tightening). The level of excess return year to date has been underwhelming due to two main reasons: (1) the underperformance of high quality Industrials and (2) the underperformance of long end maturities. We would not expect either to reverse in the second quarter unless the trajectory of growth expected for the second half of 2012 is modified lower.

Written by:
Elizabeth Henderson, CFA
Director of Corporate Credit

Disclaimer: Asset Allocation & Management Company, LLC (AAM) is an investment adviser registered with the Securities and Exchange Commission, specializing in fixed-income asset management services for insurance companies. This information was developed using publicly available information, internally developed data and outside sources believed to be reliable. While all reasonable care has been taken to ensure that the facts stated and the opinions given are accurate, complete and reasonable, liability is expressly disclaimed by AAM and any affiliates (collectively known as “AAM”), and their representative officers and employees. This report has been prepared for informational purposes only and does not purport to represent a complete analysis of any security, company or industry discussed. Any opinions and/or recommendations expressed are subject to change without notice and should be considered only as part of a diversified portfolio. A complete list of investment recommendations made during the past year is available upon request. Past performance is not an indication of future returns.

This information is distributed to recipients including AAM, any of which may have acted on the basis of the information, or may have an ownership interest in securities to which the information relates. It may also be distributed to clients of AAM, as well as to other recipients with whom no such client relationship exists. Providing this information does not, in and of itself, constitute a recommendation by AAM, nor does it imply that the purchase or sale of any security is suitable for the recipient. Investing in the bond market is subject to certain risks including market, interest-rate, issuer, credit, inflation, liquidity, valuation, volatility, prepayment and extension. No part of this material may be reproduced in any form, or referred to in any other publication, without express written permission.

[1] Manoj Pradhan, “Market Insights: EMs must respond to US industrial revival,” Financial Times. April 10, 2013, accessed April 10, 2013

April 9, 2013 by

The US banking sector is currently characterized by good credit fundamentals and supportive technicals. A key risk offsetting this credit strength is the prospect of a new bank resolution regime (Orderly Liquidation Authority) imposed by regulators. Of particular interest to bank creditors is the possibility that a resolution regime imposes mandatory bail-in requirements on bank capital structures and mandates minimum levels of bank bond issuance. This article will examine the potential form of such a regime, direct implications for bank bond investors and a review of how we are positioning insurance portfolios in advance of a formal proposal from regulators.


What is Orderly Liquidation Authority?

Orderly Liquidation Authority (“OLA”) was created by the Dodd-Frank Wall Street Reform and Consumer Protection Act of 2010 (the “Act”).  OLA authorizes the creation of a resolution regime for the purpose of receivership and orderly liquidation of a failing financial institution(s) whose collapse would endanger the US economy.  The Act explicitly prohibits the use of taxpayer funds to prevent such liquidation, and instead mandates liquidation of any institution placed into receivership.  The Act delegates responsibility for creation and administration of a resolution regime to the US financial regulators.

At its heart, OLA is meant to provide regulators the means to wind-down systemically important financial institutions that are in danger of failing in a disorderly manner such that the broader economy is damaged (i.e., another Lehman).  The goal of OLA is to maintain the stability of the financial system while removing the perceived moral hazard that was created by the government bail-outs that occurred during the 2008 global financial crisis (TARP /AIG bail-out).

OLA Details? (You’ll have to be patient…)

When OLA became the law of the land in July 2010, it authorized financial regulators (Federal Reserve, SEC, FDIC, and the Federal Insurance Office) to create a detailed resolution regime which would be proposed to the Secretary of the Treasury.  Nearly three years later, we continue to wait for a proposal.  However, over the past year, regulators have begun to float trial balloons in the form of public speeches and investor outreach meetings, leading us to believe that a Notice of Proposed Rulemaking (NPR) is likely to be issued later this year.

While many details of the emerging OLA regime remain to be disclosed (formulated?), key aspects that have been shared include the regulators’ preference for single-entry receivership at the bank holding company level and the use of capital structure bail-in (write-down of the capital structure) as an alternative to tax-payer funded bail-outs.

Single-entry receivership is the concept of taking control of a failing financial institution at the bank holding company level while allowing the operating subsidiaries to continue normal operations.  Under this approach, the capital structure of the holding company is impaired, potentially all the way up to senior unsecured creditor level, in order to re-capitalize the operating subsidiaries (See Exhibits 1 and 2).  Interim subsidiary operations would be funded by a secured line of credit from the Treasury.  And importantly, the process would benefit from a bankruptcy stay, preventing creditors and trading counterparties from accelerating bank liabilities or seizing collateral.

Source: Wells Fargo Securities and FDIC Presentation – Title II Strategy Overview


Source: Wells Fargo Securities and FDIC Presentation – Title II Strategy Overview

The secured liquidity and bankruptcy stay are critical aspects of the single-entry process.  The liquidity facility allows the distressed institution to continue operations (market making/collateral posting) in the normal course of business.  At the same time, preventing counterparties from breaking derivatives contracts (no default/change of control) or creditors from declaring default (bankruptcy stay) allows the institution to continue as a “going concern.”  These assumptions are theoretical, however, and it remains to be seen whether an institution taken into receivership would be able to maintain franchise value or whether it would face a rapid loss of business.

Unanswered Questions Regarding OLA

Key uncertainties that remain to be determined in any prospective OLA regime include:

  • Which institutions will be subject to OLA? – At a minimum, we expect the four large money center banks (Bank of America, Citigroup, JPMorgan, and Wells Fargo), the two largest broker/dealers (Goldman Sachs, Morgan Stanley) and the two largest custody banks (Bank of New York, State Street) to be included.  Of particular interest is whether the next tier of banks fall within the scope of OLA (US Bancorp, PNC Financial, SunTrust) or even all banks regulated by the Fed (those exceeding $50 billion in assets).
  • What is the trigger for OLA? – Understanding the criteria that regulators would use to implement the OLA regime with a subject financial institution and the discretion they have in implementing the regime will be critical to analyzing the sector going forward.  Minimum capitalization levels have been used as triggers for contingent capital instruments issued in the European Union (i.e., Conversion/write-down triggered when Tier I capital falls below 7%), but clarity on solvency/liquidity driven triggers will be needed as well (After all, Lehman was “well capitalized” when it failed in September 2008).
  • Which parts of the capital structure will be subject to bail-in? – Other jurisdictions that are contemplating resolution regimes (United Kingdom, Switzerland, Germany and the European Union) have taken different approaches to bail-in.  Some countries have designated certain levels of the capital structure as being subject to impairment if a financial institution approaches failure (i.e., Swiss Contingent Convertible Notes or the UK’s Primary Loss Absorbing Capital) while others have stated that the entire capital structure is subject to “hair-cut” (Germany/Denmark).  Which approach the US takes will have material implications for both cross-sector and intra-capital structure relative value.

As envisioned, bail-in of bank bonds would transform that portion of the capital structure from a funding instrument into a capital instrument.  While subordinated bonds, hybrids and preferred securities have always fallen on a spectrum between funding and capital, the imposition of bail-in on senior unsecured would be a fundamental change.  Bank bond spreads have tightened to parity vs. comparable quality industrials over the past six months, after trading wide the previous five years (Exhibit 3).  The main risk to bank bond investors from the imposition of a bail-in regime is that the market adds a risk premium to all bonds in the sector to reflect the changed regulatory event risk, which would result in widening bond spreads.

Source: Barclays
Source: Barclays

Further, moving the decision to bail-in the capital structure into the scope of regulator discretion (and the associated bankruptcy stay) would also raise uncertainty surrounding a credit as it fell into distress. This raises the probability of investors running for the exit at the first sign of trouble; an issue that we are uncertain the regulators fully appreciate. Bank bonds have clearly been more volatile than the Barclays Corporate Index since the 2008 financial crisis, but the prospect of bail-in would likely prolong and possibly exacerbate this phenomenon.

Related to the risk associated with imposing bail-in, regulators have also pondered imposing minimum bank holding company debt levels. A minimum debt requirement would assure that a bank’s capital structure is of sufficient size to absorb the impairment necessary to re-capitalize its operating subsidiaries in a bail-in scenario. A key factor in the outperformance of bank bonds over the past three years has been the technical benefit from a shrinking overall universe of bank bonds as maturing issues were funded by deposits rather than refinanced (Exhibit 4). The prospect of increased issuance (as well as increased holding company debt leverage) imposed by OLA would likely set a floor for bank bond spreads, if not resulting in outright spread widening.

Source: Barclays
Source: Barclays

How Are We Positioning for OLA

Although many of the critical details will not be available until the Fed releases its Notice of Proposed Rulemaking, there are a number of ways to position clients within the bank sector.  This positioning is based on the assumption that an OLA regime including some form of bail-in is a certainty.  We cannot justify dis-investing in the sector on the basis of the possibility of a bail-in regime which raises the possibility of spread widening.  However, there are three concrete steps we can take:

  1. Avoid holding company subordinated debt – This insulates our portfolios against the possibility that bail-in applies only to subordinated portion of the capital structure, as well as the possibility that additional issuance is mandated.
  1. Favor bank level issuance over holding company issuance – Under single-entry receivership, only holding company bonds should be eligible for bail-in (in order to avoid broader financial system dislocation).  As such, even bank level subordinated paper should be insulated from bail-in under an OLA regime, offering a reasonable relative value alternative to holding company senior unsecured bonds.
  1. Avoid bank capital securities – It has become clear that the junior portion of the capital structure is viewed as “bail-in eligible” by regulators, even before Dodd-Frank Act introduced the concept of OLA (recall Citigroup’s 2009 exchange).  However, it appears that capital securities still trade based on cost of funds (as opposed to cost of capital) as demonstrated by the clear correlation between senior unsecured and subordinated debt.
Source: Barclays
Source: Barclays

Conclusion

The expected announcement of OLA details is the most prominent domestic event risk for the bank sector over the near-term.  However, until a formal proposal is released by the regulators, the ultimate impact of OLA on bank fundamentals and relative value is tough to discern.  It is also possible the bank spreads already reflect the potential negative impacts of OLA, and the formal proposal will serve as a catalyst for further tightening.  We continue to position our clients in holding company senior unsecured and bank level subordinated bonds which we believe offer the best combination of relative value and defensiveness within the sector.  Ultimately, we believe strong underlying fundamentals and the likelihood of an extended adoption period should offset credit impact of OLA, but investors should be prepared for the possibility of near-term volatility.

N. Sebastian Bacchus, CFA
Vice President, Corporate Credit


For more information, contact:

Colin T. Dowdall, CFA
Director of Marketing and Business Development
colin.dowdall@aamcompany.com


Disclaimer: Asset Allocation & Management Company, LLC (AAM) is an investment adviser registered with the Securities and Exchange Commission, specializing in fixed-income asset management services for insurance companies. This information was developed using publicly available information, internally developed data and outside sources believed to be reliable.  While all reasonable care has been taken to ensure that the facts stated and the opinions given are accurate, complete and reasonable, liability is expressly disclaimed by AAM and any affiliates (collectively known as “AAM”), and their representative officers and employees.  This report has been prepared for informational purposes only and does not purport to represent a complete analysis of any security, company or industry discussed. Any opinions and/or recommendations expressed are subject to change without notice and should be considered only as part of a diversified portfolio. A complete list of investment recommendations made during the past year is available upon request. Past performance is not an indication of future returns.

This information is distributed to recipients including AAM, any of which may have acted on the basis of the information, or may have an ownership interest in securities to which the information relates.  It may also be distributed to clients of AAM, as well as to other recipients with whom no such client relationship exists.  Providing this information does not, in and of itself, constitute a recommendation by AAM, nor does it imply that the purchase or sale of any security is suitable for the recipient. Investing in the bond market is subject to certain risks including market, interest-rate, issuer, credit, inflation, liquidity, valuation, volatility, prepayment and extension. No part of this material may be reproduced in any form, or referred to in any other publication, without express written permission. 

November 20, 2012 by

Thanksgiving is here and Christmas is right around the corner. This is a very important time of year for the retailers as up to 40% of annual revenues are realized during the holiday season. The retail industry has performed well this year despite concerns stemming from the fiscal cliff situation and continued low growth in the U.S.  Various analysts and trade organizations predict that holiday sales will be up anywhere from 2% to 4%. We believe that sales for this year will come in at the upper end of that range. The following article explores some of the more important drivers of our analysis.


The Consumer’s Economic Position Is Improving but Big Issues Remain

The most important driver of retail sales is linked to the strength of the consumer. The following table (Exhibit 1) summarizes our analysis of nine different factors which illustrate the typical consumer’s economic position. We make an assessment of the individual factors based on a comparison to last year and to a longer term history.

Source: AAM
Source: AAM

These factors are more positive than last year. We moved from “negative” to “neutral” positions in consumer confidence, housing, and the inflation categories. Looking ahead to developments in Washington, DC, the prospect of lower income from the expiration of the payroll tax cut and jobless benefits are key issues on the minds of consumers. A resolution, in the near term, could impact retail sales. In addition, GDP in the U.S. has tapered off throughout the year and is not expected to be significantly better in 2013.

Statistical Analysis – Purely Quantitative But Continues to Support the Case

Looking back at data over the last twenty years reveals a significant correlation (73%) between “Back to School” retail sales (August and September) and “Holiday” sales (November and December). To complete this analysis, we used the Bloomberg Same Store Sales Composite Index which includes a variety of retailers in the department store, discounter, and specialty subsectors. The model predicts “Holiday” sales of 4.3% when using 5.2% for the “Back to School” sales observed in 2012. This would be significantly better than the average, which was 3.0% over those twenty years.

Seasonal Hiring Resembles Last Year

The National Retail Federation predicts that between 585,000 and 626,000 seasonal workers will be hired this year. This compares to 607,500 last year and is well below the pre-recession numbers which were closing in on 700,000. According to another survey, 39% of employees plan to make some of their seasonal hiring permanent which is up from 30% last year.

Better Inventory and Margins Create Pricing Flexibility

Consumer shopping patterns are not expected to be significantly different this year. Consumers are focused on finding good values/deals which will result in significant promotion activities from stores. We expect a similar buzz around “door busters” and late night/early morning shopping. This year, we believe that retailers are in a better inventory position than last year. We take a look at inventory growth (year/year) in the second quarter and third quarter for the largest retailers in the U.S. over the past three years (Exhibit 2). As you can see, the average growth is significantly down from the last couple of years.

Source: AAM, Bloomberg

As a result, we expect retailers will need to price competitively, but may not have to resort to “fire sale” pricing versus last year. We expect retail margins to be stronger going into the end of year as overall costs have come down. In particular, retailers were able to benefit from lower cotton prices earlier in the year when orders for holiday merchandise were made. All in all, it does not appear that retailers are increasing volume to drive sales as was the case last year. If the retailers get the sense that sales are trending below expectations, they have the ability to adjust pricing given a stronger margin position this year versus last year.

Online Shopping Continues to Gain Importance

Cyber-shopping will, once again, be very important this year. We continue to see the push from brick and mortar retailers to enhance their online shopping capabilities. This year, we have heard retailers will match online pricing from retail websites, including pure online retailers such as Amazon.com. Wal-Mart has a new system that checks online pricing every 20 minutes. Last year, online sales were up 14% in November and December. According to a survey by the National Retail Federation, 51.8% of consumers are expected to shop online the year compared to 46.7% last year. The importance of having a strong online interface for retailers is increasing. Exhibit 3 shows that online sales as a percent of total retail sales are growing.

Source: US Census Bureau Retail Sales; comScore eCommerce Sales

NPD Survey Is Positive for 2012 Holiday Sales

According to a recent survey by the NPD Group, consumers are expected to spend more this holiday season. An estimated 77% of shoppers are expected to spend more or the same this year, compared to 73% last year and 70% in 2010. These findings represent over 3,600 completed surveys.

Screen Shot 2016-01-27 at 11.10.08
Source: NPD Group; Morgan Stanley Research

Weather and Nuances of the Holiday Calendar Should Help

Weather and the changing calendar are always important factors for holiday spending. Last year was one the warmest holiday shopping seasons on record which impacted seasonal items (i.e., coats, scarfs), which are more important to the department store segment. This year, November is expected to be similar to last year, and December is expected to be significantly colder. This should be a positive driver, assuming that a heavier than normal amount of snow does not keep shoppers from driving.

While very unpredictable, a serious weather event can dramatically impact retail sales. We saw this in the first week of November in the Northeast with Hurricane Sandy. Citigroup estimates that same store sales for the department stores will be negatively impacted by 1.5% to 2.5%.  While discounters could experience a slight benefit as much as 1.0%, as stock-up and restocking trips offset the lost traffic during the storm. There should be enough time until the end of the year for retailers to recapture those lost sales as homeowners in those areas receive insurance and begin to rebuild. Having said that, it is still very early in that process to know how spending will ultimately be impacted. It’s not unreasonable to assume that many families in those areas will spend less this holiday season.

The days between Thanksgiving and Christmas are key shopping days. This year, those days total 32 versus 30 last year. In addition, this year Christmas falls on Tuesday (It was on Sunday last year), which gives shoppers an extra day to shop on the weekend. We expect the changing calendar will positively affect the retailers.

Summary

The above analysis helps to support a more optimistic opinion on retail sales for this year.  We recognize there are some major issues that are coming to a head in the near term including the fiscal cliff, which could have a dramatic impact on consumer spending. Our analysis is based on our assumption that the fiscal cliff issues will be diluted by “kicking the can down the road.” In addition, if the issue goes to the 11th hour (end of December) as we expect, then holiday sales will have already happened. While this is a major issue on consumers’ minds, it doesn’t appear that spending is being held back today. This issue becomes more of a concern for consumer spending if it does not appear that some type of resolution will be met as we head to the end of the year. Finally, we may see downward pressure on sales in the northeast as those areas recover from Hurricane Sandy. This could have a significant impact on spending this holiday season.

Michael J. Ashley
Vice President, Corporate Credit


For more information, contact:

Colin T. Dowdall, CFA
Director Marketing and Business Development
colin.dowdall@amcompany.com


1 NRF’s 2012 Holiday Survival Kit: Holiday Forecasts, Consumer Trends and Historical Retail Sales Data, National Retail Foundation, page 6
2 Adams, Susan. “Who’s Hiring The Most This Holiday Season,” Forbes, November 6, 2012, https://www.forbes.com/sites/susanadams/2012/11/06/whos-hiring-the-most-this-holiday-season-2/
3 Lorriane Hutchinson, Robert Ohmes, and Denise Chai, “2012 Holday preview: The Grinch may not steal Christmas,” Bank of America Merrill Lynch Industry Overview – Retailing, October 16, 2012, page 16.
4 Liz Dunn and Laurent Vasilescu, “Holiday Preview: O’Christmas Trade, O’Christmas Trade, the Year Can Still Be Salvaged,” Macquaire Capital (USA) The Equities Research Specialist, October 22, 2012, page 3.
5 Deborah Weinswig, Nathan Rich, Tifany Kanaga, and Ashley Hartigan, October Same Store Sales Review, Citi Research-Equities, November 2, 2012, page 4.


Disclaimer: Asset Allocation & Management Company, LLC (AAM) is an investment adviser registered with the Securities and Exchange Commission, specializing in fixed-income asset management services for insurance companies. This information was developed using publicly available information, internally developed data and outside sources believed to be reliable.  While all reasonable care has been taken to ensure that the facts stated and the opinions given are accurate, complete and reasonable, liability is expressly disclaimed by AAM and any affiliates (collectively known as “AAM”), and their representative officers and employees.  This report has been prepared for informational purposes only and does not purport to represent a complete analysis of any security, company or industry discussed. Any opinions and/or recommendations expressed are subject to change without notice and should be considered only as part of a diversified portfolio. A complete list of investment recommendations made during the past year is available upon request. Past performance is not an indication of future returns.

This information is distributed to recipients including AAM, any of which may have acted on the basis of the information, or may have an ownership interest in securities to which the information relates.  It may also be distributed to clients of AAM, as well as to other recipients with whom no such client relationship exists.  Providing this information does not, in and of itself, constitute a recommendation by AAM, nor does it imply that the purchase or sale of any security is suitable for the recipient. Investing in the bond market is subject to certain risks including market, interest-rate, issuer, credit, inflation, liquidity, valuation, volatility, prepayment and extension. No part of this material may be reproduced in any form, or referred to in any other publication, without express written permission. 

November 6, 2012 by

Strong Performance from Investment Grade Corporates

  • QE3 has Increased Demand for Investment Grade Corporates
  • Company Earnings and Outlooks have been Weaker than Expected
  • Spreads are Fully Valued but Technicals Remain Supportive
  • Rating Migration to BBB is Expected to Continue within Investment Grade Industrials
  • A/AA Rated Industrial Credit Spreads Do Not Reflect Increased Credit Risk
Investment Grade Corporate Bond Spreads Reacted Positively to QE3

The Investment Grade Corporate market rallied, propelled by more quantitative easing (QE) than expected, benign European headlines (including Moody’s affirmation of Spain), and better than expected economic data. While the equity, high yield and credit default swap (CDS) markets reacted negatively to weak earnings reports, investment grade spreads remain largely unchanged (Exhibit 1). We believe spreads are benefitting from the increased demand due to QE3, as the supply of mortgage backed securities has contracted. This is likely to become more pronounced when/if the European Central Bank (ECB) starts its Outright Monetary Transactions (OMT) program. European investors returned to the Corporate market in August, and we expect this continued in September (Exhibit 2).

The Investment Grade Corporate market earned 1.17% over Treasuries in September and 1.47% in October, increasing the year-to-date excess return to 7.63% per Barclays. The Finance sector continued to outperform as did BBB rated securities and long maturities. From an industry perspective, those more levered to the economy outperformed the more defensive, higher quality sectors. New issuance in all markets remains healthy and new issue concessions nonexistent except for the lower yielding, higher quality deals. Since September, credit curves have flattened more than expected with the short and long ends benefitting from the increased demand due to QE3. We expect this technical support to continue over the next twelve months, softening the volatility that we expect  from macroeconomic headlines (including fiscal cliff related discussions), weaker company level results and increased shareholder friendly actions.

Exhibit 1

AAM Corp Credit 10-11-12 1

Source: Barclays Capital, AAM

Third Quarter Earnings Have Been Lackluster

This earnings season has been fairly negative, not only from a reporting standpoint for the third calendar quarter, but also from an outlook perspective (Exhibit 3). On earnings calls, management teams have talked about the uncertainties in the marketplace due to upcoming fiscal decisions in the U.S., China and Europe, causing companies to invest more cautiously. This is the second quarter we have seen sales and earnings growth plateau, reflecting the low growth rate of the domestic economy and slowing growth outside the U.S. The only sector that has positively surprised with higher than expected Sales is Finance.

Exhibit 2
AAM Corp Credit 10-11-12 2
Exhibit 3

AAM Corp Credit 10-11-12 3

Source: Bloomberg, AAM (S&P 500 constituents)

We had expected spreads to widen in the second half of 2012 due to our expectation of softening fundamentals, not to mention the potential economic and European related event risk. Historically, there has been a strong relationship between earnings estimates and spreads. As shown in Exhibit 4, since May 2012, this relationship reversed. We believe this reflects the increased demand for Corporate credit, as investors look to earn a higher risk adjusted return over risk free rates in a more uncertain environment.

Exhibit 4

AAM Corp Credit 10-11-12 4

Source: Bloomberg, AAM

How Has AAM Been Investing in Corporates?

After the strong rally, the corporate market is at the tight end of our fair value range. The spread compression between Finance and Industrials is largely over after strong performance from Financial credits this year, but the basis between A and BBB rated Industrials remains too wide (Exhibit 5). We expect continued performance from BBB rated securities, and generally believe A/better rated Industrials are rich.

Exhibit 5

AAM Corp Credit 10-11-12 5

Source: Barclays Capital, AAM

Tactically, we remain defensively positioned in regard to Europe, avoiding European financial and infrastructure credits and hold fewer low quality credits, which we believe are more likely to fall to high yield. We are replacing that yield with a greater percentage of higher quality BBB rated credits and less liquid securities (e.g., private placements) while preserving overall portfolio yield and liquidity. Our security analysis has proven that in Investment Grade, the spread for “reaching for yield” is inadequate to compensate insurance companies for the increase default risk and risk based capital (RBC) charges associated with the credit rating downgrades.

The risk of increased leverage is rising, as the forecast for low rates lengthens and volatility has subsided due to increased support from the Federal Reserve and the ECB. We expect ratings migration to continue from the A to the BBB category.

In a recently published S&P report titled, “The Credit Overhang – 101 Lost ‘As’ – A Dozen Years of Decline for U.S. Industrial Ratings,” the authors detail the migration, including the rationale (Exhibit 6). The authors end the report by stating that “S&P believes that the number of ‘A’ companies will continue to decline. The low cost of debt (especially for investment-grade issuers), the tax advantages of issuing debt, and the pressure to return money to shareholders suggest that other considerations can outweigh the benefit of having an ‘A’ category rating. Under such conditions, S&P believes that companies will be more inclined to take on increased financial risk, even if it means carrying lower credit ratings.”

Exhibit 6

AAM Corp Credit 10-11-12 6

Source: Standard & Poor’s

We generally agree with S&P, which is why we believe it is imperative that one measures credit risk on a forward looking basis, assigning internal credit ratings. We measure returns based on these internal risk assessments, and look to maximize risk adjusted income. An example in the Media sector is in Exhibit 7, showing the differences of our risk assessment vs. the agencies. Spreads for A/AA rated Industrials are historically very tight; therefore, we generally believe investors are not being compensated appropriately for the expectation of increased credit risk.

Exhibit 7

AAM Corp Credit 10-11-12 7

Source AAM, Capital IQ, Bloomberg, broker runs.

Written by:

Elizabeth Henderson, CFA
Director of Corporate Credit

Disclaimer: Asset Allocation & Management Company, LLC (AAM) is an investment adviser registered with the Securities and Exchange Commission, specializing in fixed-income asset management services for insurance companies. This information was developed using publicly available information, internally developed data and outside sources believed to be reliable. While all reasonable care has been taken to ensure that the facts stated and the opinions given are accurate, complete and reasonable, liability is expressly disclaimed by AAM and any affiliates (collectively known as “AAM”), and their representative officers and employees. This report has been prepared for informational purposes only and does not purport to represent a complete analysis of any security, company or industry discussed. Any opinions and/or recommendations expressed are subject to change without notice and should be considered only as part of a diversified portfolio. A complete list of investment recommendations made during the past year is available upon request. Past performance is not an indication of future returns.

This information is distributed to recipients including AAM, any of which may have acted on the basis of the information, or may have an ownership interest in securities to which the information relates. It may also be distributed to clients of AAM, as well as to other recipients with whom no such client relationship exists. Providing this information does not, in and of itself, constitute a recommendation by AAM, nor does it imply that the purchase or sale of any security is suitable for the recipient. Investing in the bond market is subject to certain risks including market, interest-rate, issuer, credit, inflation, liquidity, valuation, volatility, prepayment and extension. No part of this material may be reproduced in any form, or referred to in any other publication, without express written permission.

September 7, 2012 by

Back to Work

  • Corporate Bond Markets Outperformed Treasuries in August
  • European Headlines Will be Plentiful, Leading to Higher Volatility
  • Stimulus in China is Likely by Year-End
  • Companies are Cautious, But Consumers are Still Spending
Investment Grade Corporate Bond Spreads Continue to Tighten in August

Investment grade corporate bond performance in August was strong with Finance outperforming Industrials. The Investment Grade Corporate OAS tightened six basis points (bps) per Barclays. The market earned 0.42% over Treasuries in August, increasing the year-to-date excess return to 4.80% per Barclays (Exhibit 1). “BBB” rated securities have earned 4.87% over Treasuries and 5.09% over “A” rated securities year-to-date (0.54% and 0.38%, respectively, in August). From an industry perspective, Life Insurance outperformed in August (2.03% excess return) and Metals & Mining underperformed -0.99%). The domestic high yield market also performed well, earning 1.15% over Treasuries in August. In Europe, the Corporate market had a good month as well, earning 1.20% of excess return in August according to Barclays.

Exhibit 1

AAM Corp Credit 9-12 1

Source: Barclays Capital, AAM

New issuance in all markets was healthy, and for most deals in the domestic investment grade market, new issue concessions were nonexistent. We expect September to be an active month for new issuance with over $80 billion of supply expected. The market continues to be in our Fair value range, but the risk is skewed to the downside. We would not be surprised if spreads widened this month due to heightened volatility and new issue supply.

How Has AAM Been Investing in Corporates?

We believe the market has largely priced in: (1) the policy actions expected from the Federal Reserve, European Central Bank, and People’s Bank of China, (2) positive headlines from Europe (i.e., a supportive German Constitutional Court, Greece remaining in the Euro, Spain receiving support from the Troika), and (3) an avoidance of the fiscal cliff in the United States. If the market is right, business and consumer confidence is likely to rise, supporting and possibly propelling GDP growth. While our base case reflects market sentiment, we believe the risk and uncertainty surrounding these events is high and will lead to increased volatility. Current spread levels are not compensating investors for heightened volatility. We are defensively positioned for our clients, owning more Corporates versus our benchmarks while avoiding Europe and more cyclical and/or fundamentally weak credits. From a rating perspective, we prefer higher quality BBB rated Industrials/Utilities and domestic Financials versus A rated Industrial/Utilities due to the historically wide spread differential and the importance of income in this environment. We believe it remains prudent to avoid Europe until real fundamental solutions are presented and are not investing in more volatile, weak BBB rated credits due to the lack of value for their deteriorating fundamentals.

European Headlines Will Be Active – Status Quo Most Likely, But Tail Risk Remains

September is a critical month with the Federal Reserve and European Central Bank expected to announce programs to help stimulate their respective economies.  Mario Draghi, President of the European Central Bank, pleased the markets this morning with his announcement that the Securities Market Program (SMP) will be used to purchase government bonds with maturities of one to three years. The amount will be unlimited, but the countries that participate must enter into the rescue fund and comply with such conditions. The ECB has used this program very little in the past due to the objections by the Germans. They objected to this plan as well, and were the sole objectors of the 23 member Governing Council.

Liquidity may be further increased via the European Stability Mechanism (ESM), assuming the German Constitutional Court rules that Germany’s participation in the European Stability Mechanism (ESM) is legal. This announcement is expected on September 12.  We are also waiting for ratification of the ESM by other countries, which are likely post September 12.  Finland has been most resistant to further bail-outs and to the ESM.  A unanimous vote is needed by the European Union countries to move forward.  Importantly, the Dutch election is also September 12 and one such outcome could return a coalition against aggressive austerity and in favor of a Greek exit.

While the ECB’s actions are a near term positive solution for liquidity, we do not view this unconstrained monetization as a long-term solution.  Fiscal unification is required as well as structural reform and growth initiatives for countries in the periphery.  Without growth, deficit and debt reduction cannot be achieved without debt repudiation, a very painful process.  Lastly, unification of European Union (EU) bank regulation is also being discussed, although it is unlikely that it will be in place this year.  The European Commissioner for Economic and Monetary Affairs and the Euro, Olli Rehn, favors giving the EU supervisory power for all euro area banks as this framework is the only one that would allow the euro area to recapitalize banks directly.  It is expected that once this is in place, the ESM will be able to recapitalize the banks similar to what the U.S. Federal Reserve did with T.A.R.P.

In addition, we expect to learn more about Spain’s banking system and how much capital is needed of the €100 billion of aid pledged.  Four of its regions have approached the sovereign for emergency liquidity support and bank deposits (for the country) continue to drain.  Prime Minister Rajoy has not officially asked for a bailout from the Troika, but this is expected over the near term.  The terms are important, since Spain has been diligent with its austerity and in the minds of the Spaniards, is not able to implement further austerity.  Germany has been slowing economically and cannot afford to have a break-up of the Euro.  Therefore, we believe the Germans will capitulate, allowing Spain to enter the program without materially harsher measures.

And, don’t forget Greece!  Prime Minister Samaras has asked key euro policy makers to discuss relaxing its conditions of the last bail out agreement to give Greece another two years to meet its commitments.  This month, the Troika will be examining Greece’s fiscal and economic progress and releasing its report by the end of October.  Although the report is expected to disappoint, it is not a foregone conclusion that Greece will leave the Eurozone with a 30% probability (per Intrade) being assigned to its departure this year.

From a ratings perspective, Moody’s left Spain’s rating on review, waiting for more details from the German court and Spain’s funding requirements.  It also placed the EU’s triple-A rating on negative outlook, reminding investors of the correlation between the four largest member states’ (Germany, France, Netherlands, UK) ratings and the EU’s rating.

China – Expect More Policy Action Over the Near Term

We continue to see evidence of a slowing economy, exemplified by the latest manufacturing report. Policy action so far has not gotten sufficient traction; therefore, more is expected to maintain growth. Specifically, the market expects China to cut its reserve ratio by 150 basis bps by year-end. Inflation concerns should be tempered by recent reports, although policy action may be delayed due to the transition in leadership in November. While growth has come down and the overall contribution to world GDP is quite large, companies are revising their spending plans in the country, a near term consequence. For instance, Metals and Mining companies are extending their capital spending plans because of lower commodity prices and higher costs and Media companies are cutting their revenue forecasts due to a lower growth rate for advertising. In addition, large, global conglomerates such as Caterpillar (CAT) have suffered. CAT is cutting production in China and will export to other parts of the world to get inventory in that region to a more comfortable position.

In summary, we believe the government will remain supportive with policy action later this year, but are more cautious and concerned with the secondary affects on the Corporate sector since China has been a significant contributor to many companies’ financial results.

Sector Fundamental Reviews

We thought it would be worthwhile to revisit our fundamental sector views due to the slowing economic growth worldwide. Second quarter results highlighted managements’ uncertainty and caution with few increasing 2012 estimates. Pricing was more difficult, higher input costs and a stronger dollar affected margins, and emerging market growth was weaker than expected. We are seeing an increase in share repurchase activity, a logical step given the cash on the balance sheet and political and economic uncertainty, suppressing organic investment and acquisition activity.

Finance – Fundamentals Remain on Track, But Spreads Have Compressed
Banks – Improving Asset Quality and Loan Growth, But Revenue Growth is Anemic and Event Risk is Rising

Finance bonds have performed very well this year, compressing with Industrials (Exhibit 2), due to continued fundamental improvement and technical support as net supply is expected to be meaningfully down this year.  Domestic banks largely met expectations in the second quarter. Bank fundamentals have been on a steady improving trend for twelve quarters driven by improving asset quality, as the banks have steadily repaired their balance sheets.  Falling credit costs have been the key driver of profitability, which has in turn driven balance sheet repair in the form of growing capital and continued run-off of non-core loan portfolios (commercial real estate, home equity). Modest loan growth has continued with banks expecting commercial and industrial lending growth of 2%, rolling out more credit card and installment lending to consumers, and being more active in auto and student lending. Banks are taking advantage of the deleveraging required by European banks, as well as becoming more aggressive with leveraged buyout and syndicated lending. We continue to believe it’s not banks’ willingness to lend, but companies’ unwillingness to add debt that has held back loan growth.

Exhibit 2

AAM Corp Credit 9-12 2

Source: Barclays Capital, AAM

However, we are beginning to see a counter-trend of top-line revenue pressure due to the protracted low interest rate environment. While modest loan growth has somewhat offset compressing interest margins, net interest income has fallen in seven of the last nine quarters. Additionally, the money center banks’ non-interest income has been pressured by weak capital markets revenues over the past two years as the Eurozone crisis has driven down volumes and Basel III has led to the exit of select capital market businesses. The result has been deteriorating efficiency ratios (non-interest expense/net revenues) despite continued expense reduction initiatives and pressure on the absolute level of bank profitability despite improving pre-tax margins.

While the improving asset quality and capital growth trends have been fundamentally positive for bank creditworthiness, the sector has struggled to generate adequate returns for shareholders. The combination of higher capital requirements under Basel III, low interest rates and weak economic growth are causing banks to struggle to achieve adequate return on equity and return on assets. As a result, the credit positive of steady balance sheet improvement is offset by our concerns that event risk may be rising as management faces pressure from equity holders (not to mention the specter of macro-political risk in the forms of the Eurozone crisis and the U.S. fiscal cliff).

REITs – Fundamentals Continue to Improve and Management Remains Prudent

The industry remains fundamentally healthy with management remaining disciplined towards acquisitions and development despite very strong liquidity. Broadly, occupancy and rental rates are increasing in Retail and Multi-family while Office remains challenged. Financial metrics have improved post financial crisis especially liquidity.

Insurance – Companies are Navigating Well in this Environment

Earnings were stronger than expected for Life companies with interest rate swaps and less liquid, higher yielding assets (e.g., commercial real estate, private placements) helping to mitigate the effects of falling interest rates. Property and Casualty company results were as expected. The sector that disappointed was Health due to higher medical expenses. Although, we see this as a short term phenomenon, as the companies will work again to increase rates to offset this cost. We expect associated headlines in 2013.

Cyclical Industrials – Consumers are Still Spending While Businesses are Being Affected by Deleveraging in Europe and Slowing Growth in Asia
Energy – International Oil Remains the Bright Spot While Uncertainty is an Overhang for the Services Sector

Oil prices have increased with the markets and the quantitative easing sentiment. Based on fundamentals and a slowing world economy, we project a twelve month price of $85 per barrel. We expect demand to increase by 500,000 barrels per day, supply to increase by 850,000 per day and the market to shift its focus on slower growth from China and declining demand from the U.S. and Europe. Supply is more of the unknown variable due to the political unrest in the Middle East and will keep oil prices higher than fundamentals support.

Similarly, natural gas prices remain low with the supply glut domestically. Strong productivity of 105 million cubic feet per day per rig is nearly 50% greater than 2011 and at the highest level in more than a decade. However, the natural gas rig count has declined by 46%, which will eventually impact supply. The potential for increased demand for natural gas in the next three years as coal burning electric plants are retired and replaced by natural gas burning electric plants should not be meaningful until 2014 at the earliest. Moreover, given the significant coal to natural gas switching that has already taken place in 2012, we believe the influence of coal closures will be less than previously expected. Our forecast remains $3 per MMBtu (million British thermal units) over the next twelve months.

As it relates to companies, those with international oil exposure are outperforming their domestically focused peers. Weak natural gas prices and escalating service costs in the first half of 2012 have resulted in a decline in North America spending plans. We are examining whether those reduced capital expenditure plans for North America will spill over to the international market, putting pressure on contract drillers.

Media – Advertising Growth Remains Solid, But Signs of a Weak Economy are Emerging

Away from commodities and moving on to advertising, growth estimates have been revised down for advertising especially in Europe (Exhibit 3). Europe’s growth was revised down from 2.3% to 0.8% by MagnaGlobal.  Most of the revision was due to sharp revisions in ad spending in Greece, Spain (12% lower), Portugal and Italy (5% lower).  Carat was the latest to make revisions, taking Europe from 1.5% to 0.2% and Asia from 8.7% to 6.8%. This will affect companies differently, depending on their geographic exposure.  As evidence, after affirming guidance on June 14, WPP recently revised its revenue projection for 2012 down from over 4% to 3.5% due slower growth in Southern Europe and North America. WPP’s Chairman has been very vocal regarding his concerns for the economy in 2013 and thus, advertising due to the political uncertainties. It is worthwhile to note that in the U.S., advertising is expected to be about flat with 2011 levels if one were to strip out political and Olympic advertising. Therefore, the expectations are certainly not high in terms of a base for growth in 2013.

Exhibit 3: Global Advertising Growth Projected for 2012
Research Unit New 2012 Projection Old 2012 Projection Date of Revision
Zenith Optimedia 4.3% 4.8% 6/18/2012
MagnaGlobal 4.8% 5.0% 6/18/2012
GroupM 5.1% 6.4% 6/19/2012
Carat 5.0% 6.0% 8/23/2012
   Average 4.8% 5.4%

Source: Bloomberg

Another sign of a weak economy was the increase in direct response advertising. Direct response advertising grew 8% year-over-year in the second quarter, the fastest growth since first quarter 2008. This type of advertising is emblematic of a weak economy because these advertisers are buying excess inventory on short-notice at a sizeable discount to standard rates. Apart from this, advertising was solid in the second quarter especially given the weakness in cable network ratings. Auto spending has contributed nicely this year, and should be maintained through the second half unless the consumer turns more cautious.

Retail – The Consumer is Still Spending

The two bright spots in the quarter were the resiliency of the consumer and the continued strengthening of the housing market. Back-to-school sale estimates were raised and overall retail results were better than expected, foreshadowing a strong holiday season. Retailers benefited from promotional activity and higher overall volume despite softer pricing, as consumers are still in the hunt for good deals. Even more positive was that the results were strong across the spectrum of retailers with both discount and luxury performing well. Inventories are in a comfortable position as retailers still remain somewhat defensive in this environment. In addition, retailers have improved they way they manage their inventory resulting in better turnarounds and more efficient demand feedback.

Rails – Growth is Tepid, But Pricing is Firm

The recovery in the housing market is benefitting not only the retailers but the Rails as well with volume increases in lumber and other building related products. Besides housing products, the Rails are taking advantage of the changing utility landscape, moving crude oil and other petroleum products and fracking materials across the U.S. That said, growth is slowing somewhat with rail car loadings about flat to 2011 levels over the last couple of months. Rails have benefited more from price, given the economic advantage they offer their customers over other modes of transport. Volume should generally follow the relative strength of the economy.

Utilities – Fundamentals Reflect Economic Conditions in the U.S.
Electric Utilities – Regulatory News was the Highlight

It was a quiet quarter fundamentally. Domestic electricity consumption was modest, much like economic growth. Utilities benefited from the hot summer as residents used more energy while being hurt from the slowing manufacturing sector, as commercial and industry energy consumption slowed.

The real news for the sector was regulatory related. In a 2-1 decision, the Court of Appeals for the D.C. Circuit vacated the United States Environmental Protection Agency’s Cross-State Air Pollution Rule (“CSAPR” or the “Transport Rule”), the EPA’s attempt to “fix” the Clean Air Interstate Rule to regulate downwind state air pollution under the Clean Air Act. The court found that the EPA exceeded its statutory authority, the so-called “good neighbor” provisions of the Clean Air Act, by potentially requiring an upwind state to reduce emissions in excess of its contribution to a downwind states exceedance of air quality standards. Additionally, the Court of Appeals for the D.C. Circuit struck the EPA’s decision to require that each state comply with a federal implementation plan to implement the emission reductions mandated by the Transport Rule rather than allowing each state to determine how best to achieve the reductions within the state[note]Jane E. Montgomery, Kathleen C. Bassi, and David M. Loring, “D.C. Circuit Vacates CSAPR, Instructs USEPA to Continue Administering CAIR,” Environmental Update, August 22, 2012, accessed September 4, 2012, https://www.schiffhardin.com/File%20Library/Publications%20(File%20Based)/HTML/env_aug22_12index2.html[/note].

Very importantly, utilities are still on the hook for meeting the Maximum Achievable Control Technology or MACT standard, which is scheduled to become effective in 2015. On May 3, 2011, the EPA proposed national emission standards for hazardous air pollutants from both new and existing coal electric generating units. The proposed rule would create national standards that require all coal electric generating units to achieve the maximum degree of reductions in emissions of hazardous air pollutants.

Pipelines – Fundamentals Remain Positive While Technical Risk May Increase Over the Intermediate Term

We believe the fundamentals for the pipeline segment are positive.  Volumes of oil, refined products, natural gas and natural gas shipments are largely determined by domestic GDP.  Our forecast for domestic GDP is 1%-2% for 2012, so we think volume growth should increase slightly.  Notably, volumes of natural gas liquids should probably increase faster than GDP growth given the heightened demand from the chemical sector.  We believe another positive fundamental is the expanding number of resource basins, which will lead to greater size and cash flow generating capability.  The Eagle Ford basin in South Texas, the Bakken Shale in North Dakota and the Utica Shale in Ohio will provide many domestic growth opportunities.  Offsetting these positive fundamental drivers is the levered business model, which relies on external funding to refinance maturing debt and in periods of capital market uncertainty, causes spreads to be more volatile. Moreover, as companies begin to exploit these relatively new resource basins, we expect capital spending and debt issuance to increase.

Written by:

Elizabeth Henderson, CFA
Director of Corporate Credit

Michael Ashley
Vice President

Sebastian Bacchus, CFA
Vice President

Bob Bennett, CFA
Vice President

Patrick McGeever
Vice President

Hugh McCaffrey, CFA
Vice President

Disclaimer: Asset Allocation & Management Company, LLC (AAM) is an investment adviser registered with the Securities and Exchange Commission, specializing in fixed-income asset management services for insurance companies. This information was developed using publicly available information, internally developed data and outside sources believed to be reliable. While all reasonable care has been taken to ensure that the facts stated and the opinions given are accurate, complete and reasonable, liability is expressly disclaimed by AAM and any affiliates (collectively known as “AAM”), and their representative officers and employees. This report has been prepared for informational purposes only and does not purport to represent a complete analysis of any security, company or industry discussed. Any opinions and/or recommendations expressed are subject to change without notice and should be considered only as part of a diversified portfolio. A complete list of investment recommendations made during the past year is available upon request. Past performance is not an indication of future returns.

This information is distributed to recipients including AAM, any of which may have acted on the basis of the information, or may have an ownership interest in securities to which the information relates. It may also be distributed to clients of AAM, as well as to other recipients with whom no such client relationship exists. Providing this information does not, in and of itself, constitute a recommendation by AAM, nor does it imply that the purchase or sale of any security is suitable for the recipient. Investing in the bond market is subject to certain risks including market, interest-rate, issuer, credit, inflation, liquidity, valuation, volatility, prepayment and extension. No part of this material may be reproduced in any form, or referred to in any other publication, without express written permission.


  • « Go to Previous Page
  • Page 1
  • Interim pages omitted …
  • Page 7
  • Page 8
  • Page 9
  • Page 10
  • Page 11
  • Interim pages omitted …
  • Page 17
  • Go to Next Page »

Get updates in your inbox.

  • Investment Strategies
    • Investment Grade Fixed Income
    • Specialty Asset Classes
  • Our Clients
    • Client Experience
    • Sample RFP Download
  • Insights
    • Video
    • Webinar
    • News
    • Podcasts
  • About
    • Our Team
    • Contact
    • Client Login

Disclaimer: Asset Allocation & Management Company, LLC (AAM) is an investment adviser registered with the Securities and Exchange Commission, specializing in fixed-income asset management services for insurance companies. Registration does not imply a certain level of skill or training. This information was developed using publicly available information, internally developed data and outside sources believed to be reliable. While all reasonable care has been taken to ensure that the facts stated and the opinions given are accurate, complete and reasonable, liability is expressly disclaimed by AAM and any affiliates (collectively known as “AAM”), and their representative officers and employees. This report has been prepared for informational purposes only and does not purport to represent a complete analysis of any security, company or industry discussed. Any opinions and/or recommendations expressed are subject to change without notice and should be considered only as part of a diversified portfolio. A complete list of investment recommendations made during the past year is available upon request. Past performance is not an indication of future returns. This information is distributed to recipients including AAM, any of which may have acted on the basis of the information, or may have an ownership interest in securities to which the information relates. It may also be distributed to clients of AAM, as well as to other recipients with whom no such client relationship exists. Providing this information does not, in and of itself, constitute a recommendation by AAM, nor does it imply that the purchase or sale of any security is suitable for the recipient. Investing in the bond market is subject to certain risks including market, interest-rate, issuer, credit, inflation, liquidity, valuation, volatility, prepayment and extension. No part of this material may be reproduced in any form, or referred to in any other publication, without express written permission. *All figures shown are approximate and subject to change from quarter to quarter. **The accolades and awards highlighted herein are not statements of any advisory client and do not describe any experience with or endorsement of AAM as an investment adviser by any such client.

Copyright © 2024 AAM | Privacy and Disclosures

  • LinkedIn
  • YouTube