• Skip to primary navigation
  • Skip to main content
  • Skip to footer
AAM CompanyTransparent Logo

AAM Company

AAM Company Website

  • Investment Strategies
    • Investment Grade Fixed Income
    • Specialty Asset Classes
  • Clients
    • Our Clients
    • Client Experience
    • Download Sample RFP
  • Insights
    • Video
    • Webinars
    • Podcasts
    • News
  • About
    • Our Team
    • Events
  • Login
  • Contact Us
Contact

Featured

August 11, 2021 by

Peter Wirtala, CFA | Insurance Strategist

ESG Q&A – Summer 2021

Interest in ESG investing has grown in 2021, and here at AAM we’ve received a growing number of inquiries on the topic. We’ve prepared this Q&A to give an overview of recent and prospective future developments in this space, and outline how AAM is supporting our clients’ ESG investment strategies.

What is ESG? How do I do it? Should I be doing it?

ESG (“Environmental, Social, Governance”) investing refers to investment strategies that combine a focus on these characteristics with traditional financial risk/reward analysis. ESG has its origins in the Socially Responsible Investing (“SRI”) trend of recent decades, which involved avoiding investments in “sin” industries like alcohol, tobacco, or weaponry, or in companies involved in prominent controversies around topics like pollution, corruption, or labor relations.

As a practical matter, ESG investing entails a mix of 1) applying different weightings to risk factors when analyzing an investment, 2) proactively excluding issuers with exposure to defined non-compliant sectors, and 3) divesting holdings involved in material controversies. The concept remains flexible, and significant variation may exist across different investors’ ESG evaluations of the same issuer; an excellent example of this is the carmaker Tesla, which is the largest holding in some ESG-focused ETFs due to its production of electric cars, but which some analysts have conversely rated as possessing elevated ESG risk due to its regulatory difficulties, safety issues, erratic leadership, supply chain labor and environmental issues, and other factors.

ESG investing can be further extended to incorporate a focus on investments in sectors perceived as affirming positive values, though this approach requires more complex and explicit definition of acceptable tradeoffs between financial risk and return and ESG factors. As alluded to above, it can also be complicated to define these “ESG-positive” sectors when logistical chains are fully accounted for; wind farms, for example, are often cited as a promising channel of low-emission energy production, but this sector is inextricably linked to the mining, shipping, and steelmaking industries, all of which are considered among the worst emissions offenders.

Insurers may incorporate ESG factors into their investment strategy for a variety of reasons. Some may reflect their corporate values by excluding certain sectors from their investments. Others may find an ESG focus helps distinguish their insurance products in the marketplace. And others may engage with the topic in anticipation of potential future regulatory requirements. Given the values-based nature of ESG investing, the question of whether and how to implement it is something that investors must ultimately determine for themselves, though AAM is available to offer guidance and practical help implementing an ESG strategy.

Is ESG a regulatory requirement?

As yet there are no regulatory requirements for US insurers to explicitly implement ESG considerations in their investment analysis, though this may change in coming years. The issue is complicated by the broad variety and subjectivity of ESG approaches, and the challenge of squaring fiduciary responsibility to manage risk and maximize returns with hard-to-quantify value judgments, but it is likely that at minimum we will see greater disclosure requirements in some jurisdictions, possibly including ESG-focused stress testing. Certain state insurance regulators (especially in NY and CA) have ongoing climate risk initiatives, which falls under the “E” category of ESG. These states have partnered with the 2 Degree Investing Initiative (2DII), an NGO sponsored by the EU and European governments, to designate certain corporate sectors as climate risks and explore how to implement climate-focused investment regulations in their respective jurisdictions. A roadmap issued by the NY Department of Financial Services highlighted several areas of prospective regulatory focus, including integration of climate risk considerations into governance and strategic planning, application of climate scenario analysis and stress testing to risk management, and implementation of climate risk disclosures in periodic reporting. It’s likely that a number of states will ultimately adopt such measures, though the question of whether or how the presence of investment holdings in designated climate risk industries might be penalized (for example, through higher RBC charges) remains uncertain.

The 2DII has also released a free online tool called the Paris Agreement Capital Transition Analysis (PACTA) that allows investors to upload corporate bond holdings and produce a report analyzing the level of climate risk present based on various assumptions about future emissions scenarios and infrastructure transitions. It currently only works with Q4 2019 data, but a more up-to-date stress testing tool is listed as “Coming Soon” on their website. NY and CA regulators have encouraged their domestic insurers to familiarize themselves with the output of the PACTA tool.

How does AM Best incorporate ESG?

AM Best has begun to incorporate ESG into their ratings process, as a sub-topic within existing ratings categories like Business Profile and Balance Sheet Strength. The ESG language in Best’s Credit Rating Methodology is primarily focused on underwriting activities, but the section most directly applicable to ESG investing is as follows:

“From a credit rating perspective, AM Best will discuss how ESG is integrated into investment policy, whether negative screening takes place, and the company’s commitment to green, sustainable, or ethical investing. AM Best will also seek to understand whether the investment strategy improves diversification, or increases concentration within the asset portfolio, and if this translates into improved earnings. […] An important point to make is that strong ESG integration does not necessarily translate into higher credit quality of an investment portfolio. For example, investments in untested technologies, start-ups, or taking insurance risks that cannot be reliably priced due to lack of information may carry increased credit risks.”

How can AAM help my organization implement an ESG investment strategy?

The decision to integrate ESG into an investment policy, and to what extent, is one each investor must make for themselves based on their values and objectives. AAM offers a variety of resources to advise our clients on the subject and implement ESG investment strategies. We have years of experience helping our clients to design and implement screens to exclude customized sets of issuers and sectors corresponding to the various ESG categories. Our investment research process actively incorporates ESG considerations, and internal research notes keep portfolio management teams informed about ESG factors applicable to the investments we evaluate day-to-day. We also partner with Sustainalytics, a leading 3rd-party provider of ESG analysis, to evaluate the level and type of ESG risks present in our portfolios and assist our clients in understanding and targeting this risk to a suitable level. In addition, we continue to monitor regulatory developments related to ESG and provide updates and guidance where needed, including assistance with running and interpreting the PACTA tool mentioned above.

Conclusion

ESG is likely to remain a hot topic for years to come, and whether seeking to incorporate value-based exclusions into a portfolio or simply remain fully compliant with an evolving regulatory landscape, insurers are well advised to increase their familiarity with the subject. AAM has many resources to help, and we would be delighted to explore the topic further with any insurers looking for guidance.

Further Reading

2 Degree Investing Initiative PACTA Tool:

https://2degrees-investing.org/resource/pacta/

NY Dept of Financial Services Climate Risk Initiative:

https://www.dfs.ny.gov/industry_guidance/climate_change

CA Dept of Insurance Climate Risk Carbon Initiative:

https://www.insurance.ca.gov/0250-insurers/0300-insurers/0100-applications/ci/index.cfm

AM Best ESG Updates

https://www.ambest.com/about/esg.html

NAIC Climate and Resiliency Task Force

https://content.naic.org/cmte_ex_climate_resiliency_tf.htm

Peter Wirtala, CFA is AAM’s Insurance Strategist with 15 years of investment experience. Peter’s responsibilities focus on analysis of client insurance operations and reserves to aid in the development of customized investment solutions. Additionally, he develops ERM-focused asset allocation strategies for clients, conducts peer analysis and NAIC RBC / AM Best BCAR scenario analysis, and prepares educational papers and seminars on key issues facing the insurance industry. Peter also leads AAM’s ESG integration effort for clients seeking to incorporate environmental, social, and governance-based principles into their portfolios. Previously he worked for Epic Systems as a Financial Accountant. Peter earned a BBA in Finance from the University of Wisconsin-Madison.


Disclaimer: Asset Allocation & Management Company, LLC (AAM) is an investment adviser registered with the Securities and Exchange Commission, specializing in fixed-income asset management services for insurance companies. Registration does not imply a certain level of skill or training. This information was developed using publicly available information, internally developed data and outside sources believed to be reliable. While all reasonable care has been taken to ensure that the facts stated and the opinions given are accurate, complete and reasonable, liability is expressly disclaimed by AAM and any affiliates (collectively known as “AAM”), and their representative officers and employees. This report has been prepared for informational purposes only and does not purport to represent a complete analysis of any security, company or industry discussed. Any opinions and/or recommendations expressed are subject to change without notice and should be considered only as part of a diversified portfolio. Any opinions and statements contained herein of financial market trends based on market conditions constitute our judgment. This material may contain projections or other forward-looking statements regarding future events, targets or expectations, and is only current as of the date indicated. There is no assurance that such events or targets will be achieved, and may be significantly different than that discussed here. The information presented, including any statements concerning financial market trends, is based on current market conditions, which will fluctuate and may be superseded by subsequent market events or for other reasons. Although the assumptions underlying the forward-looking statements  that may be contained herein are believed to be reasonable they can be affected by inaccurate assumptions or by known or unknown risks and uncertainties. AAM assumes no duty to provide updates to any analysis contained herein.  A complete list of investment recommendations made during the past year is available upon request. Past performance is not an indication of future returns. This information is distributed to recipients including AAM, any of which may have acted on the basis of the information, or may have an ownership interest in securities to which the information relates. It may also be distributed to clients of AAM, as well as to other recipients with whom no such client relationship exists. Providing this information does not, in and of itself, constitute a recommendation by AAM, nor does it imply that the purchase or sale of any security is suitable for the recipient. Investing in the bond market is subject to certain risks including market, interest-rate, issuer, credit, inflation, liquidity, valuation, volatility, prepayment and extension. No part of this material may be reproduced in any form, or referred to in any other publication, without express written permission.Disclaimer: Asset Allocation & Management Company, LLC (AAM) is an investment adviser registered with the Securities and Exchange Commission, specializing in fixed-income asset management services for insurance companies. Registration does not imply a certain level of skill or training. This information was developed using publicly available information, internally developed data and outside sources believed to be reliable. While all reasonable care has been taken to ensure that the facts stated and the opinions given are accurate, complete and reasonable, liability is expressly disclaimed by AAM and any affiliates (collectively known as “AAM”), and their representative officers and employees. This report has been prepared for informational purposes only and does not purport to represent a complete analysis of any security, company or industry discussed. Any opinions and/or recommendations expressed are subject to change without notice and should be considered only as part of a diversified portfolio. This information is distributed to recipients including AAM, any of which may have acted on the basis of the information, or may have an ownership interest in securities to which the information relates. It may also be distributed to clients of AAM, as well as to other recipients with whom no such client relationship exists. Providing this information does not, in and of itself, constitute a recommendation by AAM, nor does it imply that the purchase or sale of any security is suitable for the recipient. Investing in the bond market is subject to certain risks including market, interest-rate, issuer, credit, inflation, liquidity, valuation, volatility, prepayment and extension. No part of this material may be reproduced in any form, or referred to in any other publication, without express written permission. 

The views and opinions expressed should not be construed as an offer to buy or sell or invitation to engage in any investment activity, they are for information purposes only. Opinions and statements of financial market trends that are based on market conditions constitute our judgment and are subject to change without notice. Historic market trends are not reliable indicators of actual future market behavior. Past performance is not an indication of future performance. This discussion material contains forward-looking statements, which give current expectations of future activities and future performance. Any or all forward-looking statements in this material may turn out to be incorrect. They can be affected by inaccurate assumptions or by known or unknown risks and uncertainties. Although the assumptions underlying the forward-looking statements contained herein are believed to be reasonable, any of the assumptions could be inaccurate and, therefore, there can be no assurances that the forward-looking statements included in this discussion material will prove to be accurate. In light of the significant uncertainties inherent in the forward-looking statements included herein, the inclusion of such information should not be regarded as a representation that the objectives and plans discussed herein will be achieved. Further, no person undertakes any obligation to revise such forward-looking statements to reflect events or circumstances after the date hereof or to reflect the occurrence of unanticipated events. Reproduction or use of these materials for any other purpose or by or for any individuals is strictly prohibited. The information contained in this presentation has been obtained from sources that AAM believes to be reliable, but AAM does not represent or warrant that it is accurate or complete. This document is for informational purposes only and does not constitute an offer or solicitation of an offer, or any advice or recommendation, to purchase any securities or other financial instruments, and may not be construed as such.
May 17, 2021 by

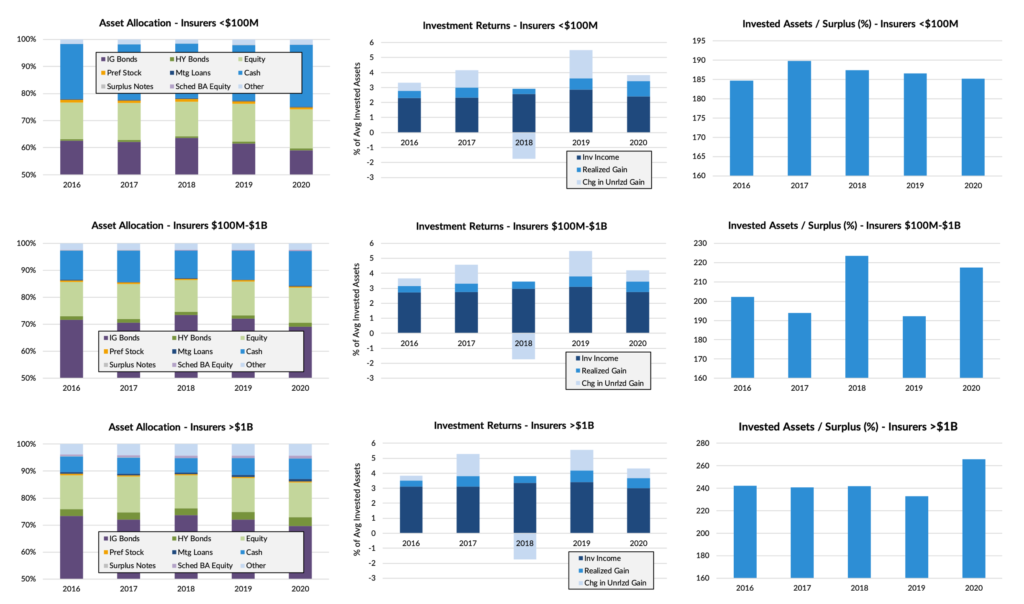
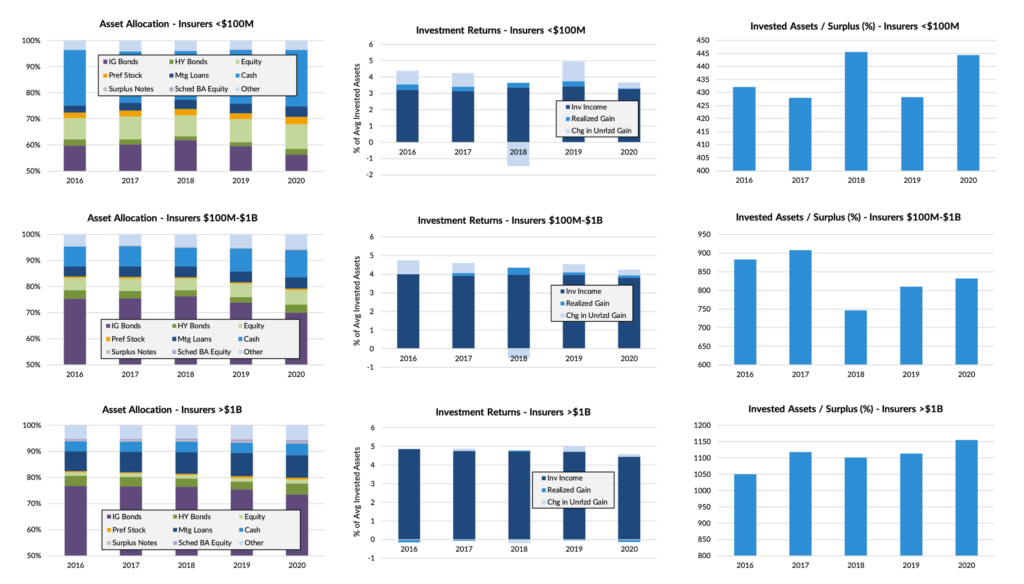
2020 was a lively year for investors, and insurers were no exception. It saw dramatic down-and-up volatility in equity markets and other risk assets, the return of ultra-low rates (including lows never before seen at the long end of the yield curve), and a head-spinning round trip in credit spreads. In this paper we summarize data we’ve collected on investment holdings and returns for the P&C and Life insurance industries including both 2020 and the prior 4 years. To add additional perspective we’ve broken each industry out into companies with total invested assets <$100 million, companies with assets from $100M – $1 billion, and companies >$1 billion, since company size is a significant factor driving how insurers invest. We’ve included only companies with at least 3 years of operating history as of 12/31/20, as startup insurers may have temporarily conservative investment allocations that aren’t representative of their longer-term investment targets. We summarize key observations and conclusions below, and follow with graphs detailing the data we reviewed.

P&C Industry

A few generalizations can be made about P&C insurance investors based on the data we observed:

  • P&C insurers invest primarily in IG bonds and equity, with small allocations to other assets. The larger P&C insurers get, the less cash and equity they tend to hold, and the more other assets (IG bonds, HY bonds, mortgage loans, Schedule BA assets) they allocate to. For reference, the asset marked as “Other” on the graphs primarily consists of Real Estate, much of which is not held for investment purposes.
  • Across all P&C insurers, IG bond holdings have modestly decreased in the past several years, with the largest share of the balance going into cash (especially in 2020). To the extent there’s been an increase in risky assets since 2016, it is very modest.
  • Larger insurers tend to have higher balance sheet leverage than smaller ones. Average leverage has fluctuated from year to year but without a clear trend.
  • Most Schedule BA assets held by P&C insurers are classed as having equity characteristics, likely constituting a mix of private equity, venture capital, and hedge fund holdings. Relatively few insurers with <$1 billion in assets allocate to Schedule BA assets, in part due to the complexity and high minimum investment sizes of these assets.
  • After enjoying a rise in investment income in 2018 and 2019 as rates gradually rose, insurers saw their portfolio yields drop notably in 2020 as the yield curve plummeted. Prospects for near-term improvement on this front appear dim.
  • Year-to-year trends in realized gains and mark-to-market surplus gains are primarily driven by annual equity market performance, which has been positive in all recent years except 2018.

Life Industry

Life companies have significant differences in how they invest based on the data we observed:

  • Life companies also hold core allocations to IG bonds, with additional holdings in cash, equity, HY bonds, and mortgage loans. Once again, Schedule BA holdings are mostly concentrated among the largest insurers.
  • As with P&C companies, larger Life insurers tend to hold significantly less cash and a broader mix of assets. For the largest insurers, mortgage loans represent the 2nd largest category of holdings, whereas equity holds this position for small- and medium-sized companies. Smaller companies also tend to hold more preferred stock than larger ones, perhaps due to the small size of the sector and the challenges larger insurers face in building diversified allocations.
  • As with P&C companies, allocations to IG bonds have declined since 2016, though significant variability exists among which other sectors have benefited. For small and medium companies cash received the largest share (especially in 2020), but for the largest insurers mortgage loans were the largest beneficiary.
  • Large Life companies earn significantly higher investment yields, and receive less returns in the form of realized or mark-to-market gains. Yields for all insurers declined significantly in 2020.
  • There is a strong positive correlation between Life insurer size and balance sheet leverage.

Conclusions

The question of “are insurers increasing allocations to risk assets to offset low bond yields?” has been perennial in the recent years. Articles on this question often answer in the affirmative, though there’s little sign in the data of any broad movement towards increased risk exposure since 2016 (admittedly this period included a phase of improving bond yields). We believe a more accurate conclusion would be that insurer asset allocations are impressively stable from year to year, and it’s likely that small year-to-year fluctuations in e.g. equity exposure are mainly driven by organic changes in market value rather than strategic reallocations. The largest asset shift in recent years across all industries seemed to be the growth of cash in 2020, likely due to the challenging investment environment that prevailed at year-end of richly valued equities and record-low bond yields.

Overall, we believe  this suggests a commendable degree of investment discipline among insurers, reflecting neither aggressive overreach to offset declining bond yields, nor conservative de-risking in response to years of unprecedentedly rapid gains in risky assets. Ultimately regardless of size or business lines, we believe all insurers would be well advised to identify strategic asset allocations tied to their return objectives and tolerance for surplus volatility, and stay the course during periods of volatility rather than chasing strong returns after the fact, or selling at the bottom of a decline.

Note: All data sourced from S&P Global Market Intelligence, as of 12/31/20. P&C data based on 801 companies with minimum 3yrs operating history and invested assets >$10 million. Life data based on 283 insurers with minimum 3yrs operating history and invested assets >$10 million. Observations and conclusions are that of AAM and are subject to change should market conditions warrant. Please see attached data which is an integral part of the paper.

Appendix

Property and Casualty

Source: S&P Global Market Intelligence. Data as of 12/31/20

Life

Source: S&P Global Market Intelligence. Data as of 12/31/20

March 18, 2021 by

Overview

While ESG has been a prominent investment theme for years, the environmental component has recently exhibited significant momentum. In particular, decarbonization has become a goal that has impacted practically every corner of the investment universe. Increasingly, as part of this movement, many countries and companies have explicitly stated a variety of carbon reduction goals with the intent of reaching net-zero carbon anywhere between 2035-2050. While the practicality of these efforts can be debated, there is no denying that the effort is underway. 

Ironically, the goal of reaching carbon neutrality hinges on a sector that has historically been shunned by ESG investors – utilities. Eventually, many industries will play a role in reducing carbon emissions, but most of them will rely on green electricity to be truly carbon free. For example, the auto industry is increasingly focused on producing electric vehicles (EV). If the electricity used to power EVs is generated from fossil fuels such as coal, then carbon emissions have not been effectively addressed. The recent attention given to the promise of hydrogen is another example. Hydrogen has enormous potential to help reach decarbonization goals, but the production of hydrogen uses a considerable amount of electricity. To be truly carbon free, this electricity will need to be from green or renewable sources. Ultimately, the ability to achieve carbon reduction goals depends on the ability to generate clean electricity. Then downstream users in energy intensive industries such as steel, transportation, mining, and commercial construction, will continue to innovate in order to capitalize on green sources of energy. The good news is that the utility industry is well down the road in addressing carbon emissions. Initially, the industry was slow to embrace the clean energy movement – even actively resisting external pressures to change. Now, however, practically every utility company has realized the necessity of investing in clean energy, and it is a major focus across the industry. 

Evolution of the Generation Mix

As the following chart shows, the electric utility industry has invested heavily into the transition away from coal over the past decade. Over this time, coal’s contribution to electrical generation production in the United States dropped from roughly 45% to around 19%. Initially, this transition was primarily due to increasing generation from natural gas. The primary driver behind this transition was not environmental concerns but rather the economic benefit from using the cheaper natural gas that was being unleashed by the shale revolution. While natural gas is effective at reducing carbon emissions, it still falls short in reaching the goal of zero-carbon emissions. In fact, more and more people are asking the question, “Is natural gas the new coal?”

Exhibit 1: Utility Scale Generation by Fuel Type

Source: U.S. Energy Information Administration

The next biggest factor in the displacement of coal is the more recent proliferation of renewable energy generation. This has been led primarily by wind with additional contributions from solar. While wind still only accounts for approximately 8.4% of total generation, this is up from 1.9% a little over a decade ago. Solar has been slower to catch on and still only accounts for around 2.3% of utility scale generation. When including an estimate of small-scale (i.e. residential) generation, solar accounts for an estimated 3.3% of the total. 

Two other sources of generation that play a role in decarbonization are nuclear and hydro. Notably, despite the growth of wind and solar, nuclear is still the largest source of carbon-free electricity. While both nuclear and hydro are considered zero-carbon emitters, they come with other environmental concerns. Nuclear also has the added drawback of being at a cost disadvantage relative to other sources. Both sources of generation have been relatively stable over the past decade, with nuclear accounting for roughly 20% and hydro accounting for roughly 7% of total utility generation.

Relative Cost of Renewables

The biggest factor in the acceleration of renewables growth has been the rapidly declining costs of building new generation facilities. The cost of building a new facility is often stated as the levelized cost of electricity (LCOE). LCOE reflects the revenue per unit of electricity generated that would be necessary to recover the building and operating costs of a generator for a specific life cycle. The LCOE calculation includes several assumptions, such as capital costs, financing costs, fuel costs, utilization rate and fixed and variable operations and maintenance (O&M) costs. When consistently applied, however, it allows for the useful comparison across different generating technologies. 

The LCOE for renewables has declined dramatically over the past decade. While this has been aided by tax credits, renewables have increasingly become cost competitive on an unsubsidized basis. Since 2009, the unsubsidized LCOE of solar has declined 90% and the unsubsidized LCOE of wind has declined 71%, according to a study by Lazard Ltd. The primary contributor to this decline has been the significant decline in prices for photovoltaic (PV) cells and wind turbines. In addition, the LCOE for wind and solar also benefits from substantial O&M and fuel savings relative to coal, nuclear, and open/closed cycle gas turbines (OCGT and CCGT). Essentially, wind and solar generation has nearly zero marginal costs. The following chart shows the LCOE of various types of generation, clearly illustrating the attractiveness of investing in renewable generation projects.

Exhibit 2: Levelized Cost of Electricity

Source: BloombergNEF as of 12/10/2020

Not only has the LCOE of wind and solar fallen to levels substantially below that of older technologies, in many cases, new renewable projects are becoming cheaper than the marginal operating costs of many existing plants. This has been verified by anecdotal reports from companies, who find it increasingly attractive to invest in renewable projects while shutting down higher cost plants, particularly coal and nuclear. According to the EIA, since 2013, 8.4GW of nuclear generation has been retired early and another 5.1GW is scheduled to retire in 2021. The bulk (4.1GW) of the 2021 retirements will come when Exelon retires the Dresden and Byron plants in Illinois. In just 2020 alone, 9.2GW of coal plants have been retired. At the same time, 14.2GW of wind capacity, 10.1GW of solar capacity, and a net 4.5GW of natural gas generation came online.

Role of Tax Incentives

According to EIA estimates, 2020 was a record year for wind turbine installations. The total of 14.2GW surpassed the previous record of 13.2GW set in 2012. Both years benefitted from a year-end push to qualify for tax credits that were scheduled to decline or expire at the end of the year. As part of the spending bill that was passed just before the end of 2020, the tax credits were extended and enhanced. For solar projects, the investment tax credit (ITC) of 26% is extended for projects that begin construction prior to December 31, 2022 and is phased out for projects that start in subsequent years. For wind projects (and other qualifying facilities such as geothermal and biomass), the production tax credit of 60% was extended for projects that begin construction before December 31, 2021. In addition, a new ITC of 30% was created for offshore wind projects that begin construction by December 31, 2025. The extension of tax credits, along with increasing acceptance by regulators to include renewables investment in the rate base, will help the utility industry to continue making significant investments in wind and solar for the next few years. These tax incentives undoubtably make investment in renewables more attractive, but they are increasingly unnecessary; many onshore wind and solar projects have now become the cheapest source of generation in certain locations, and the returns are now often attractive on an unsubsidized basis. While utilities certainly welcome the recently passed extensions, much of the industry’s plans would have been pursued anyway.

While the year-end spending package included an extension of the tax credits and a few other incentives, it was not the comprehensive legislation that many decarbonization proponents are looking for. Things to look for in future legislation include carbon pricing/regulation and additional incentives for developing technologies such as battery storage, electric vehicles, and hydrogen infrastructure. Much of this agenda is addressed in the recently re-introduced Growing Renewable Energy and Efficiency Now (GREEN) act. The nuclear industry is particularly interested in any carbon pricing or regulation as it would likely improve the relative economics of carbon-free nuclear generation. President Biden’s recent executive orders address many of these topics, and it remains to be seen how the legislative process will play out.

Current Limitations Facing Renewables

When analyzing the LCOE of renewable technologies, the wide range of electricity prices needed to produce an acceptable return for renewables projects is especially significant. As previously mentioned, there are many factors that affect the ultimate return for an investment in renewables. A major factor (if not the major factor) is the geographic location of the project. As the following wind and solar maps from National Renewable Energy Laboratory (NREL) show, the Midwest and Southwest are renewable resource rich while the Northeast and Northwest are noticeably resource poor. While the cost of renewable energy is decreasing everywhere, the utilities with footprints in the renewable resource rich areas have the highest potential benefit from replacing coal and natural gas generation with renewables. 

Exhibit 3

Source: National Renewable Energy Laboratory (NREL). Wind resource estimates developed by AWS Truepower, LLC for windNavigator. Web: https://www.windnavigator.com, https://www.awstruepower.com. Spatial resolution of wind resource data: 2.5 km. Projection: Albers Equal Area WGS84.

While it may be debatable whether tax credits for onshore wind and solar are still necessary, the extension and improved terms of the tax credits were, however, necessary for offshore wind projects. According to American Clean Power Association, there are 14 offshore wind projects totaling 9.1GW expected to be operational by 2026. These projects have been challenged with permitting delays, and none of them were able to start construction before the previous ITC expiration of December 31, 2020. Unfortunately, offshore wind is still a few years behind onshore wind and solar on the cost curve. That said, offshore wind holds significant potential benefits for otherwise resource poor areas such as the Northeast. 

What’s Next?

While wind and solar have a clearly established role in decarbonization, other technologies must continue to develop in order to reach the zero-carbon goal. The primary drawbacks of wind and solar are the geographic limitations and the related intermittent availability of their output. As the NREL maps show, wind speed and solar intensity vary significantly across the United States. Fortunately, solar availability at least follows the daily and seasonal power demand cycle. Still, neither can be relied on to provide consistent and predictable availability. The utility industry is pursuing additional technologies to address this limitation, primarily focused on storage and hydrogen.

Adding battery storage to the existing grid is the most immediate way of addressing intermittent availability of wind and solar generation. Currently, the cost of adding utility scale battery storage is still uneconomical, but the cost is coming down rapidly. There are several companies integrating storage solutions into their operations, and growth is expected to accelerate as the cost comes down. Battery storage is bidirectional, meaning it can both distribute and absorb electricity, effectively making the switch within seconds. This attractive characteristic is particularly useful in meeting the increased demand during evening hours after the sun goes down. The drawback is that battery storage is finite, and it would require an enormous amount of storage capacity to keep the grid stable for an extended period. 

Another potential longer-term solution to the intermittent availability problem is hydrogen. While the benefits of hydrogen have been known for decades, the attention given to it seems to have exploded over the past year. The development of a hydrogen infrastructure is in the very early stages, so it will likely be well into the future before we find out if this attention is warranted. Hydrogen development has wide ranging impacts on a variety of industries. For the utility industry, it holds the potential to replace coal and natural gas as dependable baseload generation. This would be accomplished by using excess green electricity to create hydrogen during off-peak hours and then using hydrogen to power a generator when renewables are unable to meet demand. Essentially, hydrogen could become a more effective long duration energy storage option.

Investment Implications

As the recent power outages in Texas highlighted, there is a strong need for investment across all areas of our electrical infrastructure. This is even more necessary as the electrification of our economy puts increasing demands on the grid. At times, the electric utility industry may find it difficult to balance the transition to green energy, the need to enhance reliability, and the pressure to keep customer bills low. Over the next few years, this environment will present both a significant challenge and an attractive opportunity for the industry. The funding needs will be substantial as companies look to grow their rate bases through investments in grid modernization and green electricity generation. While growing the rate base is a long-term net positive for the sector, the timing of investment recovery will continue to put upward pressure on debt levels in the near term. Although investors and rating agencies will likely continue to look through this period of high investment, this is a trend to be mindful of for the next year or two. 

Historically, as a major source of carbon emissions, the utility sector has not screened well through the ESG lens. Not every company jumped on board initially, with some resisting the movement altogether. But in a distinct age of ESG prominence, most companies – if not all – have accepted that this is not a fleeting movement, going so far as to explicitly state decarbonization goals themselves. Many utility companies are still high emitters, but ESG investors are increasingly willing to look past the current absolute level of emissions and reward companies with clearly articulated plans to reduce emissions over time. 

February 2, 2021 by

Economic Outlook – Marco Bravo, CFA | Senior Portfolio Manager

Market Outlook – Reed Nuttall, CFA | Chief Investment Officer

Corporate Credit – Elizabeth Henderson, CFA | Director of Corporate Credit

Structured Products – Scott Edwards, CFA | Director of Structured Products

Municipal Market – Gregory Bell, CFA, CPA | Director of Municipal Bonds

High Yield – Scott Skowronski, CFA | Senior Portfolio Manager

Convertibles – Tim Senechalle, CFA | Senior Portfolio Manager

Economic Outlook

With 2020 now in the rearview mirror, we look forward to a resurgence in economic growth for 2021. After falling an estimated 2.5% on a Q4/Q4 basis in 2020, U.S. real GDP is projected to increase by 3.8% in 2021 (Bloomberg survey consensus estimates). As shown on exhibit 1, consumer spending and private investment are expected to lead the way this year. Consumers are starting the year with a large degree of savings, improving employment prospects, and the potential for additional COVID-related aid out of Washington, all of which will be supportive for consumer spending. On the private investment side, low mortgage rates should continue to support a strong housing market, and a rebound in corporate earnings should lead to increased investment. Downside risks are largely centered around COVID and a slower than anticipated rollout of vaccines. At AAM, we view the risks to GDP growth as skewed to the upside for 2021 and expect the U.S. economy to outperform consensus estimates.

Exhibit 1: Contribution to GDP Growth

Source: Bureaus of Economic Analysis, Bloomberg. Data excludes residual component

Market implied inflation expectations have moved higher recently, likely the result of the potential for increased fiscal stimulus from the Biden administration, as well as weakness in the US dollar. Since the end of Q3 2020, the 10yr breakeven TIPs rate has increased by 46 basis points to a current rate of 2.09% (US Treasury, Bloomberg). Given excess global supply and slack in the economies, we don’t expect actual inflation to move above 2% this year. 

The Federal Reserve last year introduced its new Flexible Average Inflation Target (FAIT) framework for monetary policy. Under this new framework, the Federal Reserve will be more focused on achieving full employment versus price stability. We believe this means that the Fed will no longer preemptively raise rates in order to stave off inflation. In fact, the Fed has made it clear that they will tolerate inflation moving above their 2% target for a period of time. With inflation expected to remain relatively benign, and the unemployment rate projected to remain above 5% this year, we expect monetary policy to remain accommodative. We think the earliest that the Fed will begin tapering their purchases of Treasury and MBS securities is 2022, and expect no change in the Fed Funds rate at least through the next two years.

Treasury yields, according to consensus forecasts, are expected to move modestly higher from current levels with a steeper yield curve. With Fed policy on hold, it’s expected for short-term Treasury rates to remain anchored to the Fed Funds rate. The benchmark 10-year Treasury yield is forecasted to end 2021 at 1.3% based on the median forecast among economists surveyed by Bloomberg. Increased federal spending and rising inflation expectations present upside risks to forecast. These risks can be offset by the continued low level of sovereign bond yields in Europe and Japan. Any significant widening in the yield differential between U.S. and non-U.S. sovereign debt will likely attract demand from foreign investors, limiting the rise in U.S. rates. Perceived weakness in the US dollar does have the potential to hamper demand from foreign investors. We are calling for the 10-year Treasury yield to end the year in a range of 1.25% to 1.5%.

Market Outlook

Exhibit 2: Asset Class Returns

2020

As we began 2020, markets had performed well in the previous year, spreads were tight and valuations stretched. But, the Federal Reserve had cut rates to accommodative levels, and it looked like it would be an okay year for risk assets. Our 2020 recommendation was that with limited upside left in the market, the focus should be on moving up in quality across our portfolios.

As the number of known Covid-19 cases began to rise in late February, investors began to panic and across the country companies were putting together work from home plans for all employees. By mid-March, our office buildings were empty, and most sadly the death toll began to rise so quickly that in a panic we effectively locked down the entire country. Highways and grocery store shelves were empty (How could the store be out of toilet paper?), restaurants closed, and the capital markets were in free fall. On March 16, the Federal Reserve cut the Funds rate to zero and promised to do whatever it takes to keep liquidity in the system. On March 23, Congress passed a $2 trillion aid package, known as the CARES Act. These efforts were designed to keep businesses open and provide individuals with enough money to weather the storm of rising unemployment and shuttered businesses.

These efforts gave confidence to the markets. Accordingly, the low in the stock market occurred on March 23rd and quickly rose to finish the year up 18% (Bloomberg). We had unanswered questions about when these lockdowns could end, but it was clear that keeping the economy going was a clear priority. 

The government was also working to address the health crisis at hand. It partnered with a number of pharmaceutical companies to prefund vaccine purchases and help cover the cost of research and manufacturing dubbed “Operation Warp Speed.” By mid-November, announcements were made about the success of the vaccines and the markets were off to the races, reaching record highs.

2021

Just like last year, we begin this year with a very accommodative Fed, strong markets and tight credit spreads. There is uncertainty related to when we might get back to work and how many office buildings or stores or hotels we’ll need after this is all over. The markets seem to be once again reflecting the best-case scenario with little upside from spread tightening and some downside should the vaccine rollout be less than smooth. We’ll repeat our mantra from last year. Although we have a benign credit outlook, with spreads at these tight levels we believe there is limited upside in taking an aggressive position by adding the riskiest of credits. We still see some pockets of value within the corporate market and believe the positive technicals will provide a backstop to volatility.

The continued buying by the Fed in Agency MBS has created a dislocation in that sector. Our models suggest that on an option adjusted basis, this sector’s expected return is below Treasuries. We have reduced our exposure and plan to continue to underweight this sector.

Our fixed income portfolios are built to maximize income while reducing downside risk. We consistently overweight spread sectors but we strive to be flexible in our allocations. We use long Treasuries and Taxable municipals to reduce price volatility. We have seen that since 2014 the benchmark Corporate bond sector has underperformed duration matched Treasuries three of the last seven years while agency MBS four of seven and CMBS two of seven (Bloomberg Barclays). On the other hand, the ABS sector has outperformed Treasuries every year during this period (Bloomberg Barclays). 

We use short high quality ABS to add stability and positive convexity versus Treasury and Agency MBS positions. We have reduced volatility by adding longer Taxable munis and Treasuries to our portfolios and limit call risk by underweighting the MBS sector. The ability to be nimble in corporates and construct yield enhanced portfolios with the use of taxable municipals and ABS has enabled the AAM managed portfolios to be consistent top quartile performers.

Since we expect a stable economy and strong technical factors, this should be a good year for the equity markets. However, after the significant run-up in valuations, we are working with our clients to ensure that portfolios have been rebalanced in accordance with strategic targets. 

Corporate Credit

2020 was the quintessential roller coaster year for investment grade (IG) corporate bond spreads. The Corporate market OAS using the Bloomberg Barclays Corporate Index ended the year at the virtually the same level it started after widening over 300 bps in March. 

Exhibit 3: Corporate OAS

Source: Bloomberg Barclays Index, AAM as of 12/31/2020 (OAS=Option Adjusted Spread; Std dev = standard deviation)

As companies faced a high level of uncertainty in the spring, they issued a record amount of debt to raise cash. This additional debt coupled with EBITDA pressure resulted in debt leverage spiking, and close to 30 issuers or 3% of the Corporate Index experienced rating downgrades to high yield (Barclays Corporate Index). After a year of fundamental weakness due to the virus and related lockdowns, AAM expects credit fundamentals to rebound solidly in 2021 alongside the global economy. We expect debt leverage to improve due to falling debt levels and EBITDA growth (10-15% expected). Consequently, rating actions are expected to be more favorable this year as companies execute on deleveraging plans. Capital spending growth is expected to resume to an aggregate level that is essentially unchanged versus 2019 (“pre-COVID”). Fiscal stimulus and low interest rates are expected to fuel the economic recovery expected in 2021, as herd immunity is reached, placing us in the “recovery” phase of the cycle. Companies will have engines for growth other than financial engineering in 2021, which should be constructive for the IG market. 

In addition to a favorable fundamental outlook, we expect market technicals to support spreads, with gross and net debt issuance expected to be lower in 2021 vs. years past. The liquidity in the market, low yields outside the U.S. and expectation for rates to remain low in the U.S. are supportive for IG Corporate bond demand.

Exhibit 4: Composition of Gross Investment Grade Debt Supply

Source: AAM, Morgan Stanley, Dealogic, Bloomberg

Unfortunately, spreads are very tight, and while our OAS target for year-end is 95bps, our Bull case is for the OAS to move to the 10-year minimum level of 85 reached in 2018, which we deem more likely than a Bear case in which it widens to 140 (10-year average). We expect spread curves to flatten and the premium in spread for BBB rated issuers to compress further versus higher rated issuers. Risks to our forecast includes: (1) issuers’ unwillingness to reduce debt, using liquidity for more shareholder friendly activity, (2) pace of vaccination rollout materially underwhelms expectations (3) Fed changes its accommodative stance and (4) the Biden Administration’s policy objectives threaten near term growth expectations. 

2021 is likely a year in which performance is driven by how much risk is in the portfolio versus being driven by idiosyncratic risk. That said, when the cycle moves into its next phase, it will be important to have protected the portfolio from issuers with negative fundamental outlooks because that risk will start to materialize. To help with that process, the following was compiled by our experienced analyst team, recognizing that opportunities exist in all sectors and strong credit research is an important part of that process.

Exhibit 5

Structured Products

Structured products experienced mixed returns in 2020 as both CMBS and ABS outperformed their Treasury benchmarks by 51bp and 106bp respectively while agency RMBS underperformed Treasuries by 17bp (Bloomberg index returns). We’d consider that performance pretty pedestrian based upon historical averages however when accounting for the sharp downturn in risk assets earlier in the year due to the growing pandemic, we believe the overall performance was actually quite good. Looking to 2021, we start the year with spreads that are at or below levels where we began 2020 and quite low on a historical basis as well. This certainly limits the extent to which structured products can outperform Treasuries this year. Despite these tight levels however, we do expect some incremental spread compression in both ABS and CMBS generating reasonable excess returns but once again expect agency RMBS excess returns to disappoint.

It was quite a roller coaster ride for agency RMBS in 2020. We began the year expecting a flood of mortgage issuance as the Federal Reserve unwound their latest quantitative easing program only to have to reverse course and expand their balance sheet once again. Initial expectations were for the Fed to shrink their RMBS holdings by $220B in 2020 but instead they were increased by over $850B (BankAmerica for the 850B, JPM), a multiple of the net new issuance for the market for the entire year. This steady and consistent buying drove down mortgage rates, causing homeowners to rush to prepay their loans, eroding the entire incremental yield of the RMBS securities over and above Treasuries. Although rates have risen a bit in January, roughly 60-70% of all outstanding mortgage loans carry interest rates that are higher than current borrowing rates (Case Shiller, BofA, Citi, JPM). We expect prepayments to remain elevated over the course of 2021, reducing expected return for RMBS securities below that of Treasuries. 

Non-Agency RMBS looks much more compelling to us as we believe the higher yields offered by non-government guaranteed securities more than offsets the risk of higher prepayments afflicting agency guaranteed securities. Credit risk seems quite manageable as one surprising consequence of the pandemic has been an increase in demand for larger suburban housing, the type backing many non-agency securitizations. Homeowners looking to escape urban settings and the need to create home office space have driven the demand for housing well above supply in many parts of the country. Home prices nationwide rose by nearly 6% in 2020 and are expected to increase another 3-4% in 2021 (JPM, BofA). Continued fiscal support from Congress in the form of additional stimulus payments, supplemental unemployment insurance and a recovering employment market along with home price appreciation should contribute to solid credit fundamentals for non-agency securitizations over the coming year.

There remain many questions concerning the long-term impact of the coronavirus on commercial property markets. In particular the acceleration of online shopping replacing brick and mortar retail outlets and the need for expensive downtown office properties as employers embrace more work from home strategies. The pressure brought by these fundamental changes to key parts of the commercial property market are going to place significant downward pressure on valuations and operating metrics for marginal B and C properties in a wide variety of subsectors. Well placed, Class A properties, we believe will continue to thrive however. The old adage about location, location, location holds today more so than ever. We believe that by carefully stress testing properties underlying securitizations, we can identify those securities that will exhibit the best overall credit performance. We believe Senior, Aaa rated bonds remain the best value as high levels of credit enhancement should provide ample protection against the volatility in credit fundamentals we expect in the coming year. While we expect spreads to compress to Treasuries, it will be somewhat dependent on the performance of single A corporate bonds. CMBS tracks corporate bonds spreads closely and without a similar tightening in corporate spreads, CMBS will likely have difficulty following through on their own. 

Exhibit 6: CPPI Growth is Decelerating

Source: Real Capital Analytics, Bloomberg

ABS have always been one of the most consistent performers within the structured products universe. They provide high credit quality and stable cash flows making them a staple in our portfolios for shorter maturity needs in lieu of Treasuries. While we expect ABS to outperform other asset classes at the short end of the yield curve, valuations are strained for the larger, more generic sectors of the market. Spreads to Treasuries are as low as 10-15bp for large auto and credit card issuers making them fairly unappealing compared to Agency CMBS and Taxable Municipals. The demand for very short-term assets based on market expectations for higher yields and a steeper yield curve have driven short term spreads to extremely low levels. We do see value in more esoteric sectors, such as railcar, container and equipment securitizations, where spreads north of 100bp have the ability to generate returns well in excess of Treasuries particularly those yielding only 15-20bp.

Municipal Market

After a tumultuous year in which the pandemic-induced recession generated record low interest rates, massive volatility in relative valuations for the taxable and tax-exempt municipal sectors and a record surge in municipal new issue supply, our outlook for the municipal sector in 2021 is very similar to our outlook going into 2020. For tax-exempt municipals, we are maintaining a negative bias for the sector based in large part on the very expensive relative valuation profile of the sector versus taxable alternatives. Based on data from Thomson Municipal Market Data, ‘AAA’ rated municipal nominal yield levels as a percentage of Treasury yields during January fell to a 29-year low of 68%. 

The overvalued condition for tax-exempts has primarily been driven by positive technical and credit factors over the last few months. From a technical perspective, tax-exempt new issue supply during the year has largely been manageable. In a year in which the Bond Buyer reported overall municipal supply reached a new record of $474 billion, 2020 tax-exempt supply actually saw a decline of 4% from 2019 levels to $319 billion. The demand profile, however, has been building in momentum since the implementation of fiscal stimulus that helped the sector weather the largest liquidity and economic concerns related to the pandemic. Although questions remain as to the extent that state and local governments will see additional stimulus, the general election and senate run-off races that produced Democratic control across both houses of congress and the White House has provided a more constructive view of municipal credit. The Biden/Harris administration has already targeted $350 billion in direct aid to state and local governments within a new $1.9 trillion stimulus package. If the measure passes, this aid should help address revenue shortfalls at the state level that Standard and Poor’s estimates will reach a cumulative total of $467 billion over the fiscal years 2020 to 2022. The potential for these positive credit developments, combined with the very favorable year-end reinvestment flows of coupons/calls/maturities, has produced one of the most relatively expensive environments for the tax-exempt market on record. Consequently, we are maintaining a negative bias for the sector and advocating a significant underweight position. 

The taxable municipal market has also exhibited a similar build in performance momentum over the last few months. The same themes outlined in the tax-exempt space from a credit perspective benefitted the taxable sector; however, one area of significant difference is in the new issue supply performance. The Bond Buyer reported record taxable muni issuance of $185 billion, which incorporated $145 billion of municipal cusips and an additional $40 billion issued under corporate cusips by municipalities. Most of this issuance was tied to refinancing supply executed as advance refundings, which came in at ~$140 billion. The majority of this issuance was shoved into the market during the six-month period from May to October to avoid any potential market dislocations related to the presidential election in November. Post-election, new issuance has been muted, while demand has been incredibly strong across both retail and institutional investors. Consequently, in looking at data compiled by AAM, ‘AAA’ taxable muni spread levels during 2020 have compressed by 10 to 21 basis points (bps) across the yield curve, with the 10yr area providing the strongest performance. Going into 2021, these spreads represent the tightest relationship to Treasuries in the last 15 years. However, when comparing the sector’s yields to other spread sectors like corporates, spread levels remain modestly attractive relative to historical average relationships to ‘A’ rated industrial corporate bonds. Although we believe the taxable muni sector exhibits very limited potential toward further tightening in spread levels, we view the taxable municipal sector as fairly valued. 

In looking forward to supply technicals during 2021, coming into the year, broker/dealer expectations for new issue supply ranged from $470 to $525 billion, with taxable supply incorporating ~$175 billion of this amount (Barclays, Citigroup, JP Morgan, Bank of America). Of the taxable issuance, $125 billion were expected to be refinancings executed as advance refundings (Barclays, Citigroup, JP Morgan, Bank of America). However, most of these estimates were derived before the Georgia senate run-off elections that resulted in Democrats taking majority control of the chamber. Under this new development, there could be substantial changes in the makeup of issuance during the year between the tax-exempt and taxable markets, especially as it relates to any potential Biden/Harris administration initiatives tied to infrastructure and tax reform. 

Under tax reform, the market expects that tax-exempt advance refundings, which were abolished under the Tax Cut and Jobs Act of 2017 (TCJA), will likely be reinstated to the tax-exempt sector. The market also expects that an infrastructure plan will be introduced that will be funded in part within the taxable muni market through the use of direct-pay bonds. This approach would emulate the Build America Bond program that was utilized during the Obama/Biden administration in 2009 and 2010 to fund capital spending. If tax reform and infrastructure are addressed later in the year, we would expect that supply expectations going into 2021 would remain in place. However, if these measures are addressed early this year, the risk is that we could see much higher issuance levels this year, with tax-exempt issuance surprising to the upside. Taxable muni supply would not be expected to change dramatically, as any reduction in advance refunding issuance is expected to be supplanted by direct-pay issuance from infrastructure-related supply. 

Exhibit 7: Tax-Exempt Relative Valuation Levels Remain Unattractive for Insurers

Source: Thomson Reuters Municipal Market Data, Bloomberg

Exhibit 8: Taxable Munis: Compelling Alternative to Tax-Exempts

Source: Thomson Reuters Municipal Market Data, Bloomberg, AAM

High Yield

Exhibit 9: US Below Investment Grade Valuations

Source: Bloomberg and Credit Suisse Leverage Loan Index (CSLLI). Data as of December 31, 2020. ICE BofA ML US Cash Pay High Yield Constrained Index (JUC4)

After a challenging start in the first quarter of last year, US High Yield ended 2020 with strong positive returns as the sector benefited from swift Fed and Monetary policy response to the pandemic, as well as investor demand for higher income alternatives. At the height of the market dislocation, broad market credit spreads widened to a peak +1082 in late March, but then subsequently tightened almost 700 basis points to end the year at +390 as liquidity and sentiment improved (ICE BofA High Yield Index H0A0 Spread to Worst). Total returns were 6.21% for US High Yield, with the higher quality BB-B rated segment performing slightly better at 6.32%, while the lowest quality CCC and lower rated issuers fared the worst at only 2.78% (ICE BofA US Cash Pay High Yield Index J0A0, ICE BofA BB-B US Cash Pay High Yield Constrained Index, ICE BofA CCC & Lower US Cash Pay High Yield Index). Syndicated Loan returns were 2.78% which lagged High Yield given their shorter duration, floating rate profile which fell out of favor as the Fed took short term rates to zero (Credit Suisse Leveraged Loan Index).

Leverage for high yield issuers moved higher during 2020 and finish the year at 5x Debt/EBITDA which compares with pre-COVID multiples near 4x (Muzinich & Co.). Liquidity improved significantly, however, as corporations rushed to raise cash in the new issue market as a precaution for a prolonged downturn. Cash to debt levels improved to almost 20% by year end which is almost double the same measure pre-COVID (Muzinich & Co.). Given the weakness experienced early in the year, the annualized default rate rose to 6.5% (Muzinich & Co.) but appears to have stabilized as there were no defaults in November and only one to report in December. In addition, credit rating upgrades now outnumber downgrades by a ratio of 1.2:1 as further evidence of improving fundamentals (Muzinich & Co.). Assuming the recovery from COVID continues, the default rate is expected to drop precipitously to an annualized rate of 2-3% by year end 2021 (Muzinich & Co.). 

We expect technicals to be favorable in the coming year as demand for higher yielding instruments should persist while new issue supply is expected to be lower than 2020. While valuations appear tight with credit spreads recently falling below the long-term averages, spreads remain 50 basis points wide of the most recent lows in 2018. Opportunities in the market still exist, but we believe it’s critical to evaluate the appropriate levels of risk and reward in portfolios with an actively managed approach and disciplined underwriting process to avoid defaults. 

Income has consistently been the largest component of total return for High Yield over time as the additional carry helps to offset any short term price moves. As prices have improved materially, we expect coupon to be the largest driver of returns in 2021. Given a backdrop of improving fundaments and lower defaults, we expect High Yield bonds to provide returns in the range of 4-5%. Loans have the potential for higher returns of 5-7% as the average price of Loans remains at a discount and a pull to par in prices could supplement the income return. Loans could also benefit from a recent resurgence in CLO issuance which has accounted for as much as 50% of the investor base in recent years (Muzinich & Co.). Additionally, there has been increased demand from investors seeking floating rate coupons as a hedge against the prospects of higher interest rates. Finally, as you can see in Figure 3, both US High Yield and Loans continue to offer attractive yields that can enhance the income of broad market investment grade strategies. 

Exhibit 10: Fixed Income Yields per Corporate credit and Treasuries sub-segments

Source: Muzinich, Credit Suisse Leveraged Loans Index USD, Western European Lever aged Loans Index non-USD denominated, ICE BAML indices, H0A0, HEC0,EMNF, CF0X, CF00, EN00, EF00, G402, G102, EG14, EG11, as of December 15th, 2020

Convertible Securities

The asymmetric risk/return proposition offered by balanced convertibles demonstrated its worth in 2020 as Covid-19 related volatility shook financial markets. With equities tumbling 35-40% into late March, balanced convertibles experienced less than half of the decline, this including market illiquidity and gapping credit spreads that led to Fed intervention. Capital preservation at the March lows provided a strong investment base for the confluence of events that followed: 1) consistent and heavy new issuance, 2) a dramatic rally across equity markets, and 3) collapsing credit spreads. These factors helped to produce the strongest run for convertible investors in decades with Barclays Index data pegging the broad convertible market return at +89% from March 23rd through year-end (Barclays Capital convertible research)

Exhibit 11: U.S. Equities and Convertibles – Cumulative 2020 Total Return

Source: Bloomberg Barclays Index Data, Bloomberg L.P.

While volatility may have been the biggest story of 2020, new issue supply in U.S. convertible markets is noteworthy for the likely sustained impact it will have on the sector’s ability to deliver compelling absolute and risk-adjusted returns into the future. For the full year, 194 deals priced in the U.S. market with proceeds of nearly $115 billion (Barclays Capital convertible research) – higher than 2018 and 2019 combined. Sustained deal flow and market gains, as indicated in Exhibit 2 below, contributed to a convertible market that has increased in size by approximately 50%. While technology and healthcare sector issuers continue to lead in deal volumes, the market also provided access to capital for issuers across a wide variety of market sectors looking to raise funds or build liquidity to endure Covid-related uncertainty. Breadth of issuance and an expanded balanced opportunity set affords investors the ability to diversify risks across industries, an important factor given how far technology shares have come in recent quarters. 

Exhibit 12: U.S. Convertible Market Size and Structure ($Min)

Source: BofA Global Research, ICE Data Indices, LLC

Broad measures of credit health within the convertible market are stable and improving, which is likely to provide stability to balanced sector convertibles should equity markets surprise to the downside. New deal flow is expected to continue at above average levels, yielding another year of organic growth in market size. Critically important in this market, we observe a high level of concentration risk and equity sensitivity in the market which can expose high delta investors and passive index ETF shares to significantly greater levels of volatility relative to actively managed balanced strategies. Our partners at Zazove Associates have been actively rebalancing portfolios through this rally with current portfolios well positioned with proper diversification and equity risk control.

AAM’s outlook for strong economic growth and favorable monetary and fiscal policy in 2021 bodes well for convertible returns in absolute and relative terms. Should our forecast prove accurate, corporate earnings growth will likely yield a favorable environment for equity investors, particularly in cyclically sensitive and financial segments and small/mid cap issuers. While it is difficult to imagine a repeat performance of 2020, we believe mid-to-high single digit returns in equities are achievable. In such an environment, balanced convertible models indicate returns which capture the majority of stock market gains. 

September 30, 2020 by

Recap on Leveraged Loans

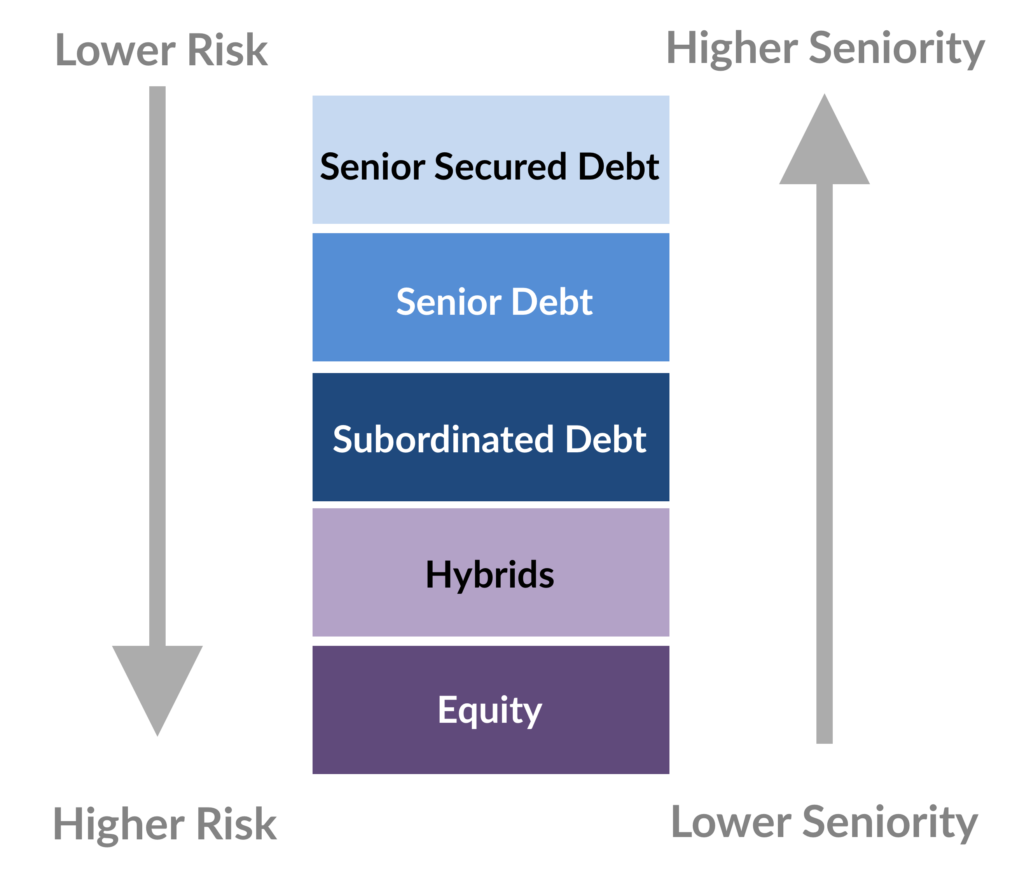
Leveraged Loans are senior ranking floating rate debt instruments typically issued by companies with below investment grade credit ratings. A key advantage of loans is that 97% of the market is 1st lien senior secured debt which is higher seniority in the capital structure (1). In the event of default, this priority claim on assets has resulted in higher long-term average recovery rates of 67% (2). By comparison, most bonds are issued as senior unsecured debt which has long-term recovery rates of 38% (2).  

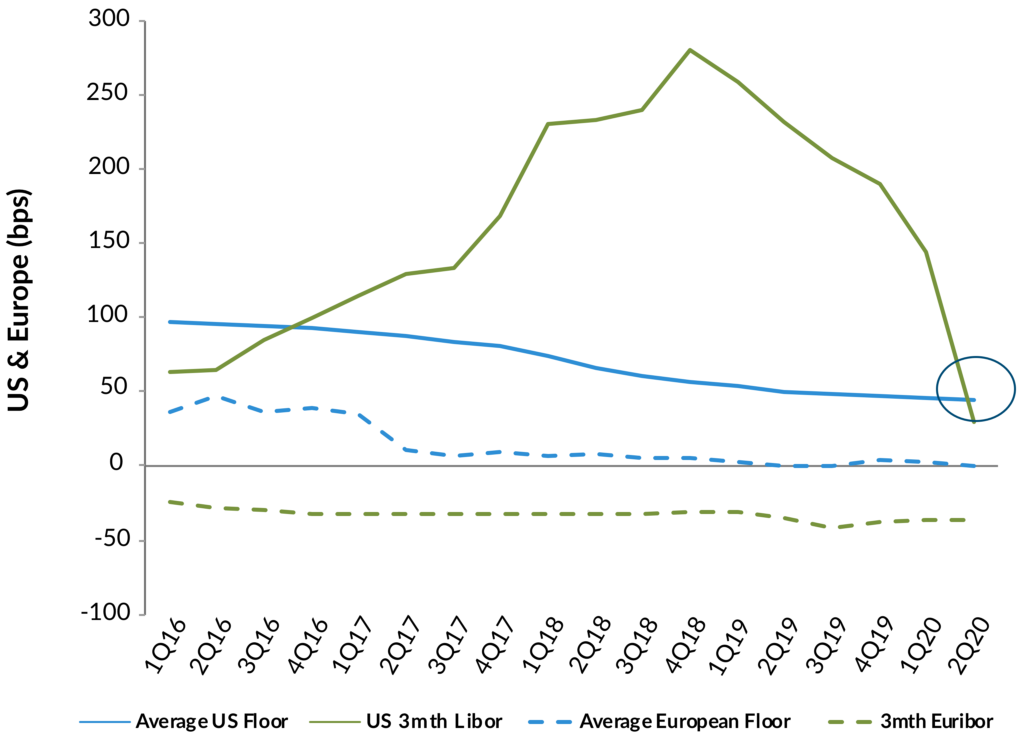
Most loan coupons reset referencing 3 month Libor.  But an important feature in today’s low short-term rate environment is that almost all loans have the benefit of Libor floors which limits how far coupons can drop and in turn helps to protect returns. 

Exhibit 1: Illustrative Corporate Capital Structure

Source: Based on our views and opinion, provided for illustrative purposes only, and not to be construed as investment advice. Source: Recovery rate Moody’s Annual Default Study, published January 30, 2020.

Exhibit 2: Loan Market Libor Floors

Source: Data as of June 30, 2020.  Source Bloomberg, JP Morgan and S&P Global Market Intelligence LCD.

Growth of the US Loan Market and Investor Base

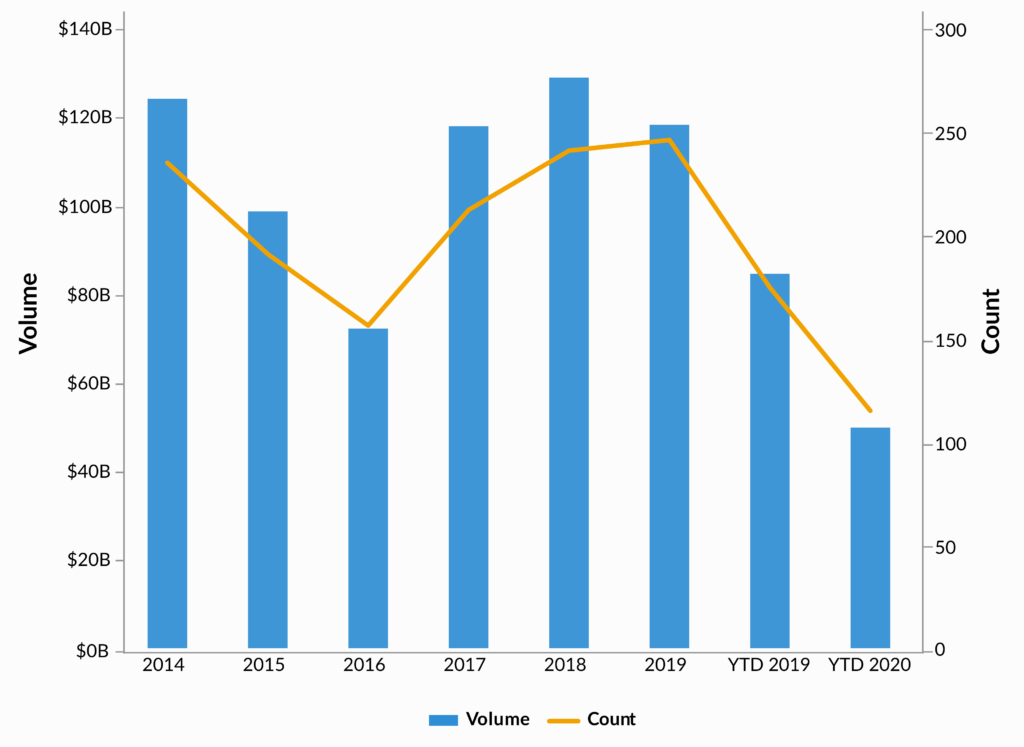
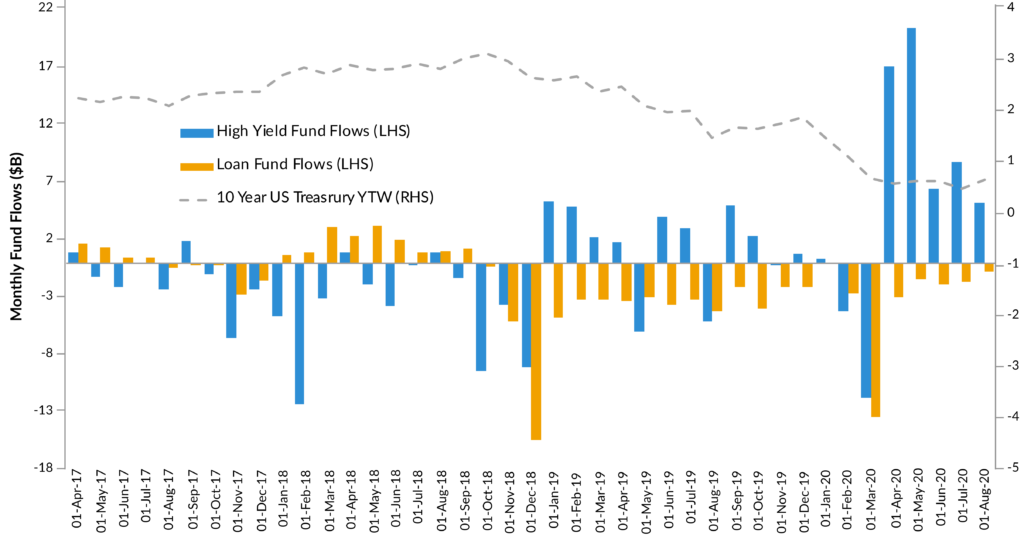
The US loan market has grown significantly since the global financial crisis (GFC) and now stands at $1.27 trillion (3). The U.S. Collateralized Loan Obligation (CLO) market has been a significant driver of demand for loans accounting for as much as 60% of the investor base in recent years. In 2020, however, COVID related concerns reduced CLO issuance which temporarily tempered demand for loans. In addition, retail fund flows are generally correlated to interest rate expectations so recent flows to the loan market have been negative as US Treasury rates reached historic lows.

Exhibit 3: Annual US CLO Activity

Source: Data as of August 31, 2020. LCD, an offering of S&P Global Market Intelligence US CLO Stats and Trends Data. YTD 2019 refers to where CLO activity stood from January 1, 2019 to August 31, 2019.

Exhibit 4: Retail Fund Flows and 10 Year Treasury Yields

Source: Data as of August 31, 2020. JP Morgan High Yield Bond and Leveraged Loan Market Monitor. ICE BofA ML Current 10-Year US Treasury Index (GA10) yield to worst sourced from Bloomberg.

Current Valuations in Leveraged Loans

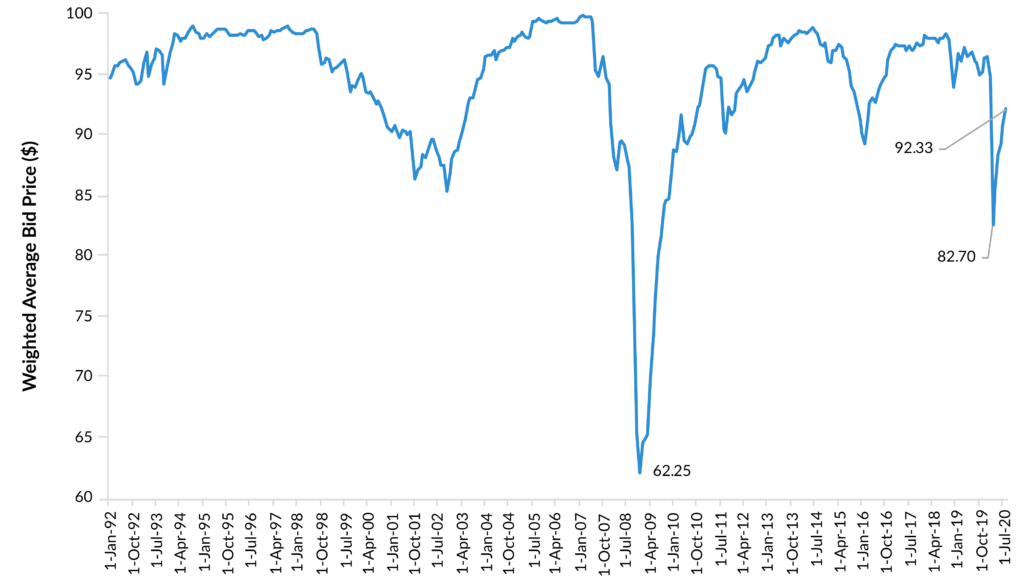
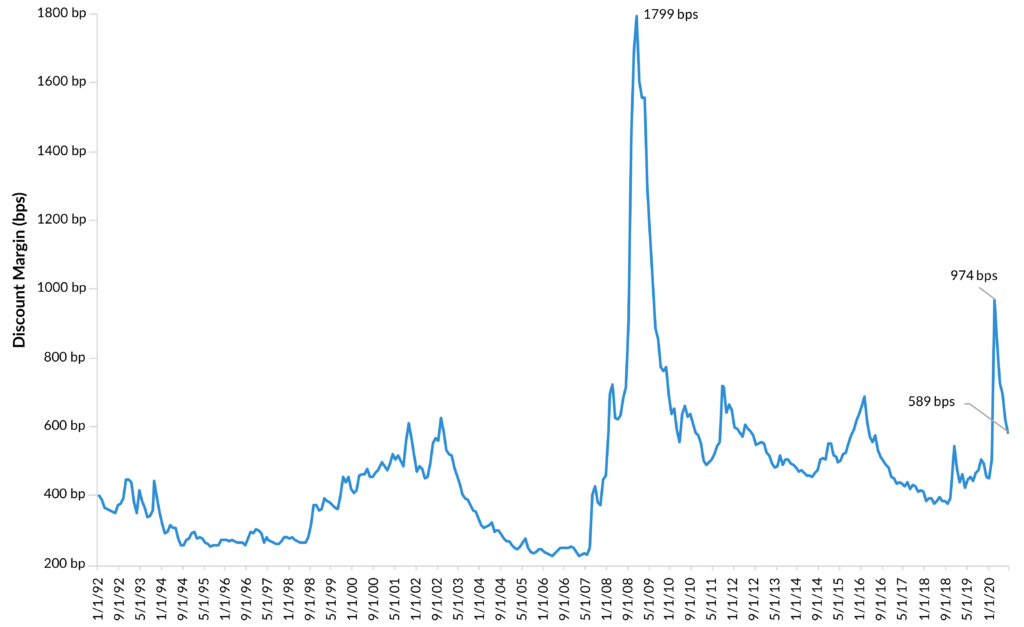
These technical headwinds, along with the recent repricing of risk valuations have caused leveraged loan credit spreads to remain at levels which we believe have historically been attractive entry points for the sector. While trailing 12-month default rates have increased to 4%, we believe that rate should peak in the high single digit percentages in 2020 followed by a decline in 2021 (4). Accordingly, loan spreads over Libor (discount margins) remain elevated, while we believe the average discounted dollar price offers a pull to par opportunity to capture returns as we seek to manage opportunities prudently through the credit cycle. In addition, a recent resurgence in CLO issuance as well as the potential return of retail fund flows could be a catalyst for improving demand. 

Exhibit 5: Weighted Average Bid Price ($)

Source: Credit Suisse Leveraged Loan Index. Monthly data as of August 31, 2020.

Exhibit 6: Discount Margin – 3 Year Life (bps)

Source: Credit Suisse Leveraged Loan Index. Monthly data as of August 31, 2020.

Where Should Leveraged Loans Sit in Insurance Portfolios?

Leveraged loans typically compete for shelf space with high yield in investors’ portfolios. While both products are sub-investment grade lending at heart, there are some significant differences between the products that complement each other well and could provide diversification benefits to an investor’s overall below investment grade exposure. In contrast to high yield bonds, loans are a floating rate product, callable at any time, and typically exhibit lower volatility due to the almost exclusively institutional nature of the investor base. Loans sit higher in the corporate capital structure than high yield bonds, providing different risk considerations. While both asset classes may suffer defaults in a recession, loan recovery rates should be higher than high yield given their senior secured position in borrowers’ capital structure. Finally, loans can offer some additional sector diversity. Of particular relevance this year has been the fact that the loan market had an energy sector exposure of 3% at the end of February 2020, versus 12% for high yield (5).

Regulatory Considerations for Insurance Companies

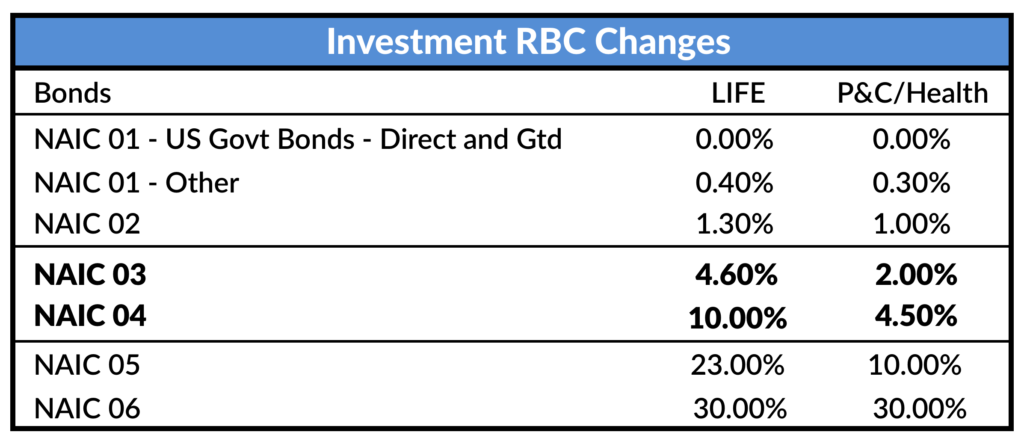
Leveraged loans are schedule D assets with Risk Based Capital charges similar to below investment grade bonds. Almost 90% of the loan market is rated either BB (NAIC 3 equivalent) or B (NAIC 4 equivalent) so we’ve highlighted those corresponding capital charges in the table below (6).

Exhibit 7

Source: NAIC Investment RBC Charges 3/12/18.

Conclusion

In our view, the loan market today is possibly nearing the trough of an economic cycle and should be well positioned for the recovery, both fundamentally and technically. We believe this should create opportunities for investors who can look beyond the headlines. If rates rise again, then retail investors will most likely return to the market in anticipation of this. CLOs, which paused their issuance at the market wides, are being created again, and in the short term demand for loans is likely to outstrip thin supply.

The convergence of global interest rates around zero once again also removes one of the major obstacles for international investors looking at US syndicated loans as hedging costs for buying USD assets have come down substantially. We can also expect to see more international flows into the US syndicated loan market in the coming months seeking to take advantage of the enhanced return opportunity.

We believe loans represent an appealing investment opportunity as a lower volatility source of carry for insurance investors, coupled with some upside potential through the pull to par opportunity in the current market. 

In our opinion, insurance investors seeking to minimize defaults might consider an allocation to loans through an actively managed strategy with a focus on higher quality issuers.

Index Definitions and Sources

CS Leveraged Loan Index – The CS Leveraged Loan Index is designed to mirror the investable universe of US dollar denominated leveraged loan market. The index is rebalanced monthly on the last business day of the month instead of daily. Qualifying loans must have a minimum outstanding balance of $100 million for all facilities except TL A facilities (TL A facilities need a minimum outstanding balance of $1 billion), issuers domiciled in developed countries, at least one year long tenor, be rated “5B” or lower, fully funded and priced by a third party vendor at month-end.

GA10 – The ICE BofA ML Current 10-Year US Treasury Index is a one-security index comprised of the most recently issued 10-year US Treasury note.

LIBOR – LIBOR is a benchmark rate that represents the interest rate at which banks offer to lend funds to one another in the international interbank market for short-term loans. LIBOR is an average value of the interest-rate which is calculated from estimates submitted by the leading global banks, on a daily basis.

Sources

(1) Credit Suisse Leveraged Loan Index as of August 31, 2020.

(2) Recovery rate Moody’s Annual Default Study, published January 30, 2020.  Issuer weighed recoveries 1983-2019. 

(3) Credit Suisse Leveraged Loan Index as of August 31, 2020.

(4) S&P Leveraged Commentary and Data (LCD) index review as of 8/31/2020.

(5) Credit Suisse Leveraged Loan Index (CSLL) and the ICE BofA ML US High Yield Index (H0A0) as of June 30th, 2020.

(6) Credit Suisse Leveraged Loan Index as of 8/31/2020.

Authors

Sam McGairl joined Muzinich in 2016.  He is a Portfolio Manager focusing on syndicated loans. Prior to joining Muzinich, Sam was with ECM Asset Management Limited, where he was a Portfolio Manager responsible for loan and high yield investments in the firm’s pooled loan programmes, as well as being responsible for loan trading across all ECM portfolios. Sam started his career at Bank of Scotland and BNP Paribas before ECM. He is a graduate of the University of Newcastle upon Tyne.

Scott Skowronski, CFA is a Principal, Vice President, and Senior Portfolio Manager at AAM. He has 24 years of investment experience, 19 of which have been dedicated to fixed income. Scott is responsible for constructing portfolios based on client-specific objectives, constraints, and risk preferences.  He is also responsible for communicating market developments and portfolio updates to clients. In addition to this, Scott is a member of AAM’s ‘Outsourced CIO’ Committee. Immediately prior to joining AAM, Scott worked as a Portfolio Manager and Senior Analyst at Brandes Investment Partners. He is a member of the CFA Institute. Scott earned a BA in Risk Management from Illinois Wesleyan University.

July 22, 2020 by

Market summary and outlook

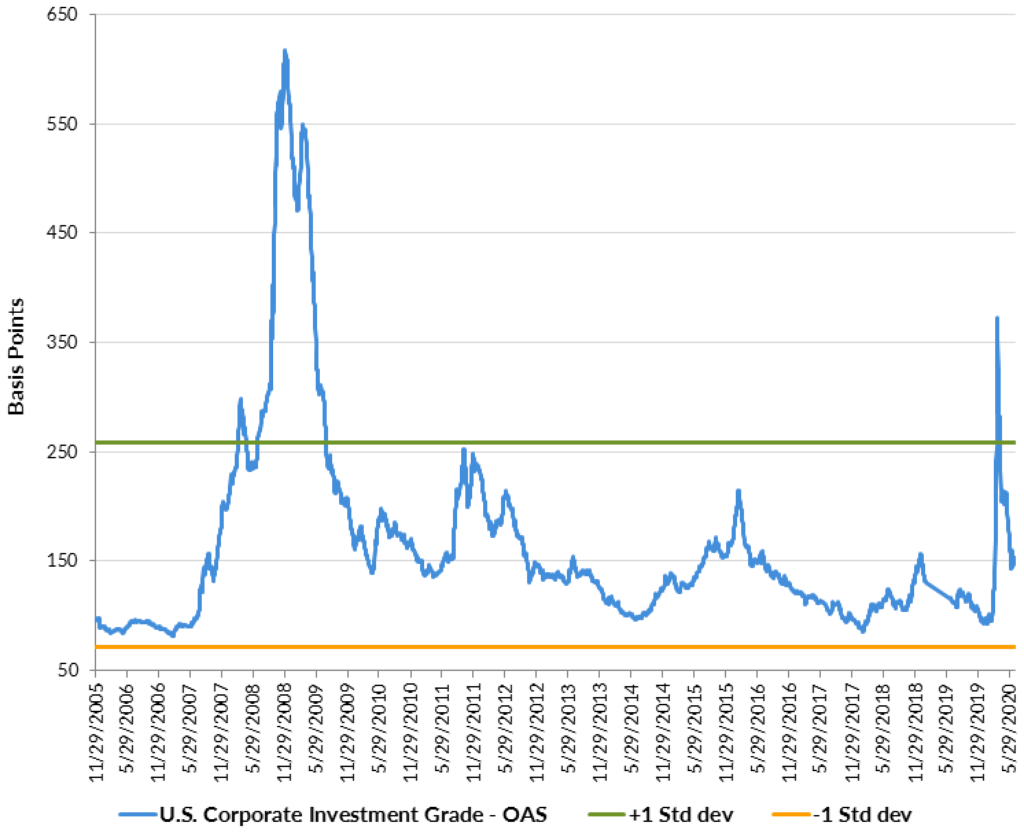
By Elizabeth Henderson, CFA – The Investment Grade (IG) Corporate bond market (per Bloomberg Barclays Index) experienced a historic bout of volatility in the first half of 2020, as spreads widened from a low of 93 basis points (bps) in mid-January to a high of 373 bps on March 23, ending the second quarter at 150 bps (Exhibit 1). Excess returns over Treasuries year-to-date June 30 were negative at -5.4%, but with the Treasury yield rally, total return was 5.0%. The IG market outperformed the S&P Index, which returned -3.1% and High Yield market (per Bloomberg Barclays Index) at -3.8%. 

Exhibit 1: U.S. Corporate Investment Grade OAS

Source: Bloomberg Barclays Index, AAM as of 6/30/2020

The monetary and fiscal support provided to the markets and economy in March set a floor for the markets as it allowed investors to model downside risk. At that time, the market’s estimate for ratings downgrades to high yield far surpassed our analyst team’s bottom-up estimate. This gave us the ability to measure risk and invest at a time of very attractive spreads especially in the new issue market. In regards to new issue, we saw a record amount in all U.S. fixed income markets with the IG market reaching $1.2T by June, as companies looked to increase liquidity during an uncertain time. We expect a more modest $400B to be issued in the second half, and given scheduled maturities, the net amount could be as low as $45B (Source: Eric Beinstein, JP Morgan, “US High Grade Corporate Bond Issuance Review” 7/2/2020). We are expecting that to be higher as companies look to take advantage of low rates for early refinancing and tender activity, and possibly M&A if the outlook for the economy becomes more certain. 

Exhibit 2: New Issuance Hits a Record Pace 

Source: JPM, Deallogic as of 7/2/2020

Valuation is statistically fair with spreads normalizing over the last couple months, at a sector, industry and rating level. The market is reflecting an expectation for the economy to return to pre-COVID 19 levels in the near term. For example, a modest 6% of the IG market reflected risk of credit rating downgrades to high yield at June 30, 2020, down substantially from 25% in late March 2020 and up modestly from 4% at the end of January 2020. If the economic recovery takes longer than expected, we believe that will easily double. 

While we expect spreads to widen in that scenario, technical support is expected to remain stronger than it was in March given the improved cash positions of companies and the Federal Reserve’s corporate bond buying program. At the pace at which it has been buying, the Fed is likely to have significant flexibility under its $750B program that expires September 30, 2020 (although likely extended in a stressed environment) (Exhibit 3).

Exhibit 3: Fed Purchases Corporate Bonds and ETFs

Source: Morgan Stanley as of 7/14/2020

We are closely monitoring the pace of re-opening, expecting spreads to remain highly correlated with that progress as well as the progress developing a vaccine and passing additional fiscal stimulus. After recommending an increase in corporate bond allocations for portfolios in late March and the subsequent tightening of spreads through today, we are recommending a reduction to build flexibility in portfolios to add at more attractive points. This is especially the case in industries and credits we believe will be more vulnerable if the economic rebound is more modest. While spreads had reflected this risk in April as shown in Exhibit 4, this includes sectors like: Autos, Energy, REITs, Banks and non-essential Retail and Leisure. The short end of the curve has recovered and reached pre-COVID-19 spreads, leaving little value relative to other segments of the IG fixed income market.

Exhibit 4: Sector Spreads Relative to Industrial Sector OAS

Source: Bloomberg Barclays Index, AAM as of 6/30/2020

Finally, you’ll notice our newsletter this quarter is longer than usual. Given the degree of uncertainty in the market, we thought it worthwhile to provide more information on topics and sectors most directly related and/or impacted by the COVID-19 pandemic.

Vaccine: When and If

By Michael Ashley – This continues to be a very hot topic, on the minds of most people across the globe. We have seen violent spikes in certain regions of the U.S. and the world, resulting in measured shutdowns which hope to slow transmission and ultimately avoid hospital overcrowding and deaths. There continues to be lots of unanswered questions about this virus, such as “How many people have been infected that have not been tested?,” “How long do antibodies provide protection?”, and “What is the proper quarantine period for those that have tested positive?” Despite these and many more questions, the process of developing an effective vaccine moves forward. There are many vaccines in development and a relatively smaller number that are heading into Phase III trials starting in July (Moderna, Pfizer) and August (AstraZeneca). It appears we could potentially start hearing about results from these trials in the October/November time frame. In a survey to 184 C-level executives and 37 investors across the healthcare sector in May through June, 75% of respondents estimate that a vaccine will be widely available in the second half of 2021 or later. Two-thirds of respondents put the probability for a widely available vaccine at above 50%, and 49% put the likelihood of a therapeutic at greater than 50%. 

Exhibit 5: When Will a Vaccine Become Widely Available?

Source: Lazard Global Healthcare Leaders Study July 2020

With over 100 vaccines in the works, we are confident that one, if not several, vaccines will be proven an effective treatment. The scale and rate at which this process is moving complicates the timeline around “when” a vaccine is available at your local drugstore or doctor’s office. There seems to be some mismanagement at the FDA and this topic could become a political issue given the upcoming election. In short, no one knows when a vaccine will be here and issues of safety have become more concerning. Even if phase III trials go as planned, there’s no guarantee that a vaccine will meet FDA guidelines and will be trusted by the world. Our view remains that an effective, usable vaccine is not readily available for use until 2021, probably not until mid-year. In the interim, we look forward to upcoming trial results this fall that are positive. 

Fiscal Stimulus: When and How Much?

By Garrett Dungee – In regards to the fiscal stimulus timeline, the deadline is quickly approaching before enhanced unemployment benefits expire at the end of the month. The Senate just returned to session on July 20th, and the House enters their August recess on 8/3, and the Senate the following week. This timeline affords a small window for both parties to reach an agreement and pass a Phase 5 stimulus package before the CARES Act programs expire. Both parties return to the Hill the second week of September, two months before the election, where the political stakes will be higher. State and local governments, hospitals, higher education facilities, small businesses, and the consumer require additional stimulus due to the public health crisis. Municipalities are close to the action on the Hill and will continue to lobby their representatives who are well aware of the issues they face. Until there’s a vaccine, it’s likely the economy will not reach its pre-COVID-19 potential. The Fed has communicated its understanding and support. But, the metaphorical ball is in the Senate’s court, and it becomes all about the narrative. Does it change from political pressure? Do we see momentum towards a stimulus bill?

The virus has remained more problematic than many assumed a month ago, especially in southern states. Due to the recent developments, we think the chances of stimulus look better compared to June, where we saw several positive economic surprises, and May, where we saw one retiring house Republican vote for the $3T Heroes Bill.  The consensus among economists suggests an additional package of around $2.4T is needed. Senate Majority Leader Mitch McConnell has confirmed that a Paycheck Protection Program (PPP) extension and more direct payments will be in the Republican bill.  So at a minimum, we could see a PPP and unemployment benefits extension in July or a retroactive extension in August.  We could also see the House stay to negotiate a more substantial relief package, or the House could compromise on a smaller bill for consumers while promising to address the state and local funding issues through the appropriations process for the new fiscal year starting in October.  AAM believes there will be additional fiscal support, although the timing is uncertain, especially given the upcoming recess periods for both the House and Senate. We believe the longer it takes for Congress to pass a package, the more damage will be done to the recovery.

Exhibit 6: End of Relief

Source: U.S. Department of the Treasury, Census Bureau, Federal Reserve, Small Business Administration, Joint Committee on Taxation as of 7/20/2020

Autos: A Volatile Sector that Continues to Face Challenges

By Afrim Ponik, CFA – The COVID-19 pandemic brought shock waves across the automotive industry, impacting original equipment manufacturers (OEMs) and part makers globally. We witnessed a significant cash outflow from the manufacturers as the accounts payable came due, while sales declined 50% or more as reported by WARD’s Automotive Group and published by Bloomberg. Having dealt with liquidity crunches before, car companies drew their revolvers down and together with the vast amounts of cash on the balance sheets, bought themselves enough time to withstand this industry shock in an impressive way. 

Following the mandatory shutdowns, we witnessed an increased demand for cars given people’s change in lifestyle, providing a nice cushion to the prices of used cars and therefore residual values, insulating the captive finance arms from taking write downs. We believe the industry did an impeccable job withstanding this shock, but demand recovery should be slow and other industry challenges loom in the horizon. We highlight electrification of drive trains, autonomous driving, stringent emission requirements, in addition to under utilized manufacturing footprint globally as current and future challenges impacting profitability and requiring significant capital spending.

Energy: A Litany of Challenges

By Patrick McGeever – In the near term, we will closely monitor how energy companies are navigating the challenges posed by the COVID-19 pandemic and the resulting economic weakness. The key items we will be focusing on are:

• production, particularly as we exit 2020; 

• capital spending discipline; 

• free cash flow generation and 

• shareholder friendly actions in this weak commodity environment. 

Many oil producers shut-in production and dramatically reduced completion activity in response to record low oil prices in the second quarter. We believe that producers have brought suspended activities back in recent weeks, but we anticipate the curtailment of drilling since March will lead to production declines of 10%-20% from 4Q19 to 4Q20. We are forecasting capital spending will contract 50%-60% from 2019 to 2020 and believe that any increase in capital spending forecasts will be viewed negatively by stakeholders. We believe free cash flow generation will be better in the second half of the year than in the first half of the year provided higher commodity prices and lower capital spending. 

Notwithstanding COVID-19 related issues, the energy industry faces a litany of challenges in the intermediate term. First, the midstream sector is amid legal challenges surrounding environmental impact studies and potential restraining orders on operations. Additionally, the probability of a change in Iranian foreign policy and therefore Iranian oil exports is growing provided the existing Presidential Polling figures, which indicate that Former Vice President Biden is leading President Trump by 5%-10% in most surveys. Furthermore, the decarbonization of the economy and Environmental, Social and Governance (ESG) forces are increasing, leading to reduced capital allocated to the sector. All of these issues are leading to much higher cost of capital for issuers in the investment grade energy sector, which will challenge even the strongest participants.

The energy sector is rightly trading wide of its historic norms and is currently approximately one standard deviation wide of Industrials according to the Bloomberg Barclays US Aggregate Index. We have been actively upgrading our energy exposure given the risks highlighted. Future investments in the sector will be in companies that can generate positive cash flow in the existing commodity environment without the need to access capital markets to fund its operations; have near term catalysts to improve its balance sheet; and/or have plans to improve ESG governance.

Insurance: Enhanced Liquidity Solves Near Term Problems

By Garrett Dungee, CFA – While it is too early to determine the extent of insured losses stemming from the COVID-19 pandemic, loss estimates by Dowling & Partners, Barclays Research, Autonomous Research, BofA Global Research, Berenberg, and Willis Towers Watson range from $30-107B. The bulk of insured losses are expected to come from non-life commercial lines, including, event cancellation, entertainment, business interruption insurance, and litigation-related expenses. Shelter in place orders meant fewer drivers on the road for personal lines, and the favorable trends are expected to continue at least in the short term. So far, several insurers have pre-announced pandemic related catastrophe losses that point to an earnings, not a capital, event for the industry. These second-quarter catastrophe charges serve to reduce, but not eliminate uncertainty for an industry that remains well-capitalized. 

For life insurance, the pandemic’s disruption to the economy remains a more significant challenge than the exposure to net mortality, however that could change if the trajectory of the virus accelerates towards a worst-case scenario. We believe longer-term, low rates will continue to be a significant headwind for the industry with lower reinvestment rates and as insurers head into their annual assumption reviews. 

Low rates, claims uncertainty, and need for additional liquidity led to a surge in issuance for the sector, almost $50B year to date, on pace to shatter $60B issued in 2019. The strong demand shown for insurance debt with oversubscribed deals points to the resiliency of the sector, and the ability to maintain access if market conditions worsen. 

Banking: Fortress Balance Sheets Bolster Against Pandemic Related Credit Costs

By Sebastian Bacchus, CFA – As we come to the end of the first week of second quarter (2Q20) bank earnings*, there are a number of preliminary observations bolstering our belief that strong balance sheets will allow the sector to remain a source of strength and support for the US economy during the pandemic driven downturn. At this point the ten largest US banks have reported earnings and for the second quarter in a row, results were driven primarily by outsized provisioning for future credit costs as the macroeconomic outlook continues to worsen. In contrast to 1Q20, provisioning by banks that have reported earnings this quarter has been focused more heavily on the commercial and commercial real estate loan books (as compared to a greater focus on consumer lending, especially unsecured consumer credit, last quarter). While we have seen variations in banks’ approach to reserving over the past two quarters, all of the banks are preparing for a protracted downturn with outlooks generally calling for ~10% unemployment levels to remain through YE20 and only gradual reductions through FY21, accompanied by a slow return to economic growth in FY21. As a result, all of the banks are growing their allowance for credit loss (ACL) toward or through 2% of loans, and the allowance is generally being sized in the context of the severely adverse loss scenarios from the recently completed Dodd-Frank Act Stress Test (DFAST), even as realized credit losses remain quite low due to ongoing Federal support for individuals and businesses.

Despite the impact of outsized provisions for loan loss, all of the banks remained profitable (with the exception of Wells Fargo) reflecting still robust pre-tax, pre-provision net revenues (PPNR). Although net interest income was impacted by the meaningful fall in front-end rates following the Fed rate cuts, offsets included strong capital markets revenues and mortgage banking revenues. Importantly, all of the banks announcing earnings this week reported strengthening regulatory capital levels, as the previously announced suspension of stock buy-backs has meaningfully reduced capital return to shareholders, allowing capital to build through retained earnings. Additionally, banks have benefited from stable or reduced levels of risk weighted assets (the denominator in the regulatory capital calculation) as balance sheet growth was primarily driven by the Paycheck Protection Program (PPP) loans which carry a zero risk weight (and zero economic risk) for the banks. We expect further capital guidance from regulators after the banks submit to a second DFAST stress test later this year that incorporates updated macroeconomic projections (most likely during 4Q20). However, we view the regulatory actions on capital return to be explicitly creditor friendly, and reflective of the regulators’ focus on preventing the pandemic from transforming a public health crisis into a financial crisis. 

While the path of the economic downturn remains uncertain, the strong levels of bank capital, strong balance sheet liquidity and growing levels of allowance for credit loss offer a bulwark against credit deterioration that would harm credit investments in the banking sector.

*Publicly reported 2Q2020 earnings releases by banks on our focus list are the source for all of the statistics.

  • Page 1
  • Page 2
  • Page 3
  • Interim pages omitted …
  • Page 10
  • Go to Next Page »

Get updates in your inbox.

  • Investment Strategies
    • Investment Grade Fixed Income
    • Specialty Asset Classes
  • Our Clients
    • Client Experience
    • Sample RFP Download
  • Insights
    • Video
    • Webinar
    • News
    • Podcasts
  • About
    • Our Team
    • Contact
    • Client Login

Disclaimer: Asset Allocation & Management Company, LLC (AAM) is an investment adviser registered with the Securities and Exchange Commission, specializing in fixed-income asset management services for insurance companies. Registration does not imply a certain level of skill or training. This information was developed using publicly available information, internally developed data and outside sources believed to be reliable. While all reasonable care has been taken to ensure that the facts stated and the opinions given are accurate, complete and reasonable, liability is expressly disclaimed by AAM and any affiliates (collectively known as “AAM”), and their representative officers and employees. This report has been prepared for informational purposes only and does not purport to represent a complete analysis of any security, company or industry discussed. Any opinions and/or recommendations expressed are subject to change without notice and should be considered only as part of a diversified portfolio. A complete list of investment recommendations made during the past year is available upon request. Past performance is not an indication of future returns. This information is distributed to recipients including AAM, any of which may have acted on the basis of the information, or may have an ownership interest in securities to which the information relates. It may also be distributed to clients of AAM, as well as to other recipients with whom no such client relationship exists. Providing this information does not, in and of itself, constitute a recommendation by AAM, nor does it imply that the purchase or sale of any security is suitable for the recipient. Investing in the bond market is subject to certain risks including market, interest-rate, issuer, credit, inflation, liquidity, valuation, volatility, prepayment and extension. No part of this material may be reproduced in any form, or referred to in any other publication, without express written permission. *All figures shown are approximate and subject to change from quarter to quarter. **The accolades and awards highlighted herein are not statements of any advisory client and do not describe any experience with or endorsement of AAM as an investment adviser by any such client.

Copyright © 2024 AAM | Privacy and Disclosures

  • LinkedIn
  • YouTube