• Skip to primary navigation
  • Skip to main content
  • Skip to footer
AAM CompanyTransparent Logo

AAM Company

AAM Company Website

  • Investment Strategies
    • Investment Grade Fixed Income
    • Specialty Asset Classes
  • Clients
    • Our Clients
    • Client Experience
    • Download Sample RFP
  • Insights
    • Video
    • Webinars
    • Podcasts
    • News
  • About
    • Our Team
    • Events
  • Login
  • Contact Us
Contact

Featured

July 8, 2020 by

Saudi Arabia has pegged its currency, the Riyal, to the U.S. Dollar at a rate of 3.75 since 1986. Below we highlight the rationale for the peg and the benefits it has provided to the Kingdom over the years. We also explore how weak oil prices, the Covid-19 pandemic and large fiscal deficits are undermining its economic profile. While we believe the probability of a de-peg or devaluation is currently low, we highlight issues that may lead to change in the Riyal-Dollar regime and the consequences it would lead to in the energy sector.

  • A change to the Riyal-U.S. Dollar regime is a low-probability high-risk event
  • Historically stable peg has provided benefits making future changes difficult and costly
  • Shrinking FX reserves contribute to currency risks
  • Future issues to monitor include Vision 2030, shrinking economy, change to Iran policy
  • If risks materialize there is substantial downside for fixed income energy investments 

The reasons for the Riyal – U.S. Dollar peg and historical benefits 

In October 1973, in response to apparent US involvement in the Arab-Israeli War, Saudi Arabia led an Arab oil embargo against the US that led to the world’s first global oil shock. Despite the embargo ending after five months, OPEC kept prices elevated, putting significant pressure on the external finances of the US. In response, the Nixon Administration struck a deal with the Saudi government in 1974 whereby the Dollar proceeds of US purchases of Saudi oil would be reinvested by the Saudi government in US Treasuries. The Saudis also agreed to price oil in US Dollars globally. In return, the US provided the Saudis with military aid and equipment. This was the foundation of the petrodollar system which helped the US Dollar regain its global supremacy after the collapse of Bretton Woods and has linked Saudi oil revenues and savings to the US Dollar to this day. (1)

Like today, in the 1970’s the vast majority of the Saudi economy was US dollar based and its savings were being invested in US Treasuries, yet the Riyal was pegged to the International Monetary Fund’s Special drawing rights (SDR). The SDR, an artificial currency instrument at the time was calculated from a weighted basket of major currencies, including the U.S. Dollar, Deutsche Mark, the French Franc, Japanese Yen and British Pound. This currency mismatch and a roaring Saudi economy led to very high inflation, which peaked at 35% in 1975. After the oil crash in the early 1980’s, the Saudi devalued its currency and pegged it to the US Dollar at 3.75 Riyals per Dollar. It has remained pegged at this level for the past 34 years.

The Riyal-Dollar peg has provided monetary stability in that exchange rates have remained stable and inflation has rarely been higher than 5% since the current peg was established in 1986. The peg has also provided some revenue predictability, a desirable characteristic given that its economy is highly dependent on volatile oil prices. Lateral benefits include lower lending rates and credit growth. Furthermore, according to an analysis by Goldman Sachs, the cumulative current account balance since 1998 (i.e., net FX savings of the economy) is as much as $400 billion greater now than it would have been under a floating exchange rate regime. (2) 

Confidence Remains in the Riyal – U.S. Dollar regime 

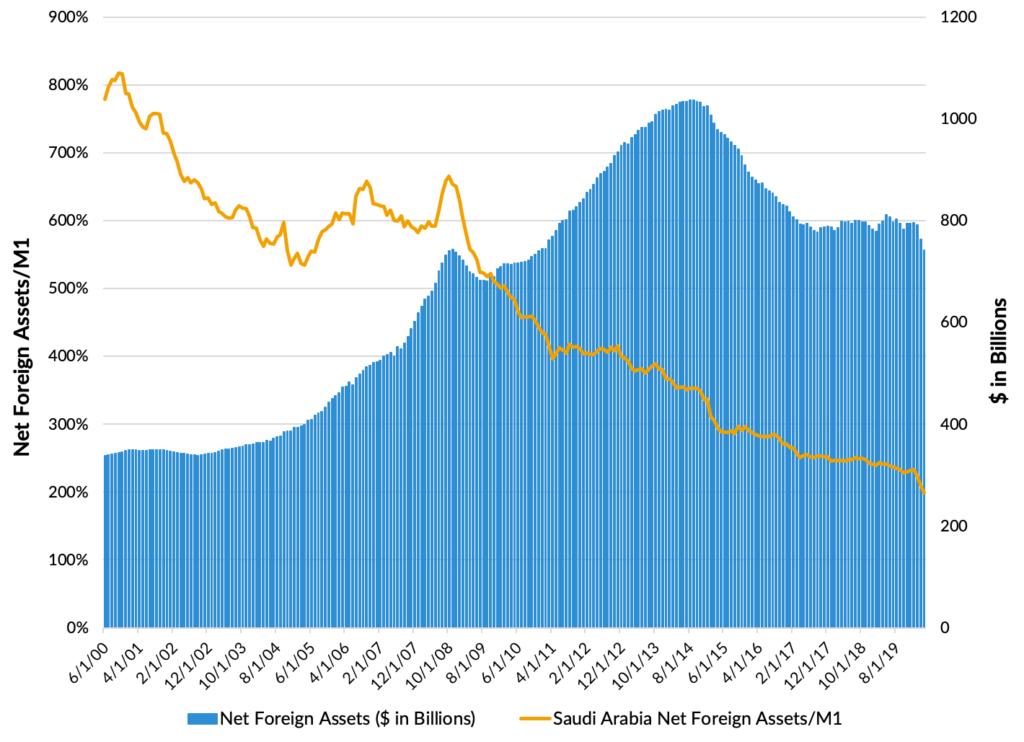
A key feature to maintaining a fixed FX regime is confidence that the domestic country (in this case Saudi Arabia) holds adequate FX reserves of the pegged country (in this case U.S. dollar reserves). Taiwan, for example, was largely immune to the Asian crisis of 1997-98 due to its large holdings of foreign exchange reserves. The measure that is commonly used to evaluate this coverage is FX reserves to M1 money supply, or narrow money. 

Exhibit 1 shows that while the Saudis still have adequate coverage of narrow money (around 200% of M1), net reserves have declined to $742 billion (including sovereign Private Investment Funds) and they are expected to continue to decline given the expected budget deficits for the next several years. 

Exhibit 1: FX Reserve Coverage Deteriorating

Source: Saudi Arabia Monetary Agency; Reserves include estimated $300B with Private Investment Fund as of 6/30/2020.

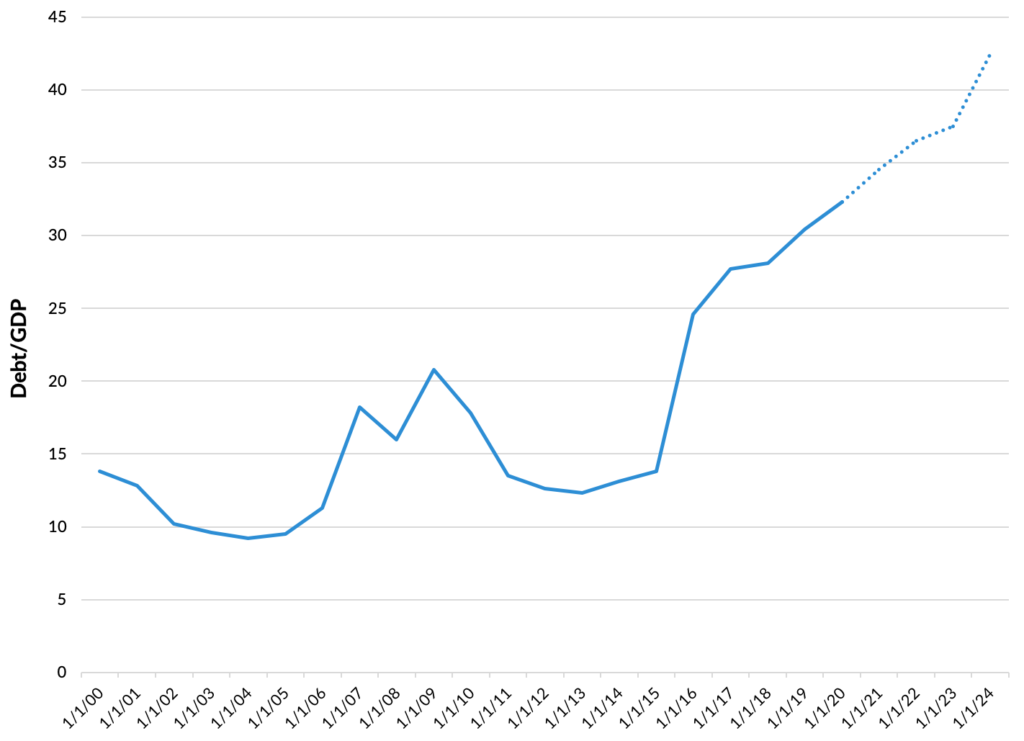
According to the IMF, “the negative affects of the pandemic, significantly lower disposable income for oil exporters after the dramatic fuel price decline, imply a sharp recession in Saudi Arabia of –6.8%.” Additionally, the government agency suggests that Saudi Arabia will be running a budget deficit of 11.4% ($89 billion) and 5.6% ($44 billion) in 2020 and 2021, respectively. This deficit will have to be funded either by further drawing down reserves or issuing additional debt. A draw of the reserves further weakens the coverage of narrow money. Raising debt is the more likely avenue as the government said last month that it planned to raise its debt ceiling from 30% to 50% of gross domestic product as it borrows more to cope with the crises (Exhibit 2). Either approach will likely result in further downgrades of the Kingdom by the rating agencies.

Exhibit 2: Saudi Arabia External Debt as % of GDP

Source: IMF, AAM as of 6/30/2020.

In response to the present economic challenges, fiscal deficits, and funding hurdles, in May 2020 the Saudi Finance Minister announced several fiscal measures to improve government finances by approximately $30 billion. These measures include the discontinuation of a cost-of-living allowance for public employees, a value-added tax that will increase from 5% to 15% as of July 2020 and substantial cuts in spending on key Vision 2030 infrastructure projects. The cost-of-living allowance represented about 10% for earnings of Saudi nationals, and its discontinuation will thus cut real incomes. 

Considerable Challenges Likely to Erode Confidence

The Kingdom faces a significant dilemma – it can continue to fund its ambitious Vision 2030 transformational plan with fiscal deficits and maintain support from its young population or delay progress, maintain near term fiscal health yet risk losing the vital support from its growing labor pool. So far, it appears as though it is choosing to plow ahead with the plan and live with meaningful fiscal deficits. 

The Kingdom’s estimated $1 trillion Vision 2030 program to diversify the economy and sustain living standards in a less oil dependent world is viewed positively from Crown Prince Mohammad bin Salman’s base of support. The Crown Prince promised that Vision 2030 would deliver economic prosperity and millions of new private sector jobs for young Saudis. If these economic benefits appear to grow more elusive, public endorsement for the Vision 2030 agenda may dissolve and threaten the strong backing from the public. However, with Saudi Arabia’s finances increasingly squeezed, funds are being diverted from the Vision 2030 plan to offset the economic slump. In early May, the Saudi’s apparently cut $8 billion from the budget as part of its austerity actions. (3)

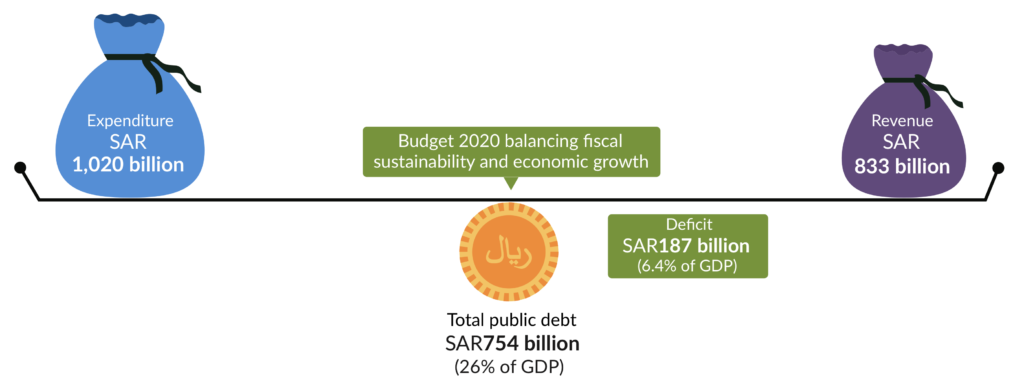
In addition to substantial expenditures, we believe the threat of growing deficits is rising due to shrinking revenues. According to the Saudi Arabia Monetary Agency, more than 60% of private sector employment is in the Retail, Transportation and Construction industries, all are focal points of the Vision 2030 plan and all have been hit by the pandemic due to the lockdown. As the Kingdom undergoes a second wave of the virus and limits the number of people allowed to perform the annual pilgrimage, we believe those industries will experience more pain and the budget deficit will grow (Exhibit 3).

Exhibit 3: 2020 Budget Analysis

Source: Ministry of Finance, KPMG (pre-Covid 19) as of February 2020.

Of equal concern is the outcome of the U.S. Presidential election in November 2020, the potential changes to Iranian foreign policy and how that may affect oil prices. Many polls currently indicate Senator Joe Biden is leading President Trump by 5%-10% in the upcoming election. Should Senator Biden win the election, there is likely to be important changes to U.S. foreign policy toward Iran. Many of the leading architects of the 2015 Joint Comprehensive Plan of Action nuclear deal are senior Biden foreign policy advisors and a renegotiation of that agreement could be a key foreign policy priority. It has been reported that one plan being considered by these advisors would allow Iran to export around 700,000 barrels of oil per day. This would negatively affect oil prices and could result in another round of market share fighting between Saudi Arabia, Iran, and other OPEC+ members. 

Moreover, Biden has stated to the Council on Foreign Relations that he wants a “reassessment” of U.S. support for Saudi Arabia in the wake of the murder of journalist Jamal Khashoggi, the Saudi-led war in Yemen, and domestic human rights violations. Furthermore, he also stated he would stop arms sales to the kingdom (recall that this was one of the pillars of the original Riyal – US Dollar regime) and treat Riyadh like a “pariah” on the world stage. (4) Taken as a whole, we believe a Biden victory would likely diminish the already deteriorating economic health of Saudi Arabia.

Implications to Saudi Arabia and Energy Markets of a Change to the Riyal – U.S. Dollar Regime

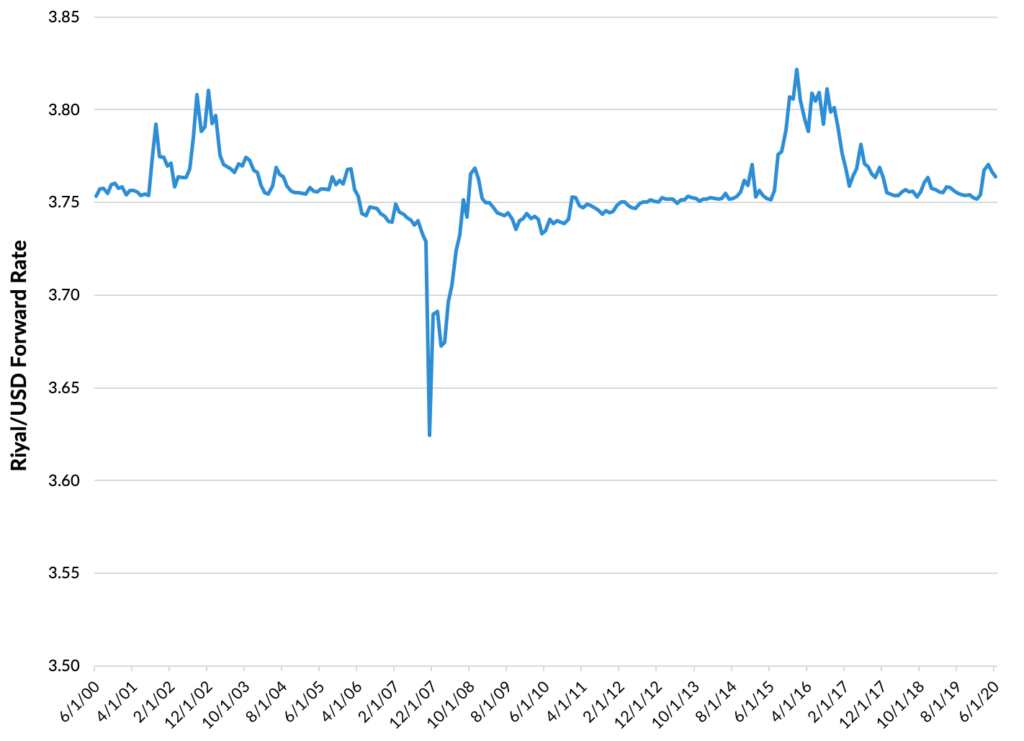
We believe the likelihood is low of a de-pegging or devaluation of the Riyal given the stability the relationship has provided historically, the commitment to the peg from the Saudi Arabia Monetary Agency and the size of a cut necessary to achieve coverage of narrow money in a low oil environment. According to Goldman Sachs, over a three-year horizon, a minimum 50% devaluation would keep reserves above the narrow money level in absolute terms but under a $30 oil environment a devaluation of at least 80% would be required to stabilize the reserves. (5) The foreign exchange market is also discounting the threat of a devaluation over the next 12 months as seen by the stable forward FX rate in Exhibit 4.

Exhibit 4: 12 Month Forward FX Rate Riyal per USD

Source: Bloomberg as of 6/30/2020.

However, given the risks we have highlighted to the Saudi economy and therefore its Foreign Reserves, we believe the possibility of a devaluation will rise over the next several years particularly if oil prices remain in the $40 range or if few fiscal adjustments are made. Below we highlight consequences of a change.

According the New York Fed, generally speaking there are two implications of a devaluation: 1) it makes the pegged country exports relatively less expensive for foreigners; 2) it makes foreign products relatively more expensive for the pegged country’s consumers, thus discouraging imports. The first point is more critical to oil prices and energy markets. The second point is more critical specifically to Saudi Arabia.

Saudi Arabia’s major export, oil, is dollar based and a devaluation would have little bearing on output levels and exports. However, on the revenue side, a depreciation in the Riyal, would increase oil revenues for Saudi Arabia, as every barrel of oil sold will bring in more Riyals for a given Dollar oil price. We believe a weaker Riyal thus would enable the Saudis to maintain or increase production levels in a market share battle with other oil producers and still address their budget shortfall. Therefore, a de-peg or meaningful devaluation of the Riyal would have negative implications for oil and energy markets. A de-peg or devaluation combined with Iranian exports returning would have significantly negative implications for oil prices and the entire energy sector. This scenario likely would result in downgrades and higher yields for many investment grade energy companies and defaults for weaker positioned companies in the high yield energy sector. 

With regards to the second point from the New York Fed, Saudi imports represent a relatively high proportion of domestic consumption. Consequently, a real danger of de-pegging or devaluing the Riyal is higher inflation in Saudi Arabia. This would of course likely be followed by higher interest rates to control that inflation. Additionally, to the extent that devaluation is viewed as a sign of economic weakness, the creditworthiness of the nation may be jeopardized, it would likely dampen investor confidence and hurt the country’s ability to secure foreign investment. (6) This would conflict with the country’s desire to increase foreign direct investment as part of the Vision 2030 plan. Mitigating this concern somewhat, is that the Saudis could reduce the need to implement unpopular fiscal spending policies (like cutting Vision 2030 expenditures) and would boost aggregate demand in the economy to fight unemployment. 

Summary

Saudi Arabia is facing significant challenges in the next several years and how it chooses to address them will affect oil prices and investment grade energy companies. Expenditures to develop an economy less dependent on oil combined with shrinking oil revenue is leading to deteriorating financial conditions. A high-impact low-probability event to address shrinking reserves and expanding fiscal deficits is to de-peg or devalue its currency. While market confidence in the peg remains, there are considerable risks on the horizon that we will continue to monitor. If the risks we highlighted materialize, there are downside perils to both oil prices and investment grade energy investments.

  1. Andrea Wong, “The Untold Story Behind Saudi Arabia’s 41-Year U.S. Debt Secret,” (Bloomberg), May 2016
  2. Farouk Soussa, “Saudi Riyal Peg Has Served Economy Well, Likelihood of Devaluation is low,” (Goldman Sachs), May 2020
  3. Paul Cochrane, “Mohammed bin Salman’s Vision 2030: Can Saudi Arabia afford it?,” (Middle East Eye), June 2020
  4. Candidate Tracker, (Council on Foreign Relations), December 2019
  5. Farouk Soussa, “Saudi Riyal Peg Has Served Economy Well, Likelihood of Devaluation is low,” (Goldman Sachs), May 2020
  6. Currency Devaluation and Revaluation, (Federal Reserve Bank of New York), September 2011

March 24, 2020 by

The blow-out in corporate bond pricing over the past two weeks has raised the question “are we seeing the bursting of a credit bubble?” We do not believe this is the case, but rather that we are seeing a fear driven flight to cash by investors as they digest the rapidly developing coronavirus situation and the knock-on effects on the economy. This is compounded by the inability of capital constrained Wall Street intermediaries to take large amounts of corporate inventory on balance sheet which has further widened bid/ask spreads.

The recent moves by the Fed should help, including reinstating the CP backstop facility and providing support for investment grade corporate bonds in the primary and secondary markets. The new issue market is open for investment grade credits viewed as defensive (i.e., telecom, utilities, food/beverage). Moreover, banks are being encouraged by the Fed to support consumers and business which are facing financial hardship due to COVID-19. We are seeing waves of headlines from banks of all sizes canceling their share repurchase programs and providing more support for borrowers. Private lenders are also working with customers to enhance liquidity, although transparency in that market is much more limited. 

Corporate credit risk needed to reprice in the current tumultuous environment. Companies, even in defensive sectors, like telecommunications, have withdrawn guidance given the unknowns related to the virus and the changes they have to make to their business to accommodate people during this time. Equities have repriced given the uncertainty in both earnings and the cost of capital. This spread widening reflects the increased volatility and illiquidity as well as default risk as the probability of downgrades increases. For BBB-rated corporate issuers, it is more meaningful which is why the spread difference between A and BBB credits continues to widen substantially. We are starting to see the credit ratings of companies directly impacted by the pandemic downgraded or placed on negative outlook by the rating agencies (e.g., DIS). Rating agency actions are difficult to predict in these environments as they have their own internal politics and risk policies.

This environment is a reason why companies maintain liquidity facilities and manage their debt maturity schedule. At this point, we look to prior recessionary periods to guide what might happen next. We had expected spreads to widen to 200+bps if a recession became a “base case,” and now the question is related to the timing and extent of the recovery to determine the peak in spreads. We estimate that approximately 25% of the investment grade corporate market or $1.6 trillion is reflecting the increased risk of falling to high yield with about 10% trading like high yield credits today. According to Moody’s about 12-13% of BBBs were downgraded to high yield in the mid-1980 and 2002 recessions. Therefore, while spreads could continue to widen, the market is already reflecting elevated risk of downgrades to high yield. We continue to expect downgrades will occur, but the order of magnitude to approximate $500 billion.

We expect spreads and liquidity to stabilize when there is a reduction in virus related uncertainty and it is clear that the Fed programs and fiscal initiatives are working to cushion the economy. Until then, we would expect volatility to remain elevated.

February 4, 2020 by

Economic Outlook – Marco Bravo, CFA | Senior Portfolio Manager

Market Outlook – Reed Nuttall, CFA | Chief Investment Officer

Corporate Credit – Elizabeth Henderson, CFA | Director of Corporate Credit

Structured Products – Scott Edwards, CFA | Director of Structured Products

Municipal Market – Gregory Bell, CFA, CPA | Director of Municipal Bonds

High Yield – Scott Skowronski, CFA | Senior Portfolio Manager

Convertibles – Tim Senechalle, CFA | Senior Portfolio Manager

Economic Outlook

AAM’s macro-economic outlook for 2020 is centered around four key themes: (i) moderate U.S. economic growth, (ii) subdued inflation, (iii) a Federal Reserve on hold, and (iv) Treasury yields staying low. Consensus forecasts have real GDP growth in the U.S. slowing to 1.8% for 2020 from 2.3% in 2019. As shown in Exhibit 1, the projected moderation in GDP growth is due to slightly weaker spending from the consumer, a deterioration in net trade, and lower government spending. Fixed private investment, which includes business spending and residential investment, is expected to improve in 2020 and contribute positively to overall GDP growth. 

Exhibit 1: Contribution to GDP Growth

Source: Bureaus of Economic Analysis, Bloomberg

Downside risks to economic growth include uncertainties caused by the U.S./China trade dispute, slowing growth in Europe and China, weaker corporate profits, U.S. elections, and an increase in geopolitical risks. These risks are largely expected to negatively impact manufacturing activity and business spending. The signing of the U.S.-China Phase 1 trade deal along with indications that the weakness in manufacturing activity may be stabilizing are both positive developments as we start 2020. Consumer spending, which is the largest contributor to GDP growth, continues to be supported by a tight labor sector, modest wage gains, low interest rates and household balance sheets that are still in good shape. We expect GDP in the U.S. to increase between 1.5% to 2.5% for 2020 and view the risks to GDP growth as modestly skewed to the upside. 

Both headline inflation (Consumer Price Index) and the core PCE Price Index were below the Fed’s 2% target in 2019. After averaging 1.8% last year, the CPI is expected to tick higher and average 2.1% in 2020. Core PCE, the Fed’s preferred measure of inflation, is expected to remain below the Fed’s target and average 1.9% for 2020. With average hourly earnings increasing around 3%, in line with productivity growth and underlying inflation, we don’t see much pressure on inflation to move significantly above the Fed’s 2% target.

The Federal Reserve cut rates three times last year in order to “protect the U.S. expansion in the face of rising downside risks from trade tensions and slowing global growth.” With those risks having subsided to some degree and inflation expected to remain subdued, we see no impetus for the Fed to either lower rates further or reverse course and begin raising rates under its current monetary policy framework. This view is not shared by the consensus which is calling for one rate cut this year, most likely following the November elections. Moreover, around mid-year 2020, the Fed is expected to finish a review of its “monetary policy strategy, tools and communication practices,” which could present new factors for the market to digest, increasing uncertainty and volatility.

Treasury yields, according to consensus forecasts, are expected to move modestly higher from current levels. The benchmark 10-year Treasury yield is forecasted to end 2020 at 2.0% based on the median forecast among economists. With manufacturing sentiment indicators outside the U.S. showing signs of stabilizing, sovereign bond yields have moved off their lows and could put pressure on U.S. yields to move higher. In addition, higher yields outside the U.S. could weaken the U.S. dollar and reduce the deflationary impact from a strong currency, which could steepen the yield curve. We are calling for the 10-year Treasury yield to end the year around the consensus estimate of 2%.

Market Outlook

Exhibit 2

Source: Bloomberg

2019 – WOW, what a great year to be an investor! 2019 started with a bang, after a horrible 4Q2018 driven primarily by the Federal Reserve raising rates for the fourth time in the year all while economic indicators slowed. The Fed seemed tone deaf as they expected four more hikes in 2019, sending the market into a late-year panic in 2018. However, the Fed quickly backtracked in early 2019. This accommodative posture from the Fed effectively reversed the spread widening and equity market sell-off in 4Q2018, putting all U.S. markets on track for stellar returns. With the Fed cutting rates three times in July, September, and October respectively, the outlook for risk assets improved significantly. There were several factors of concern; Primary among them was the effect of the tariffs and the tweets about tariffs. As the U.S.-China Phase 1 trade deal was nearing completion, the last major hurdle for performance in 2019 was put aside. This resulted in a strong Q4 and put 2019 equity market returns over 30%, while the broad fixed income market returned 8.72% with the corporate bond sector leading the way.

2020 – We’re off to a good start. However, the coronavirus outbreak and the resulting selloff in equities, commodities, and other risk assets sends a clear message that the markets are fragile; With the markets seemingly priced to perfection, it doesn’t take much to disrupt them. We expect stable albeit low GDP growth this year and a Fed that will be accommodative should U.S. growth falter. Although we have a benign credit outlook, with spreads at these tight levels there is limited upside in taking an aggressive position by adding low quality credits. We continue to recommend the focus on security selection and credit quality in this tight spread environment.

With a stable economy, very low interest rates, and limited inflation, we are particularly cautious about Treasury yield fluctuations due to a flight to quality or change in inflation expectations. We have positioned our portfolios with limited call or extension risk to take advantage of sudden changes in the yield curve. Over the last two years, having an underweight to MBS has been profitable as yield levels have been volatile.

Since we expect a stable economy and strong technical factors, this should be a good year for the equity markets. We are working with our clients to ensure that portfolios have been rebalanced in accordance with strategic targets. 

Corporate Credit 

2019 was a record year for markets, and the investment grade (IG) corporate bond market was no exception. Its 6.8% excess return over similar maturity Treasuries exceeded expectations, due largely to the technical support related to more dovish central banks in the U.S. and Europe as well as China. The corporate IG Option Adjusted Spread (OAS) tightened 60 basis points (bps) to 93 bps, nearing its 10-year minimum of 85 bps realized in early 2018 and approaching 1.5 standard deviations below its 10-year average.

Exhibit 3: U.S. Corporate Investment Grade OAS

Source: Bloomberg Barclays Index, AAM as of 12/31/2019

While the 25-year adjusted corporate market OAS averages 135, in times of technical support (rates, QE/liquidity) and fundamental stability, it is lower. Those periods are often in the later stage of the economic cycle; for example, 2003-2006 and 1995-1997. We expect this dynamic to largely repeat itself in 2020, due to our expectation for lower net corporate bond supply, stable interest rates, and ample central bank support and liquidity globally. However, there are outsized risks that are likely to increase market volatility including but not limited to uncertainty regarding the U.S. election and foreign policy as well as the Federal Reserve’s monetary policy goals. The coronavirus is a recent example, and IG spreads to start the year are close to 10 bps wider. Our expectation is for slightly wider spreads by year-end 2020, with an OAS ranging from 103-123. 

Exhibit 4: OAS and VIX Highly Correlated

Source: Bloomberg, AAM

AAM expects credit fundamentals to be largely stable in 2020. After years of increasing and elevated debt leverage, we expect leverage to marginally improve as companies work to deleverage in line with rating agency targets and uncertainty keeps companies financially disciplined. Companies with higher credit ratings and lower projected growth are more likely to take advantage of low rates to increase debt leverage vs. those rated in the ‘BBB’ category. The uncertainty in regards to the U.S. election and foreign policy should keep M&A activity muted at least for the first nine months. For example, the latest Duke CFO Survey continues to point to a high risk of a U.S. recession in the next 12-18 months, causing firms to focus on building liquidity and lowering debt balances and costs while remaining cautious on capital investment. We expect continued asset sales and divestitures for investment grade companies, which could increase debt issuance in markets such as high yield and loans. Lastly, we expect increased shareholder activism and investor attention on ESG related matters to continue in 2020. 

We expect revenue growth to increase in 2020 by 4-5% on average as industrial, manufacturing, and technology sectors benefit from stable-to-improved economies globally and a normalization of inventory levels. Consumer related sectors are expected to grow 1-3% given the high degree of competition and supply for the level of demand. EBITDA and earnings are projected to grow 8-9%, with capital spending growing 2-3%. Technology oriented firms should grow at a much faster pace after the rationalization of inventories in 2019 vs. orders as well as the ramp expected in 5G related spending. Conversely, the other end of the growth spectrum includes industries that are still oversupplied for the level of demand – industries  such as autos and construction machinery. Accordingly, we expect more capital investment from technology and communication services companies with little to no growth in capital investment from traditional industries like manufacturing and energy. The main risk to this forecast is lower than expected growth from overseas and/or the U.S., reigniting recession concerns. 

The technical outlook for the corporate market remains favorable, with gross and net debt issuance expected to be lower in 2020 vs. 2019. This is consistent with our fundamental outlook related to deleveraging and capital spending. Lower debt supply coupled with strong demand from foreign investors and insurance companies suffering from low relative yields should support spreads. A risk to this forecast relates to rate volatility and/or the shape of the yield curve (bear flattening in particular). We are biased to the intermediate part of the curve given the lack of absolute value on the long end. ‘BBB’ rated firms remain fairly valued on average vs. higher rated peers. This, in addition to our expectation for deleveraging and modest spread widening for the market, causes us to prefer higher rated BBB securities.

After two years of systemic risk driving credit spreads, we expect idiosyncratic risk to drive portfolio performance in 2020. In general, we recommend prioritizing defensive sectors due to our expectation for modestly wider spreads from low levels to start 2020.

Exhibit 5: AAM Sector Outlook for 2020

Source: AAM

Structured Products

Unlike 2018 when most sub-sectors of the structured product universe underperformed Treasuries, 2019 was a year when you were well-rewarded for taking risk. All sectors of the structured market outperformed similar maturity Treasuries some by the widest margins in years. Commercial mortgage backed securities (CMBS) were the best performing sub-sector far outpacing agency mortgage backed securities (RMBS) and asset backed securities (ABS). As we look to 2020, generating excess returns over Treasury benchmarks and other risk assets is going to be far more challenging as spreads have compressed to multi-year lows leaving risk priced at much less attractive levels. 

After trailing its Treasury benchmarks through much of 2019, RMBS had a stellar fourth quarter generating 63bps of excess returns, the highest annual excess return since 2013. Fed easing and an overall drop in volatility helped propel returns. We believe last year’s performance has left valuations in a relatively unattractive range and anticipate significantly lower returns in the coming year. In addition to poor valuations, the market must also contend with the significant supply generated from the runoff of the Federal Reserve’s $1.4 trillion mortgage portfolio. It’s anticipated that their portfolio will contribute $238 billion in new RMBS, representing over 80% of the forecast net new supply for the year. Given the poor technical positon of the market and tight spread to Treasuries, we will continue to underweight agency RMBS in our portfolios. 

Non-agency RMBS, however, remain an important component of our portfolios despite valuations being somewhat less compelling than prior years. Credit fundamentals in the sector still look very good, and since underwriting continues to be very conservative, we anticipate the sector outperforming agency RMBS and, to a lesser extent, Treasuries this year. Housing price appreciation should slow to roughly 3.0% from roughly 3.5% last year; however, we don’t anticipate that it will negatively impact the market. With the consumer being in such excellent financial shape due to low unemployment of 3.5% and wage growth of 2.9%. As a result, delinquency and default rates should remain at very low levels. If we have a concern about the sector it would be the relatively rapid prepayments experienced during the fourth quarter of last year. With mortgage rates stabilizing, we expect prepayments to slow relative to agency securities supporting non-agency valuations. 

Commercial real estate fundamentals remain in relatively good shape following multiple years of property price appreciation and domestic economic strength. Overall price levels for commercial properties increased in excess of 8% last year, lead by multifamily and industrial properties, and operating income increased on average by 3% or more. While CMBS was the best performing sector within structured products, they could not keep pace with A-rated corporate bonds which generated more than twice the excess return. In most years, senior conduit CMBS securities tend to track spreads on single A-rated corporate bonds fairly closely. We are anticipating heightened volatility within the corporate sector this coming year and expect CMBS will track corporate bond spreads but with less volatility. When combined with current valuation, we expect CMBS should modestly outperform both Treasuries and single A-rated corporate bonds. Our investment of choice within the sector continues to be conservatively underwritten single asset transactions with low leverage. With spread concessions to conduit securities of approximately 10-15bps, they represent better value at this time. As in prior years we remain concerned about the retail sector, particularly regional malls in less populated areas, which must be carefully analyzed in any conduit securitization.

ABS has been a consistent performer year in and year out, and we don’t envision 2020 being any different. Concerns have been raised about the overall level of consumer debt and the increase in delinquencies, particularly within the auto sector over the past year. Our view is that the consumer is in good shape financially. They continue to maintain healthy balance sheets due to strong job growth, and wage gains while the cost of servicing the growing debt burden is well within historical norms. Delinquencies are normalizing from low levels, returning to levels similar to those experienced well before the Financial Crisis and do not reflect the early stages of a consumer credit crisis. We’ll continue to maintain significant portfolio weightings relative to most benchmarks, particularly at the short end of the yield curve. High credit quality and stable cash flows make ABS an attractive alternative to short corporate credit, taxable municipals, and Treasuries. Our favorite sub-sectors continue to be prime and some select subprime auto, credit card, and equipment transactions.

Exhibit 6

Source: Real Capital Analytics, Wells Fargo Securities, CoStar

Municipal Market

Our outlook for the tax-exempt municipal sector is negative based on their very expensive valuation levels relative to the taxable fixed income sectors. After exceptionally strong performance to end 2019, municipal-to-Treasury ratios in 10-years started 2020 at 75%, which is 13.5 percentage points below the 5-year average. Additionally, on a tax-adjusted yield basis (21% corporate tax rate adjusted), 10-year tax-exempt yields are 19 basis points (bps) through maturity-matched Treasuries. We view both of these valuation metrics as considerable indicators of the overvalued condition for the sector and, in our view, warrant a significant underweight of the sector for 2020. 

Very favorable technicals have provided the major underpinning to the sector’s expensive valuations, and the Tax Cut and Jobs Act of 2017 (TCJA) has been one of the most influential events in exacerbating supply/demand imbalances within the sector since its passage in late 2017. On the supply side, the tax reform’s repeal of tax-exempt advance refundings of existing tax-exempt debt reduced overall tax-exempt issuance in 2019 by $54 billion relative to 2017, per data reported by the Bond Buyer. On the demand side, the TCJA’s imposition of a $10,000 cap on state and local tax (SALT) deductions increased the tax burden on wealthier investors in high-tax states. The higher tax burden, combined with already high marginal tax rates, resulted in an increase in the value of the tax-exemption. The ensuing demand for tax-advantaged assets culminated with a record of $95.5 billion in inflows into tax-exempt mutual funds during 2019, per Lipper Fund Flow data. 

We expect many of the drivers for tax-exempt valuation to largely remain in place during 2020, as the probability of any change in the tax code during the year is low given the current split legislative control of Congress. However, for insurance company portfolios, we believe that there are better alternatives in the taxable fixed income sectors, which would include taxable municipals. 

We have a more constructive view on the outlook for the taxable municipal sector primarily because of the sector’s significant yield advantage relative to tax-exempt bonds and absolute yield levels that are comparable to the other taxable sectors. When comparing yields of similarly rated taxable municipals to that of tax-exempt bond yields (tax-adjusted at 21% corporate tax), taxable municipals provided compelling additional carry of 80 and 85 bps in 5 and 10-year maturities, respectively. Additionally, in those same maturities, ‘AAA’-rated taxable municipal yields were at comparable yield levels to ‘A’-rated industrial corporate bonds.

We believe that the relative attractiveness of the taxable municipal sector should largely be in place for most of 2020 due to the heavy amount of issuance that’s expected. Estimates from the broker/dealer community is for projected issuance of ~$115 billion, with the majority of this supply a direct result of taxable advance refundings of tax-exempt debt. The dramatic plunge in Treasury rates during 2019 (77bps in 10 years) has helped generate significant savings for refinancings, and issuers have been aggressively pursuing this type of issuance since August. As long as rates remain range bound around current levels, there should be ample opportunities to add exposure to this sector during 2020. 

From a fundamental perspective, we do not expect any headline risk to create selling pressure in the space, as we expect credit conditions to remain solid during the year. Income and property tax revenues have been growing at a solid rate during 2019 and are expected to continue going forward. That should bode well for solid fiscal performance for state and local governments. 

Exhibit 7: Tax-Exempt Relative Valuation Levels Remain Unattractive for Insurers

Source: Thomson Reuters Municipal Market Data, Bloomberg

Exhibit 8: Taxable Munis: Compelling Alternative to Tax-Exempts

Source: Thomson Reuters Municipal Market Data, Bloomberg
*Tax-exempt yields are grossed-up using a factor of 1.19968, which corresponds to a 21% corporate tax rate.

High Yield

2019 was a strong year for U.S. high yield overall. The sector benefited from stable fundamentals, an improved economic outlook, and strong technicals as the high yield market shrinks while the appetite for yield persists. Credit spreads tightened significantly during the year to levels nearing the five year low of +300. Total returns were 14.3% for the U.S. high yield broad market, with higher quality and longer duration segments outperforming as the BB-B-rated index returned 15.1% for the year while CCC-rated, and lower only returned 9.3%. Loans returned 9% in 2019 which significantly trailed bonds given their limited duration amid falling rates and slowing demand for the floating rate asset class.

Exhibit 9: Historical High Yield Credit Spreads (OAS)

Source: Bloomberg Barclays Index Series Data; ICE BofA BB-B Cash Pay (JUC4), and CCC & Lower (H0A3)

Fundamentally, leverage rose in 2019 but was limited to a few sectors, and interest coverage overall remains healthy. The twelve month U.S. speculative grade default rate increased modestly to 4.2% in 2019. However, it  remains below the long-term average of 4.9%. The outlook improves in 2020 as defaults are expected to decline modestly to a rate of 3.5%. In addition, ‘rising stars’ continue to outnumber ‘fallen angels.’ We believe investors should avoid the lowest quality credits as the bifurcation between the lowest and highest quality issuers is likely to continue. It’s imperative to actively manage credit risk to in this environment in order to minimize exposure to issuers and sectors that are likely to be pressured in periods of slower economic growth. 

Exhibit 10: Historical Global High Yield Fallen Angels and Rising Stars

Source: BofAML Global Research, Muzinich & Co; LTM – Last twelve months; Fallen Angels – investment grade ratings downgrade to below investment grade; Rising Stars – below investment grade ratings upgraded to investment grade

While valuations appear tight, further spread compression may be possible as we expect the strong technical backdrop to continue in 2020, with persistent demand for positive yielding credit in a world where negative yielding assets are abundant. Nevertheless, a large proportion of credit market performance in 2019 came from interest rate duration, which benefited from the fall in yields; a repeat performance in 2020 is unlikely. BB-B bond yields have fallen closer to 4.5%, while bank loans yields remain near 5.5%. We believe the relative value argument may be more balanced in favor of loans in 2020, as there is less to gain from long duration positioning and more focus on carry going forward.

Convertible Securities

The record setting rally in equity and credit markets fueled outstanding 2019 performance for balanced convertible investors. The Barclays Balanced Convertible Composite rallied 22.1% as an underlying equity advance of 32.8% pushed conversion values higher during the period. The asset class continues to benefit from its significant exposure to technology companies which represent approximately 35% of the U.S. convertible market as of 12/31/2019 and were the top performing subsector during the year. 

Exhibit 11: U.S. Convertibles and Underlying Equity Performance By Sector

Source: Bloomberg Barclays Indices
Total return values do not incorporate fees and other advisory expenses.

New issue supply in the convertible market has been robust, with nearly $60B of issuance during 2019 – the largest annual total since 2008. Increased supply coupled with reduced redemption activity led to an increase in notional convertibles outstanding in the U.S. market, a healthy indicator for those seeking balanced risk/reward structures. High equity prices, low rates, and reduced interest deductibility for high yield borrowers have been supportive of this increased deal flow, and AAM’s market outlook suggests another year of sizeable issuance. A number of U.S. and European banks have recently issued synthetic convertibles. This structure consists of the bank as the credit and a conversion feature into a different underlying equity. These sizeable investment grade issues are a welcome addition to the market, but the synthetic nature results in new issue pricing that is generally less attractive to traditional issuance and non-rated secondaries. 

The incredible momentum in technology and growth names during the rally has increased certain risks in the convertible market as a whole, which should favor active and disciplined portfolio managers if negative surprises emerge:

  • Equity sensitivity has increased with an average investment premium of 66% for the broad market indicating greater downside risk in a market decline
  • Continued technology issuance and rising share prices have increased concentration risks in the broad market
  • The broad market’s average rating has gradually declined to an estimated mid/low BB

Diversified portfolios of balanced convertible securities offer a unique value proposition that falls in the favor of investors: better upside participation relative to downside risk exposure. Through market cycles, this asymmetry produced equity-like average returns with substantially reduced volatility relative to underlying stocks. We recognize that the post-crisis capital market environment of the past decade has lacked sustained downward movements. Only three of the past forty quarters have registered a negative S&P 500 total return. 

Our base case market outlook suggests a stable environment for risk investors in 2020, which should result in positive equity market returns and corresponding gains for convertible investors. In this environment, convertible returns will likely exceed fixed income but trail direct equity returns. Should negative surprises occur, diversified and balanced convertible strategies will dramatically outperform equities and likely broad convertible indices. We will remain patient and disciplined in our approach, continuing to harvest gains where appropriate and using new issue supply to maintain the asymmetry that we desire.

December 12, 2019 by

National Lampoon’s holiday sales summary

The holiday season continues to be a critical time of the year for retailers as some can earn up to 40% of their annual revenues during this period. Based on adjusted figures from the U.S. Census Bureau, retail sales (excluding auto and gas) for holiday 2018 were up 2.3%. This was the lowest growth rate since the 2008/2009 recession. In 2008, holiday sales were down 4.1% while 2009 improved to positive 0.1%.

The holiday disappointment in 2018 was caused by the government shutdown and significant stock market weakness related to volatility surrounding trade/tariff headlines. Our prediction of around 4% for 2019 is significantly better. The following report explores some of the key components of our analysis.

The consumer is stronger than the abominable snowman

We believe the most important driver of retail sales directly ties to consumer confidence. The table in Exhibit 1 summarizes our analysis of nine factors that contribute to that level of confidence measured year over year.

Exhibit 1

Source: Bloomberg, AAM

In 2018 statistics were good, and this year’s look slightly better. Based on the year-over-year analysis, it appears that several of these factors are close to peak levels. Even though we have not seen substantial improvement versus last year, we still consider the numbers to reflect a very healthy consumer. This part of the analysis should help support a strong holiday spending season.

Professor Hinkle is back in school – but is he on the nice list?

A review of data from the last twenty years (see Exhibit 2) reveals a significant correlation (77%) between “Back to School” retail sales (as measured in August and September) and holiday sales (as measured in November and December.) To model the trend, we use the U.S. Census Bureau’s adjusted monthly retail trade data which includes a variety of retail businesses (excluding motor vehicle and parts dealers and gasoline stations; sales in those segments have been more heavily impacted by factors outside the control of consumers).

Exhibit 2

Source: U.S. Census Bureau

Our regression model predicts adjusted holiday sales of 4.3% when using the 4.6% actual for “Back to School” sales in 2019. This is above the 20 year average of 3.7%. Comparatively, 2018 “Back to School” sales of 4.1% led to actual holiday sales of 2.3%. Clearly the model did not accurately predict holiday sales last year. However, it should be noted that most of the weakness last year came in December when the markets experienced heightened volatility related to the talk of trade wars, the government shutdown, and a severe equity market selloff.

Santa needs more elves for his workshop

Overall, holiday related hiring is projected to be mixed this year. In many cases a lower rate of hiring in brick and mortar is offset by a greater need for employees to support e-commerce sales. It’s difficult to draw major conclusions from these numbers given the struggle to hire part time workers due to current low unemployment and efforts to pay existing employees a higher wage. Some retailers, including Walmart, will give current employees the opportunity to work holidays instead of hiring seasonal workers.

According to the National Retail Federation (NRF), temporary hiring will range between 530,000-590,000 which is comparable to last year’s 554,000. As shown in Exhibit 3, Kohl’s is the only retailer who plans to add more seasonal jobs this holiday season.

Exhibit 3

Source: Company press releases, Morgan Stanley Research

Deck the halls with tariffs for all

The second wave of tariffs is expected to begin on December 15th. This is in addition to new tariffs that began on September 1st , which included traditional holiday items such as TVs and apparel. We would expect the direct impact on consumer spending to be limited as we believe price increases during the holiday will be very limited. Nonetheless, 79% of consumers surveyed for NRF in September were concerned that tariffs will cause prices to rise, potentially affecting their approach to shopping. Shoppers expect a good deal and know when and where to make the best value purchase. For the most part, this is expected to be a “company” problem not a “consumer” problem. That could change in 2020 if tariffs remain in place and/or become more onerous.

There could be a secondary impact on spending from ongoing trade talks and tariffs. Large retailers have been diversifying their supply chains. It’s possible we will see disruption on that front which could cause less product to make it to the shelves, diminishing demand. In addition, negative headlines related to trade could create market volatility, leading to uncertainty and lower holiday spending.

Kris Kringle or Cyber Santa?

Online sales continue to grow at a double digit rate, which help retailers maintain overall business as foot traffic to brick and mortar locations continues to decline. Another positive is that weather has become less of a factor for retail results as online sales become easier and more popular across demographics. According to the U.S. Census Bureau, e-commerce now accounts for 12.5% of total retail sales year-to-date. We believe that figure is above 20% if one excludes segments that are not currently at significant risk of an internet presence such as auto sales, restaurant/bar sales, and gas station sales. Through October growth for the online category was 12.7%. That’s almost four times the 3.2% growth of total retail sales year-to-date.

Exhibit 4 illustrates the power of just one of the many trends developing in e-commerce. The graph below shows the opportunity to grow online sales in the discounted space led by Walmart and Target. Both of these companies have tremendous resources and initiative to compete in the space. Their growth is ramping up at the expense of Amazon and eBay. The ability to shop online and pick up your item at your local Target or Walmart has become extremely popular. With several thousand stores spread across the U.S. these retailers have a significant advantage.

Exhibit 4

Source: B of A, Merrill Lynch

Several sources have reported successful Thanksgiving and Black Friday shopping results. According to Adobe Analytics, online sales (desktop & mobile) of $11.6 billion were up 17% over last year. That compares to 25% growth for 2018. Sales completed on smartphones continue to be the largest driver of e-commerce with smartphone sales accounting for 41% of online sales versus 31% last year. According to ShopperTrak, visits to stores over the two day period fell 3% with a 6% drop on Black Friday. Black Friday results were slightly weaker given heavy promotion in the beginning of Thanksgiving week and an earlier start to holiday shopping given lower than usual available shopping days until Christmas.

Dasher, Dancer, and Prancer agree that Santa will be busy

We have included a summary of three trade groups that publish their views on upcoming holiday sales. While each of them use a different data set to support their expectations, it is still important to note the growth year-over-year. In addition, we thought it would be interesting to look at how accurate each group has been over the past four years. Based on this data, we would not favor any one of these trade group’s prediction over the other. Also, it’s clear they all were too optimistic last year as was the majority of the Wall Street analyst community.

Exhibit 5

Source: AAM

According to a survey released by the National Retail Federation (NRF), shoppers will spend an average of $1,048 in 2019 for a total of approximately $728 billion. Shoppers plan to spend most of their time online and in department stores. For the 13th year in a row, the most popular present is expected to be gift cards. The most important factor when shopping at a particular retailer remains sales and discounts.

Walking in a not-so-wintery wonderland

Weather and the shifting calendar are always important factors for holiday spending. According to Weather Trends International (WTI), December is expected to be slightly cooler with temps averaging 37.4F. Average precipitation for December is expected to be down 26%. The ideal weather for traveling holiday shoppers is cold and dry. Retailers want shoppers to buy winter products but not be turned away by heavy snow.

Exhibit 6

Source: Weather Trends International

Exhibit 7

Source: Weather Trends International

A key statistic tied to the strength of holiday retail sales is the number of days between Thanksgiving and Christmas. The maximum number of days possible is 32 and the minimum is 26. Obviously, for retailers the more shopping days between Thanksgiving and Christmas the better. This year, the total shopping days is 26, the minimum, versus the maximum 32 from last year. In addition, there are eight total weekend days to shop which is the minimum, versus the 10 weekend days we had last year.

Tie it up with a bow

We are optimistic about 2019 holiday spending. Consumer confidence is high and consumers are ready to spend this holiday season. The key predictor of back-to-school sales was better than last year, and the retail sector continues to expand with the ease and efficiency of online shopping. While tariffs and trade talk continues to create volatility in the financial markets, consumers seem to dismiss the potential downside. Of course, this is easier to do with the stock market up 246% year-to-date and with limited price increases expected during the holiday season.

December 9, 2019 by

Official Press Release

Chicago, IL (December 9, 2019) – For the third year in a row, AAM Insurance Investment Management has been recognized as one of the 2019 Best Places to Work in Money Management as announced by Pensions & Investments today.

Presented by Pensions & Investments, the global news source of money management, eighth-annual survey and recognition program is dedicated to identifying and recognizing the best employers in the money management industry.

For over 35 years, AAM has strived to create a supportive work environment focused on rewarding employees and delivering exceptional customer service, while also giving back to the community. Key employee incentives include attractive compensation and bonus structures, generous benefits and PTO, and an employee ownership program that promotes longevity and partnership among members.

The company also encourages employees to give back to the community through programs coordinated with the United Way and other local organizations. Employees volunteer to work at a local foodbank, mentor students at an inner city high school and sponsor less fortunate families during the holidays.

“It is clear that intentional work being done to create workplaces with common goals, trust and community is more important,” said P&I Editor Amy B. Resnick. “This year’s winners stand out for their commitment to their people and the communities in which they operate.”

“I’ve worked at AAM for nearly 17 years,” remarked AAM Senior Portfolio Manager Dan Byrnes. “What makes working here so great is the people both externally and internally. Externally, I have had the opportunity work with clients over the years that are good people and challenge me to consistently do my best on their behalf. Internally, the culture of the firm aligns everyone’s priorities. We take seriously our responsibilities to our clients and strive to achieve our goals and theirs, but we also care about each others’ personal well-being outside of work.”

Camaraderie is built through participation in charitable projects as well as company-sponsored events to encourage team building. These include an annual golf outing referred to as the AAM Ryder Cup, Friday “Jeans” days for significant accomplishments, summer hours, pizza lunches, early close prior to holidays, yearly “Bring Your Kids to Work” days, and an annual holiday season party.

Pensions & Investments partnered with Best Companies Group, an independent research firm specializing in identifying great places to work, to conduct a two-part survey process of employers and their employees.

About AAM

Chicago-based AAM Insurance Investment Management is a registered investment advisor with the SEC founded in 1982 to provide insurance companies with expertise in insurance asset management and practical knowledge of the regulatory and competitive environment. AAM is dedicated to meeting insurance company needs, with expertise across asset classes. As of September 30, 2019, AAM manages $28.6 billion in assets for insurance company clients across all segments of the industry. The firm is owned by a group of AAM employees as well as by Minneapolis-based Securian Financial.
Visit us at www.aamcompany.com

About Pensions & Investments

Pensions & Investments, owned by Crain Communications Inc., is the 46-year-old global news source of money management. P&I is written for executives at defined benefit and defined contribution retirement plans, endowments, foundations and sovereign wealth funds, as well as those at investment management and other investment-related firms. Pensions & Investments provides timely and incisive coverage of events affecting the money management and retirement businesses. Visit us at www.pionline.com

September 20, 2019 by

This topic was originally published May 2017. This paper is an update of the ideas discussed in the prior version.

Ratio analysis is a cornerstone of financial analysis – and for good reason. In this age of algorithmic trading, Big Data-driven advertising, and machine learning programs teaching cars to drive themselves, it’s reassuring to consider just how much we can learn about a company by dividing one financial statement item by another and comparing the result to a peer group.

Many useful ratios exist for analyzing and comparing P&C insurer financials. In this update to our 2017 paper entitled “Deconstructing Risk”, we once again start with the proverbial “Bottom Line”: Return on Surplus. We will review how to decompose this measure into 4 subsidiary ratios to better identify the drivers of profitability. They are:

Underwriting profitability

Underwriting leverage

Investment profitability

Investment leverage

Two companies with similar profitability might look very different when broken down in this way. Below we will discuss the significance of each of these measures, and sum up by showing how at least some of them show notable correlation to an insurer’s AM Best Financial Strength Rating. 

Return on Surplus

Return on Surplus is calculated by dividing net income by average annual surplus. It’s the most common measure of insurer profitability, and makes for useful comparisons both across time and across companies. However, as a summary measure it tells us very little about how profits are being generated or the level of risk involved in a company’s strategy. We can learn much more by separating this measure into underwriting and investment components, and then further dividing each of those into profitability and leverage measures.

Underwriting

P&C insurer underwriting profitability is traditionally measured by the combined ratio, which is essentially [Underwriting Losses & Expenses] divided by [Net Premium Earned]. A value over 100 indicates a loss, below 100 indicates a profit, etc. For our purposes we translate this measure into a more universal profit margin measure by subtracting the combined ratio from 100, which amounts to [Underwriting Gain/Loss] divided by [Net Premium Earned]. We’ll coin a term and call this “Underwriting Margin”. Fundamentally, this measure encompasses pricing sufficiency, loss cost containment, and in some cases cat experience for a given year.

Next we need an underwriting leverage measure. Normally this would be measured as [Net Premium Written] divided by [Average Surplus], but for the sake of consistency across ratios we will instead use [Net Premium Earned] as the numerator, which in practice is usually very similar. As a leverage measure, this ratio acts as a kind of multiplier, magnifying or dampening the impact of underwriting profitability on surplus.

(that may sound technical, but think of it this way: if you write a large amount of premium relative to your available surplus, then the question of whether you generally make a profit or a loss on those premiums is going to have major positive or negative implications for your surplus. That’s the effect we’re measuring.)

Attentive readers will notice the card trick we’ve set up here. By multiplying our underwriting and profitability ratios together, the [Net Premium Earned] terms cancel out and we’re left with [Underwriting Gain/Loss] divided by [Average Surplus]. This is the contribution to Return on Surplus from underwriting operations. Astonishing, I know, but we’re only getting started.

Before moving on to investments, here’s a quick look at trends in profitability and leverage for P&C insurers in recent years. The tables below show median values for these statistics for a composite of 735 P&C companies that collectively make up a majority of the industry:

Exhibit 1

Source: AAM as of 12/31/2018.

Exhibit 2

Source: AAM as of 12/31/2018.

We see considerable variation in underwriting margin from year to year, as one would expect from an industry subject to not only normal competitive pressures and economic fluctuations, but also the volatility of annual storm and disaster experience. However, median underwriting leverage is considerably more stable (note the compression of the vertical axis), with the result that total underwriting contribution is mainly driven by swings in profit margin from year to year:

Exhibit 3

Source: AAM as of 12/31/2018.

Investments

The main invested assets held by P&C insurers include investment-grade bonds, common stocks, cash, and other asset classes. These provide income, dividends, and capital gains that frequently make up a major portion of a P&C company’s annual returns. As with underwriting, we can look at the investment contribution in terms of both profitability and leverage.

To measure profitability, we will once again use a somewhat novel term. While “investment yield” is a widespread concept that measures investment income over average assets for a period, we will instead conceive “investment margin” as the sum of all statutory investment returns over average assets. In other words this includes not just investment income, but also realized gains and the change in unrealized gains/losses on certain assets (like equity) that receive mark-to-market accounting treatment. This gives a more comprehensive view of the contribution of investments to the bottom line. This measure is likely to be fairly volatile from year to year given the effects of equity and other total return assets, but over time it gives the fullest picture of an insurer’s (or their asset manager’s) success at producing returns from invested assets.

Meanwhile our investment leverage measure takes average invested assets over average surplus (technically since these are both balance sheet measures we could just use point figures instead of averages, but we want our terms to agree across ratios). As with underwriting leverage, having a very large portfolio relative to your surplus will naturally magnify the impact of your portfolio return on surplus.

By now you see where this is going: if we multiply our profitability and leverage measures together, the [Average Invested Assets] terms cancel out and we get [Total Investment Return] divided by [Average Surplus], which is the investment contribution to Return on Surplus. It’s all fitting together like a fine Swiss watch.

How do these investment measures look for the P&C industry over time? Let’s take a look:

Exhibit 4

Source: AAM as of 12/31/2018.

Exhibit 5

Source: AAM as of 12/31/2018.

Once again we see that the variation is mostly on the profitability side, with annual equity market returns a major wild card (cf. 2017 vs. 2018 returns). Meanwhile balance sheet leverage has remained fairly steady. Here is the resulting contribution to surplus from investments:

Exhibit 6

Source: AAM as of 12/31/2018.

Return on Surplus (Again)

So putting it all together, we just add the two contributions together to get total Return on Surplus:

Exhibit 7

Source: AAM as of 12/31/2018.

That’s impressively stable over time, and a good illustration of how uncorrelated investment and underwriting returns help diversify the P&C insurance industry’s results and smooth out performance.

(An important caveat: the above figures likely differ from other reports you may have seen touching on P&C industry profitability. The framework above excludes certain discretionary and non-operating items such as Policyholder Dividends, Other Income/Expense, and taxes. It also includes the mark-to-market surplus impact of equity, which is a legitimate statutory item but is not a component of Net Income.)

Application to AM Best Rating

AM Best Financial Strength Ratings are based on a company’s BCAR score and analyst evaluations of Operating Performance, Business Profile, and other factors. We can find confirmation in both the validity of our ratio analysis framework above, and the rigor of AM Best’s review process, by illustrating the correlation of most of these measures to ratings categories:

Exhibit 8

Source: AAM as of 12/31/2018.

(the above figures were calculated by taking a collection of 228 rated P&C insurers, determining the 3yr trailing average for each statistic as of 12/31/18, and then taking the median of those values for each ratings category.)

There’s a clear trend of higher ratings correlating with higher underwriting profitability, higher investment profitability, and lower investment leverage (i.e. higher capitalization). With the exception of the (very small) A+ category, higher ratings also align with lower underwriting leverage. This should come as no surprise; again, two of the key building blocks of a rating are Operating Performance and Balance Sheet Strength, so it’s natural that high profitability and low leverage lead to higher ratings.

Looking at things this way can help an insurer compare whether their own metrics “look like” their current or desired ratings peers, and potentially identify if they are at risk for downgrade (or upgrade).

Final Takeaways

By splitting Return on Surplus into the two separate sources of return and leverage, we gain a clearer picture of the structure of an insurer’s earnings. The profitability measures (Underwriting Margin and Investment Margin) illustrate the effectiveness of the company’s underwriting and investment strategies at producing competitive returns, and the leverage measures (Underwriting Leverage and Investment Leverage) indicate how aggressive they are in terms of taking on underwriting & investment risk relative to available surplus.

Observing the trends in these measures over time can give us insight into an insurer’s strategic direction, and help managers evaluate how well they’re executing on their intended strategic priorities.

At AAM, we make it a priority to understand our clients’ unique needs and strategic goals. To gain a deeper perspective on how these ratios can help support your strategic planning, visit www.aamcompany.com/contact-us for a custom analysis.

  • « Go to Previous Page
  • Page 1
  • Page 2
  • Page 3
  • Page 4
  • Interim pages omitted …
  • Page 10
  • Go to Next Page »

Get updates in your inbox.

  • Investment Strategies
    • Investment Grade Fixed Income
    • Specialty Asset Classes
  • Our Clients
    • Client Experience
    • Sample RFP Download
  • Insights
    • Video
    • Webinar
    • News
    • Podcasts
  • About
    • Our Team
    • Contact
    • Client Login

Disclaimer: Asset Allocation & Management Company, LLC (AAM) is an investment adviser registered with the Securities and Exchange Commission, specializing in fixed-income asset management services for insurance companies. Registration does not imply a certain level of skill or training. This information was developed using publicly available information, internally developed data and outside sources believed to be reliable. While all reasonable care has been taken to ensure that the facts stated and the opinions given are accurate, complete and reasonable, liability is expressly disclaimed by AAM and any affiliates (collectively known as “AAM”), and their representative officers and employees. This report has been prepared for informational purposes only and does not purport to represent a complete analysis of any security, company or industry discussed. Any opinions and/or recommendations expressed are subject to change without notice and should be considered only as part of a diversified portfolio. A complete list of investment recommendations made during the past year is available upon request. Past performance is not an indication of future returns. This information is distributed to recipients including AAM, any of which may have acted on the basis of the information, or may have an ownership interest in securities to which the information relates. It may also be distributed to clients of AAM, as well as to other recipients with whom no such client relationship exists. Providing this information does not, in and of itself, constitute a recommendation by AAM, nor does it imply that the purchase or sale of any security is suitable for the recipient. Investing in the bond market is subject to certain risks including market, interest-rate, issuer, credit, inflation, liquidity, valuation, volatility, prepayment and extension. No part of this material may be reproduced in any form, or referred to in any other publication, without express written permission. *All figures shown are approximate and subject to change from quarter to quarter. **The accolades and awards highlighted herein are not statements of any advisory client and do not describe any experience with or endorsement of AAM as an investment adviser by any such client.

Copyright © 2024 AAM | Privacy and Disclosures

  • LinkedIn
  • YouTube