• Skip to primary navigation
  • Skip to main content
  • Skip to footer
AAM CompanyTransparent Logo

AAM Company

AAM Company Website

  • Investment Strategies
    • Investment Grade Fixed Income
    • Specialty Asset Classes
  • Clients
    • Our Clients
    • Client Experience
    • Download Sample RFP
  • Insights
    • Video
    • Webinars
    • Podcasts
    • News
  • About
    • Our Team
    • Events
  • Login
  • Contact Us
Contact

Featured

September 12, 2019 by

We all know Warren Buffett as perhaps the most astute investor of our time. His success within the financial markets is legendary. But do you know what the Oracle of Omaha chose if he were stranded on a desert island and could pick only a single indicator to help him navigate through the financial markets? Rail traffic. This paper will examine the logic behind this unexpected and atypical perspective.

Why are railroads important?

The U.S. freight railroad system comprises about 140,000 miles of track and consists of hundreds of railroads. The largest are called “Class I” and include CSX, Norfolk Southern, and Burlington Northern Santa Fe (BNSF). Most of what you touch, eat, and interact with on a daily basis most likely, at one point or another, traveled on one of these railroads.

Exhibit 1

Source: Association of American Railroads as of June 2019

Railroads ship both raw materials used in the production of finished products as well as the finished products themselves. And rail supports a wide variety of industries including automotive, agriculture, energy, and construction. Shipping goods via rail is an attractive alternative for several reasons including economic efficiencies (rail can move one ton of freight more than 470 miles on one gallon of fuel), reliability, and access to international markets. Railroads account for about one-third of U.S. exports by volume. These industry characteristics make for an interesting way to gauge the pulse of the economy. 

The data

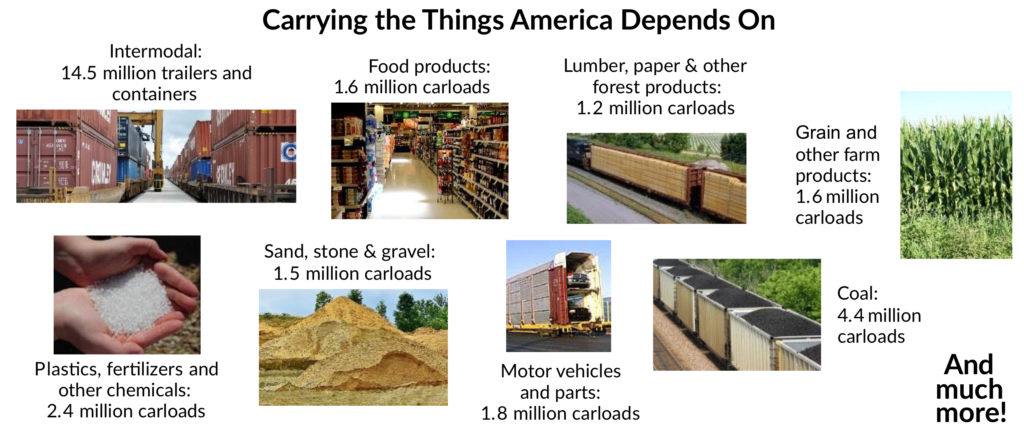
Rail traffic data is released weekly by the Association of American Railroads (AAR) and is broken down by number of railcars per each category including intermodal. Intermodal is defined as the long-haul movement of shipping containers and trailers by rail combined with a truck or ship at either end of the journey. The following is a snapshot of the AAR report:

Exhibit 2

Source: Association of American Railroads

A breakdown of each category offers additional background on how each is viewed as an economic indicator: 

Chemicals (6%) – Consists mostly of industrial chemicals, plastics and synthetic fibers, and fertilizers. This category includes thousands of products and serves as a good proxy for general growth especially in manufacturing. 

Coal (15%) – About 8% of U.S. coal is exported, double from 2017. Low natural gas prices and advanced renewables are replacing coal as a source of generation for electricity, which means it is less reliable as an economic indicator

Farm Products (3%) – Includes feed for livestock and a very wide variety of food for human consumption. Refrigerated rail cars have come a long way in moving perishable products to rail and away from trucks.

Forest Products (2%) – Consists of lumber and paper products. Transport of lumber is highly correlated to housing starts, a key economic indicator.

Grain (4%) – The United States is the world’s largest grain producer. The market is somewhat unpredictable given difficulty in forecasting crop size due in part to weather and soil conditions.

Metallic Ores (4%) – Includes iron ore, steel scrap, and coke. Impacted by the health of the steel industry and manufacturing (i.e., appliances).

Motor Vehicles (3%) – Rails are involved in several stages of the auto production process including materials for steel, parts, and finished vehicles. A single train can move 750 vehicles at once.

Nonmetallic Minerals (7%) – Includes materials for a wide variety of construction projects including crushed stone, sand, and gravel. Analysts estimate that about 80% of crushed stone is used as a construction material mostly for road construction.

Petroleum (2%) – Crude oil volume for rail is impacted by pipeline capacity and oil prices. Domestic production in shale oil, especially in North Dakota and Texas has created opportunities for the rail industry.

Intermodal (51%) – Rail has invested a tremendous amount of resources into this business. Customers can move twice the freight for the same price paid 30 years ago. Intermodal has helped address the difficulty of hiring long haul truckers. In addition, this segment has a large international component. 

Is this a good indicator?

We recognize for an indicator to be reliable, it needs to be statistically credible. We analyzed the different subsets of the rail carloading data to measure their significance as a predictor of economic data points, including GDP growth. We found that the best combination was total traffic, excluding grain and coal. We removed grain and coal because volumes in those categories often change based on factors outside the scope of economic growth. For example, coal volumes change based on the price of natural gas and grain volumes can be severely impacted by unexpected weather patterns. 

Using data going back to 1997, we find a correlation of 66%; R squared of 43% and a statistically significant relationship as noted by the t stat. Given this data we characterize the relationship as having a relatively strong correlation. 

The exhibit below illustrates the relationship of the two variables, which is helpful since GDP data is released with more of a time lag than the railcar loading data.

Exhibit 3: Rail carloading growth vs. GDP growth (Y/Y)

Source: Bloomberg, AAM, Association of American Railroads as of 6-30-2019

Future trends

At this point in the third quarter we have nine data points (Note: each quarter has a total of 13). So far, railcar loadings QTD are down 4.3% compared to last year. If the trend continues for the remainder of the quarter, the change year over year would look similar to 2Q19 which was down 4.5%. Based on our analysis, we would expect GDP to trend lower or stabilize around 2.0%. Currently, the estimate for Year over Year growth for 3Q19 GDP is +2.1%, and for 4Q19 GDP is +2.2%. Economists seem to agree!

Exhibit 4: Rail carloading growth vs. GDP growth (Y/Y)

Source: Bloomberg, AAM, Association of American Railroads as of 8/31/2019

Will we see the impact of the “trade war” in rail traffic?

The quick and easy answer to that question is, yes. The US/China trade dispute continues to evolve and freight railroads play a very important role in international trade. The Association of American Railroads estimates that at least 42% of the carloads and intermodal units railroads carry are directly associated with international trade. In addition, 35% of rail revenue is accounted for by international trade. Of that amount about 36% was from intermodal containers with the remainder from other carload traffic. 

On August 1st, the office of the US Trade Representative announced a new round of additional tariffs. The proposed “List 4” tariffs are more retail and consumer oriented. The effective date of September 1st for this third phase of tariffs gave companies little opportunity (one month) to stock up on Chinese goods before prices increased. Therefore we would not expect to see a “pull ahead” of ordered goods like we did at the end of 2018 when the timeline was not as compressed. That said, we expect car loadings to be impacted by negative sentiment, lower import/export volume, and permanent supply chain reorganization. The exhibit below shows the estimated cost of the tariffs per household as estimated by JP Morgan. We would expect the impact to the consumer to come through in the weekly rail traffic numbers and eventually impact GDP.

Exhibit 5: Estimated Cost of Tariffs on Households

Source: JP Morgan as of 8-23-2019

Summary

Rail traffic may not have been at the top of your list of indicators, but, given its statistical relevance, we believe it deserves some attention when forming a strategic opinion on the economy. It’s interesting to note that not so long after that comment from Warren Buffett, Berkshire Hathaway purchased Burlington Northern Santa Fe for about $44 billion (February of 2010). Talk about putting your money where your mouth is!

August 20, 2019 by

Given the persistent low interest rate environment, investment managers require flexibility to employ strategies that maximize a portfolio’s income within the constraints of their clients’ mandates. A segment of the market that is often overly constrained is 144A private placement issues. While not all investors are qualified to purchase 144A issues, the expanded opportunity set in these issues makes a compelling case for increasing 144A limits for those that do. 

What are 144A securities?

When a bond issuer offers a security to the investing public, the Securities Act of 1933 requires that the issuer register the bonds with the Securities and Exchange Commission (SEC). This process entails extensive documentation, review, and recurring disclosures. However, there is an exception for bonds issued under Rule 144A, which allows privately placed securities to be sold and traded to Qualified Institutional Buyers (QIBs) without SEC registration. QIBs are defined as institutions (not individuals), deemed to be an “accredited investor” under Rule 501 of the SEC’s Regulation D. To qualify as a QIB under Rule 144A, an insurance company must have a minimum of $100 million in unaffiliated invested assets on a discretionary basis. The exception for QIBs is made because they are viewed as having more resources and access to information versus smaller institutions. As such, it is inferred that they can make sound investment decisions despite potentially having less information and ongoing required reporting provided by securities registered with the SEC.

144A securities can be issued with or without registration rights. For those issued with registration rights, the issuer hasn’t filed for registration with the SEC but intends to do so within a specified time period after issuance. Once they are registered, the 144A securities are subsequently exchanged for newly created public securities. For those issued without registration rights, the securities will remain unregistered until maturity.

What are the benefits for an issuer of 144A securities?

From an issuer’s perspective, there are a number of advantages to issue bonds under Rule 144A. First, there is no required public disclosure of sensitive information, no SEC review process, and ongoing reporting requirements are reduced. Second, 144A issuance decreases the potential for liability under the Securities Act. Third, issuers can access the market more quickly since the process of registering a bond with the SEC can delay the timing of an issue. Finally, the issuers’ costs are lower as they are able to forgo pre-issuance registration, significant underwriting fees, and ongoing reporting post-issuance.

What are the benefits of buying 144A securities for QIBs?

With the advantages to the issuer being fairly straight forward, the primary benefit to the investor is access to a greater supply of bonds. Over the past decade, the amount of 144A issuance has accelerated at a much faster rate than public bonds. The outstanding issuance of investment grade 144A (excluding structured sectors: asset backed securities, commercial mortgage backed securities, and non-agency residential mortgage securities) since 12/31/08 has increased from $341B to $1,637B (380% growth) versus the Barclays Aggregate increase of $11,430B to $20,836B (82% growth). 

In the structured sectors, the growth of 144A issuance since the financial crisis has been even more pronounced. In the Asset Backed and Commercial Mortgage Backed Sectors, over half of the bonds in 2018 were issued under Rule 144A (Exhibit 1). In the Non-Agency Residential Mortgage Backed Sector, almost all of the securitizations in the past few years have been issued under Rule 144A. 

Exhibit 1

Source: J.P. Morgan, Bloomberg

A greater supply of bonds is the primary benefit of 144A issues to investors, but it’s not the only one. Underwriters of 144A structured securities typically provide more granular loan level data, which isn’t made available for public issues. This feature allows investment management research teams to better understand the characteristics of the underlying collateral, model cash flows, and predict deal performance.

While some 144A issues may offer a yield benefit, increasing the limit on 144A issued securities is not necessarily a yield enhancement strategy. In an acknowledgement from the market that public issues versus 144A are nearly identical, there is very little or no yield premium for a given issuer whether they come with a 144A versus a public transaction. Increasing 144A limits is really about expanding the opportunity set, particularly in the ABS, CMBS, and Non-Agency RMBS sectors. For example, the entire single property CMBS market and nearly the entire ABS market outside of prime auto deals and credit card transactions are 144A. 

Given the pool of potential investors in 144A is limited to those with QIB status, it would be reasonable to assume that 144A issues are less liquid than public bonds. However, liquidity for both fully registered and 144A securities is impacted primarily by the specific issue characteristics which include issue size and credit quality. Bid side indications for similar tenor public and 144A bonds are generally the same. An example is shown in exhibit 2.

Exhibit 2

Source: Bloomberg, AAM

Conclusion

As 144A private placements become a larger component of the bond market, they warrant consideration as a greater percentage of portfolios for QIB investors. Constraining 144A to a small percentage of a portfolios’ holdings is an outdated restriction in today’s market, limits the investment options for managers, and doesn’t necessarily reduce a portfolio’s risk profile. If your investment guidelines have restrictions on the exposure to 144A issues, ask your investment manager about whether increasing those limits would benefit your portfolio’s diversification and opportunity set. 

July 8, 2019 by

What makes employee retention so buzzworthy?

Millennials are known for many things – their love of avocado toast, an inability to read a paper map, and, albeit stereotypically, job-hopping. Millennials  [those born between 1981 – 1996 as defined by The Pew Research Center] already make up the largest segment in the workforce, and it’s anticipated this buzzworthy generation will account for 50% of U.S. employees in the next two years according to a 2018 Dynamic Force report. While some praise millennials for their innovative thinking and passion, others label them as privileged and unable to commit to an employer – a point of anxiety for any HR manager. With millennials at the forefront of many workplace trends and hiring decisions, the subject  of employee retention and stability is a hot topic in today’s workplace.

In the [active] asset management industry, one would argue that stability is a characteristic of even greater importance. With all of the modern tools and quantitative models in the industry, the people who comprise an organization truly differentiates it. Individuals with years of niche industry expertise are able to utilize any reporting software or data-driven capabilities to their greatest potential. 

Additionally, a consistent portfolio management team is able to learn the intricacies of a client’s business – their strengths, weaknesses, risk-appetite, state regulations, etc. With this knowledge, the portfolio management team is able to create a customized portfolio and best manage a client’s money in order to assist them in achieving their company-specific goals. 

Investment managers should care about more than returns

When discussing manager success, standard measures include statistics such as returns. However, as a key determinant of asset manager health and therefore client outcomes, stability needs to be included in the discussion.  In January 2018, median employee tenure as stated by the U.S. Bureau of Labor Statistics was 4.3 years. Comparatively, AAM’s median investment professional tenure is an impressive 16 years, with AAM portfolio managers specifically boasting an 18 year median tenure.

Exhibit 1: Employee Tenure

Source: AAM, United States Bureau of Labor Statistics. AAM statistics are based on a workforce of 50 employees in 2018.

According to an article on North American employee turnover by Mercer LLC, the average turnover rate was 22% for 2018. It should be noted that this number accounts for total separations, including voluntary turnover, involuntary turnover, and retirement. By the same criteria, AAM’s turnover rate for investment professionals was 0% last year. Expanded to the range of 2015 – 2018, the turnover rate increased to a mere 4%. 

Exhibit 2: Turnover Rate (2018)

Source: AAM, Mercer LLC. Mercer statistics are based on 200+ American and Canadian organizations who participated in the most recent North America Mercer Turnover Survey.  AAM statistics are based on a workforce of 50 employees in 2018.

Exhibit 3: Turnover Rate: (2015 – 2018)

Source: AAM, Statista, Mercer LLC. Mercer statistics are based on 200+ American and Canadian organizations who participated in the most recent North America Mercer Turnover Survey.  AAM statistics are based on a workforce of 50 employees in 2018.

The high annual turnover rate last year is part of an overall trend – employee retention has been getting increasingly more difficult. While a number of causes can be attributed, according to a 2018 article from Decision Wise, primary reasons include the strong economy, a changing workforce, technology, and side incomes that for many have turned into full-time gigs. The most tangible example of these four reasons is the strength of the U.S. economy. 

The relationship between unemployment and turnover

The past decade has seen a drastic turnaround for both employee retention and unemployment. As the U.S. Bureau of Labor Statistics reports, unemployment hit a whopping 10.0% in October 2009. Nearly a decade later, unemployment was reported at a steady 3.8% in May 2018, the lowest percentage the United States had seen since the 1960s. While the stock market crash of 2008 resulted in high turnover rates due to the inclusion of involuntary turnover, voluntary turnover rates dropped to 10.4% according to Compensation Force. Comparatively, as stated by the aforementioned Mercer article, voluntary turnover accounted for 16.0% of total separations in 2018. 

Exhibit 4: Unemployment Rate vs. Turnover Rate (October 2009/May 2018)

Source: United States Bureau of Labor Statistics, Compensation Force

The current employment climate has shifted the pressure from employees to employers. Combined with the previously discussed changing workforce and technology advances, many employers have been struggling to determine the most effective methods to retain employees.

The true cost of turnover

Off-the-shelf estimates are available, which might set the cost of an entry-level position turning over at 50 percent of salary; mid-level at 125 percent of salary; and senior executive over 200 percent of salary according to Forbes. While precise costs remain impossible to calculate, these numbers ought to be staggering to any manager or executive.

Making up these estimates is the obvious HR cost, the cost of training any new employees, and reduced new-employee productivity during their adjustment period. Additionally, other employees are unable to complete their standard responsibilities while training any new colleagues, not to mention the added tasks they may need to accomplish to an already set workload if there is a gap between a former employee departing and their replacement starting. It can be tempting to cut corners during this training period due to the hassle, stress, and cost, but if new employees are not properly transitioned, statistically they are more likely to leave sooner resulting in a vicious turnover cycle. 

Stereotypically, millennials are attracted to companies with kegs in the breakroom and casual dress-codes – but studies and reports prove otherwise. While every employee desires fair and competitive compensation and culture fit certainly matters, things such as work-life balance, health and retirement benefits, and growth opportunities both through additional education and within the company are top priorities for today’s workforce for everyone from baby boomers to Gen-Zers. And in an environment where social issues have been integrated into every facet of life, diversity and environmental awareness should also remain on managers’ radars.

AAM understands insurance – and employee retention

AAM knows our strength begins with people that make up our organization, which is why we have built a culture of transparency, growth, and respect. With around 50 employees, we currently have 19 Principals who own approximately 30% of the equity of AAM. This ownership percentage has been virtually constant for over a decade. We are committed to expanding the number of owners while at the same time maintaining the performance and commitment requirements for becoming a Principal.

Growth at AAM stems from both internal advancement and education opportunities. Annual reviews focus on both employee performance and goals, and employee transfers between departments are a viable option should that fall in line with employee career aspirations. Most of AAM’s Portfolio Managers started as Assistant Portfolio Managers, allowing them to gain a deeper expertise of our process and philosophy as well as familiarity with clients. Additionally, education through CFA Charterholder designation as well as obtaining an MBA is encouraged at AAM. We currently employ 19 CFA Charterholders and 14 individuals who have earned MBAs, and we anticipate that number to increase in the near future.

Additional points of view and a diversity of experiences and backgrounds strengthen any organization, including AAM. Successful investing necessarily involves considering and evaluating differing ideas. By definition, some ideas are better than others and the evaluation of investment ideas is measured only with the benefit of hindsight.  Our employees must be free to identify ideas and suggestions in an environment of mutual respect in order to keep the idea pipeline open and flowing freely.

In conclusion, stability matters, but, further than that, people matter. At AAM, we have held strong to this belief for years, resulting in numbers that showcase both high performance and high employee retention. We look forward to continued growth and excellent client service in the years to come.

Special thanks to Marketing and Business Development Analyst Sarah Bujold for contributions on this paper.

June 14, 2019 by

Summary

The upcoming G20 summit beginning June 28th is a critical date for the investment community. What will happen if there is no trade agreement between the United States and China? Will the Fed lower rates in anticipation of that outcome or if disappointing, in reaction to it? As written in our last quarterly Corporate Credit Review, the bond market seems to have taken a much more negative stance than the equity market on the economy. And, unlike the start of the year when most Wall Street firms had fairly similar outlooks for the year, now they differ on what the Federal Reserve will do and the outcome regarding tariffs on Chinese goods. This type of market provides opportunities. AAM believes the probability of reaching a deal has increased modestly after the quick resolution with Mexico, but that probability is more remote than is a hardened stance. That expectation leads us to take a more defensive position in risk assets, preferring less cyclical sectors and higher quality credits. 

What happened to the deal the markets expected in April?

By May, the markets were pricing in a high likelihood of a deal with China in regards to tariffs. There are a multitude of reasons as to why progress was halted, including the possibility that the U.S. administration was employing a “hard-bargaining” negotiation strategy which meant the likelihood of an agreement was always lower than the market grew to believe. This may have been the strategy with Mexico, although that outcome was much easier to predict given the extreme downside risks. 

We do not believe China can yield to the demands the U.S. is making as it would be politically unpalatable. The breakdown of talks occurred due in part to the U.S. administration’s insistence that Chinese curb subsidies to its state-owned enterprises in strategic sectors, like technology. China finds this unacceptable given its ‘Made in China 2025’ strategy. For China’s economy to continue to grow, its manufacturing has to evolve to higher value added products and services and manufacturing capabilities. The insistence by the U.S. administration that enforcement of the deal would come in the form of changes in China’s laws and oversight mechanisms not just through regulatory changes represented a direct challenge to China’s state control model laid out in the 2025 strategy. And, existing tariffs would not be lifted until enforcement of the trade deal was verified. Political stakes are high, and both leaders feel the need to remain strong in these negotiations. 

Now what?

We look at possible outcomes through a three outcome framework: 

Source: AAM Corporate Credit team with OAS referring to Bloomberg Barclays Corporate Index.

1. The status quo remains for the duration of the year and most likely, until the next U.S. presidential election. 

2. Tensions increase with both countries increasing tariffs and imposing other restrictive measures. The temporary general license issued by the U.S. government suspending the ban against selling equipment and software to Huawei is not extended. 

3. Significant progress is made during the G20 summit followed by a trade deal that works to ends hostilities between the two countries and starts to lift at least some of the tariffs. 

While direct costs seem to be relatively easy to calculate for the current level of tariffs and are relatively modest (e.g., less than 0.3 percentage points off U.S. and China’s growth respectively), the more difficult calculation is related to the uncertainty and loss of confidence by businesses and consumers. If the global economy is in fact oversupplied and is relying on credit growth to absorb this excess supply, a loss of confidence that impacts investment and spending would be particularly threatening to global and U.S. GDP. Therefore, despite tariffs being viewed as inflationary, the impact would over the longer term, be in fact deflationary. An escalation of the “trade war” would be very costly in the form of economic growth and financial costs, resulting in falling Treasury yields and equity markets. We would expect spreads to widen materially as the risk of recession increases. In particular, underperformance is expected from long duration, low BBB credits as well as cyclical and liquid sectors. 

AAM believes the status quo is the most likely outcome in 2019, as the costs related to tariffs are less than the political fallout that would likely occur for US President Trump and China President Xi Jinping if either concedes. Our expectation for a trade deal at the G20 summit getting done or foreshadowed is quite low since getting tough on China is one of few bipartisan issues in the U.S., making it difficult for the current administration to soften its stance unless the risk of recession increases more materially. Moreover, given this stance, we believe it is more likely that threats escalate as China’s President Xi, who faces no term limits, is unable to bend to US demands without facing significant pressure from the Chinese Communist party. Therefore, we are assigning a material probability to that outcome. 

The G20 summit at the end of the month may change these probabilities materially. The candlestick chart shows the IG corporate credit spread volatility that has occurred over just the last two years. Current spreads largely in the mid-points of their trading ranges reflect the uncertainty that exists in the various trade outcomes we have outlined with the potential for near term volatility being quite high. With relatively little dispersion (~40 bps), we prefer more defensive sectors with stable cash flows and exposure to the U.S. economy. In regards to the more cyclical and liquid sectors, we have a more defensive position from a duration and/or credit risk perspective. The Banking sector in particular has been more resilient than we would have expected given falling rates and growth expectations. We view sectors such as Communications as providing less value today given the trajectory of growth, required investments (capital and operating) and lack of financial flexibility.

Current OAS vs. Min/Max Range

Source: AAM, Bloomberg Barclays data from 10/06/2017-6/7/2019; Sector OAS derived using the average of A-/higher and BBB ratings and 10 year maturities; Horizontal bar denotes value as of 6/7/2019 with top and bottom of vertical bar representing max and min values respectively.

May 14, 2019 by

Industry transitions

The medical professional liability (MPL) industry has been going through a period of tightening margins, soft pricing, and decreasing investment yields as detailed in AAM Insurance Strategist Peter Wirtala’s AAM Insight published in February 2019. As these factors are pressuring profitability throughout the industry, there are ways to improve the investment income generated from the fixed income portfolio that could benefit MPL insurers. The industry owns an allocation to tax exempt municipal bonds that have become unattractive versus other taxable sectors after the tax law change in 2018.

Tax law change

As part of the Tax Cuts and Jobs Act that was passed at the end of 2017, the tax rate for corporations was lowered from 35% to 21%. This change reduced the after tax yield on tax exempt municipal securities, making them unattractive for insurance companies in relation to other taxable fixed income sectors. The largest buyers of the tax exempt municipal debt are retail investors. Since individual tax payers have a higher tax rate relative to corporations, they receive a larger tax advantage for owning tax exempt securities. Exhibit 1 shows the difference in tax adjusted yields for AAA rated tax exempt municipals for individuals and corporations.

Exhibit 1: Market Yield – Individuals vs. Corporations

*Tax Exempt Yields are grossed up to the taxable equivalent using a 1.1994 factor. **40.8% tax rate includes 37% federal tax rate and 3.8% Medicare surtax. Tax Exempt Yields are grossed up to taxable equivalent using a 1.68919 factor. Yields as of 4/31/2019. Source: AAM, Bloomberg, Thompson Reuters.

The new tax rate for corporations translates to tax adjusted yields that are lower than U.S. Treasury securities for maturities that are 20 years and shorter while the tax benefit at the highest tax bracket for individuals makes the sector attractive across the curve. 

MPL fixed income allocations

At the end of 2018, the MPL industry had an allocation of 20.6% to tax exempt municipal securities in their fixed income portfolios. Exhibit 2 details the investment grade fixed income allocations of the industry according to their year end statutory filings.

Exhibit 2: MPL Sector Breakdown

Source: S&P Global Market Intelligence, Bloomberg, Factset. Data as of 12/31/2018.

Given the current unattractive yields in tax exempt municipal bonds, the MPL industry would benefit by redeploying assets into high quality taxable sectors such as Asset Backed Securities (ABS), Commercial Mortgage Backed Securities (CMBS), and Corporate bonds, which provide a substantial yield advantage versus tax exempt securities today. If you dissect the tax exempt allocation of the MPL industry further, there is 4.5% of the fixed income portfolio that is under yielding U.S. Treasuries as of 04/30/2019. Exhibit 3 illustrates the yield advantage of 3-5 year AAA rated ABS and 5-10 year AAA rated CMBS versus similar tenor tax exempt securities.

Exhibit 3: Market Yield – ABS/CMBS vs. Tax Exempt Securities

Yields as of 4/30/2019. Source: AAM, Bloomberg, Thompson Reuters.

ABS and CMBS are high quality sectors that are under allocated in the MPL industry. Their yield advantage over tax exempt municipals offers a way to improve the income profile of the fixed income portfolio. As of 4/30/19, 3-5 year AAA rated ABS securities provide an additional 75-100 bps and 7-10 year CMBS provides 100+ bps of additional yield versus AAA tax exempt securities. There are other factors to consider, such as each company’s tax situation and the effect of realizing gains/losses from sales, but the MPL industry should be reviewing their tax exempt holdings due the unattractive nature of the sector today.

Conclusion

Lower corporate tax rates have reduced the benefit of tax exempt municipal bonds for insurance companies. With the challenging underwriting environment, MPL insurers can increase investment income by reviewing their allocation to tax exempt municipal bonds and reallocating to higher yielding taxable sectors.

May 1, 2019 by

A glimpse at investment manager performance results versus the Bloomberg Barclays U.S. Aggregate Index

The simplest way to evaluate an investment manager is to review past performance relative to a stated benchmark. Benchmark outperformance is the gold standard in investment management, but the amount of outperformance can differ greatly depending on manager philosophy and strategy. A blanket statement of outperformance alone cannot verify that one manager is superior to another. The level of outperformance relative to a benchmark is key to determining the top investment manager by performance results. Additionally, a survey of approximately 124 investment firms conducted by Investment Metrics, LLC tells us that a plain vanilla, passive fixed income strategy will produce outperformance over the Bloomberg Barclays U.S. Aggregate Index over a market cycle.

Ten-year data suggests that investment manager performance differs greatly upon active portfolio management strategies. The survey of manager performance, by Investment Metrics, LLC, is ranked by quartile versus the Bloomberg Barclays U.S. Aggregate Index in Exhibit 1. The U.S. Aggregate Index falls in the bottom quartile of managers over the last 3, 5, and 10 year time periods. Last year was the exception when the U.S. Aggregate Index was in the 3rd quartile after volatility returned to the markets and a flight to quality was observed. Both sector allocation decisions and yield enhancements play a major role in the variability of quartile outperformance versus the U.S. Aggregate Index.

Exhibit 1: Bloomberg Barclays U.S. Aggregate Returns vs. Peer Group – as of 3/31/2019

Source: eVestment. All rights reserved. Data as of 3/31/2019. Returns are gross of fees.
AAM Core Bond Composite includes 8 portfolios and $2,422 million in AUM.
Peer group based on IM U.S Broad Market Core Fixed Income (SA + CF) which includes 200 firms and 273 products.

The advantage of active sector selection and rotation

As presented in Exhibit 2, the Bloomberg Barclays U.S. Aggregate Index is inadequately diversified by investment grade sectors with U.S. Treasuries, MBS Passthroughs, and Investment Grade Corporate Bonds comprising over 90% of the index. The conservative allocation consists of a 39% weight to U.S. Treasuries, the worst performing fixed income sector over a 10 year period (Exhibit 3). MBS Passthroughs are the second largest allocation in Index (28%) and the third worst performing sector over the same time period. An active investment manager who opted to underweight U.S. Treasuries and MBS Passthroughs and overweight IG Corporate Bonds, Commercial Mortgage Backed Securities and Asset Backed Securities over the 10 year time period handily outperformed the U.S. Aggregate Index. The variability in quartile outperformance in the Investment Metrics, LLC survey can be determined by both the underweight and overweight given to each sector. Conversely, in periods of high volatility exhibited in late 2018, an overweight to U.S. Treasuries produced more favorable investment results than in periods of low volatility, causing the U.S. Aggregate Index to rise into the 3rd quartile over the 1 year period (Exhibit 1). Security selection and active sector rotation within the top performing, higher yielding fixed income sectors further differentiates the top quartile of managers from the bottom.

Exhibit 2: Bloomberg Barclays U.S. Aggregate Sector Allocation

Source: Bloomberg Barclays Live as of 12/31/2018

Exhibit 3: 10 Year Annualized Return

Source: Bloomberg Barclays Live as of 12/31/2018

Since the U.S. Aggregate Index falls in the bottom quartile of managers, a manager claiming outperformance versus the Index can fall in a range of the bottom quartile to the top quartile. Retaining a bottom quartile performance manager versus a top quartile manager will cost an investor on average approximately 200bps of annualized total return over a 10 year period, or roughly $2 million annually for a $100 million fixed income portfolio (Exhibit 4). The cumulative difference is more staggering at $21 million for the same $100 million portfolio over the 10 year period. The primary determinants of top quartile performance depends immensely on investment manager philosophy, active sector rotation, security selection, and duration management.

Exhibit 4: Bloomberg Barclays U.S. Aggregate Returns vs. Peer Group Averages

Source: Investment Metrics, LLC. All rights reserved. As of 12/31/2018.
Dollar difference calculated using $100 million portfolio market value.

At AAM, we recognize that insurance portfolios require a yield orientation within a risk-controlled framework that minimizes credit impairments and delivers a competitive total return over a market cycle. We seek to add value by identifying the best risk adjusted sectors and securities across the yield curve. Duration management is a key component of the investment process and portfolios are managed to a target duration as determined by the benchmark or the duration of liabilities. Implementing the strategy successfully results in proven competitive total returns over time as demonstrated in AAM’s top quartile performance relative to the peer group over the last 1, 3, 5, and 10 year periods (Exhibit 1). AAM’s Core Bond Composite is made up of 9 insurance client portfolios with assets totaling $2.4 billion, benchmarked to the Bloomberg Barclays U.S. Aggregate Index.

Investing for insurance companies is AAM’s sole organizational focus and our competitive advantage is our emphasis in utilizing a portfolio management and research team that is highly experienced and focused on avoiding negative credit events. The firm’s team of senior managers averages 28 years of investment industry experience, with the portfolio management team averaging 22 years of investment industry experience. Additionally, AAM’s size allows us to take advantage of market opportunities and find creative ways to add income to insurance portfolios. Many of these opportunities are too small to be considered by larger competitors; examples include certain Taxable Municipal Bonds, Community Bank Debt, Private Placements, and various niches within the Asset Backed, Commercial Mortgage Backed, Non-Agency and Residential Mortgage markets. Our nimble size also allows us to trade freely within sectors without impacting markets or individual credits.

Yield advantages will produce superior performance results

Using a yield orientation by identifying the best risk adjusted sectors and securities across the yield curve will result in an income advantage over the U.S. Aggregate Index and lead to greater total returns over time. Total return is defined as the sum of price return and income return, or fluctuations in market value and earned income on the underlying security. For example, the U.S. Treasury sector produced a yield of 2.6% as of year-end 2018, relative to the IG Corporate sector that produced a yield of 4.2% over the same period (Exhibit 5). If IG Corporate Bonds receive a 100% allocation versus U.S. Treasuries at 100%, the 1.6% yield differential will result in $1.6 million of additional income for a $100 million portfolio. Compounded income over time will lead to improved total return in the long run. When comparing multiple investment managers, the highest yielding manager will always have the best performance.

Exhibit 5: Yield to Worst for Taxable Sectors as of 12/31/2018

Source: Bloomberg Barclays Live as of 12/31/2018

The results of the Investment Metrics, LLC survey display that a mediocre manager can easily outperform the U.S. Aggregate Index. Investment manager outperformance cannot simply be measured on a stand alone basis and does not guarantee that an investor will experience the best investment results. The difference in top quartile and bottom quartile manager performance should always be analyzed. Investment philosophy and strategy will largely determine how an investment manager performs relative to an index and its peers. A portfolio better diversified by investment grade sectors compared to the U.S. Aggregate Index, coupled with a yield enhancement will beat the Index over the long run. A top tier performance manager will always have the largest yield advantage. The difference in selecting a passive manager versus an active manager could cost an investor thousands, or even millions of dollars year over year.

  • « Go to Previous Page
  • Page 1
  • Page 2
  • Page 3
  • Page 4
  • Page 5
  • Interim pages omitted …
  • Page 10
  • Go to Next Page »

Get updates in your inbox.

  • Investment Strategies
    • Investment Grade Fixed Income
    • Specialty Asset Classes
  • Our Clients
    • Client Experience
    • Sample RFP Download
  • Insights
    • Video
    • Webinar
    • News
    • Podcasts
  • About
    • Our Team
    • Contact
    • Client Login

Disclaimer: Asset Allocation & Management Company, LLC (AAM) is an investment adviser registered with the Securities and Exchange Commission, specializing in fixed-income asset management services for insurance companies. Registration does not imply a certain level of skill or training. This information was developed using publicly available information, internally developed data and outside sources believed to be reliable. While all reasonable care has been taken to ensure that the facts stated and the opinions given are accurate, complete and reasonable, liability is expressly disclaimed by AAM and any affiliates (collectively known as “AAM”), and their representative officers and employees. This report has been prepared for informational purposes only and does not purport to represent a complete analysis of any security, company or industry discussed. Any opinions and/or recommendations expressed are subject to change without notice and should be considered only as part of a diversified portfolio. A complete list of investment recommendations made during the past year is available upon request. Past performance is not an indication of future returns. This information is distributed to recipients including AAM, any of which may have acted on the basis of the information, or may have an ownership interest in securities to which the information relates. It may also be distributed to clients of AAM, as well as to other recipients with whom no such client relationship exists. Providing this information does not, in and of itself, constitute a recommendation by AAM, nor does it imply that the purchase or sale of any security is suitable for the recipient. Investing in the bond market is subject to certain risks including market, interest-rate, issuer, credit, inflation, liquidity, valuation, volatility, prepayment and extension. No part of this material may be reproduced in any form, or referred to in any other publication, without express written permission. *All figures shown are approximate and subject to change from quarter to quarter. **The accolades and awards highlighted herein are not statements of any advisory client and do not describe any experience with or endorsement of AAM as an investment adviser by any such client.

Copyright © 2024 AAM | Privacy and Disclosures

  • LinkedIn
  • YouTube