• Skip to primary navigation
  • Skip to main content
  • Skip to footer
AAM CompanyTransparent Logo

AAM Company

AAM Company Website

  • Investment Strategies
    • Investment Grade Fixed Income
    • Specialty Asset Classes
  • Clients
    • Our Clients
    • Client Experience
    • Download Sample RFP
  • Insights
    • Video
    • Webinars
    • Podcasts
    • News
  • About
    • Our Team
    • Events
  • Login
  • Contact Us
Contact

Featured

April 30, 2019 by

In the investment industry, there is a widely-held view that a Core Fixed Income strategy is a commodity. The belief is that there are variations among managers and styles of course, but over time those distinctions will offset, and there will ultimately be an immaterial difference in returns. Further, with yields across the investment grade universe near historic lows, the distribution of returns across managers should be even less substantial on a relative basis.

Removing the noise

The question necessarily becomes, is there evidence to support this belief? Or are there in fact significant differences in returns over longer periods of time? If there are, the costs of assuming homogeneity could be more significant than investors realize. We wanted to explore this concept further, but to do so objectively, it was essential to level the playing field by eliminating as much noise in the data as possible. Return differences between core managers can most often be explained by two factors: managing to either different benchmarks or duration targets, and/or a measurable allocation to “non-core” or below investment grade securities.

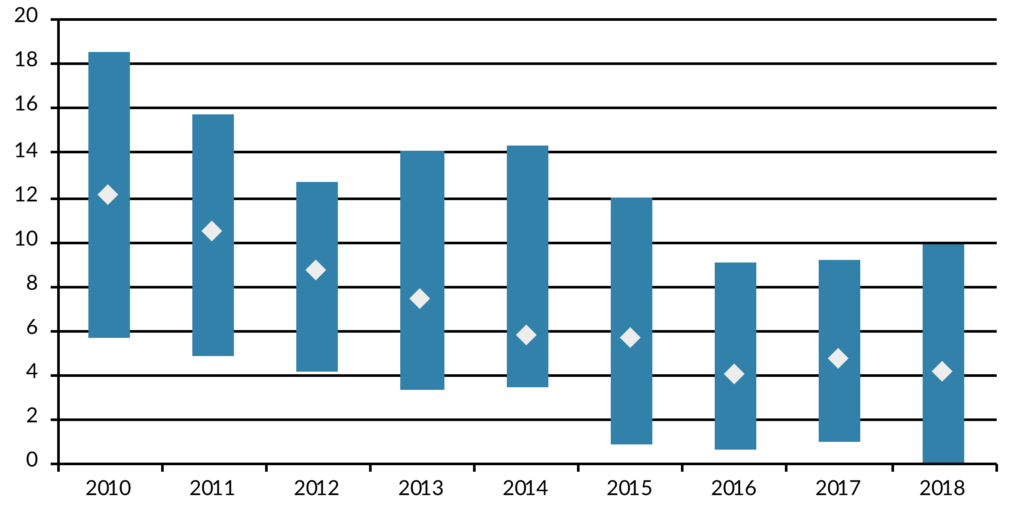
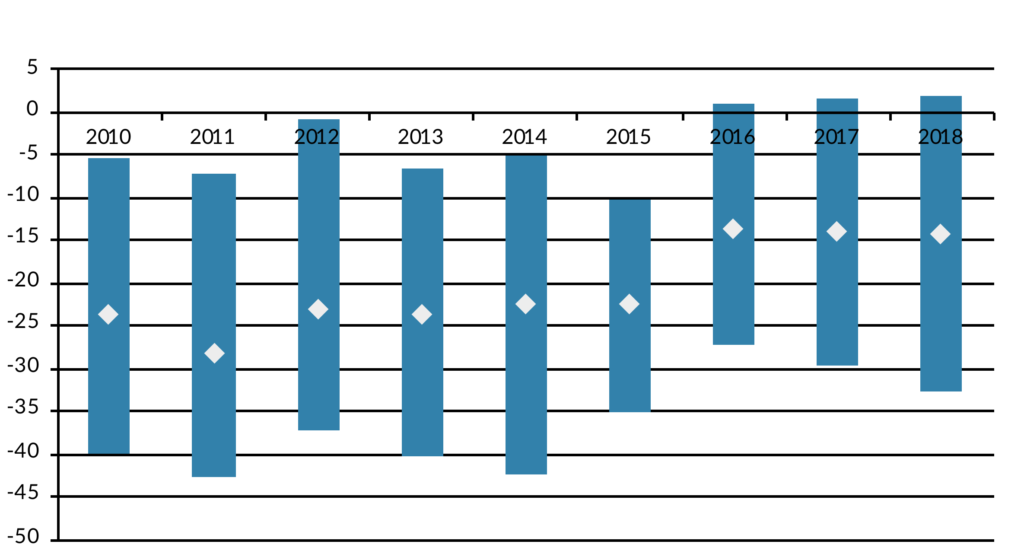
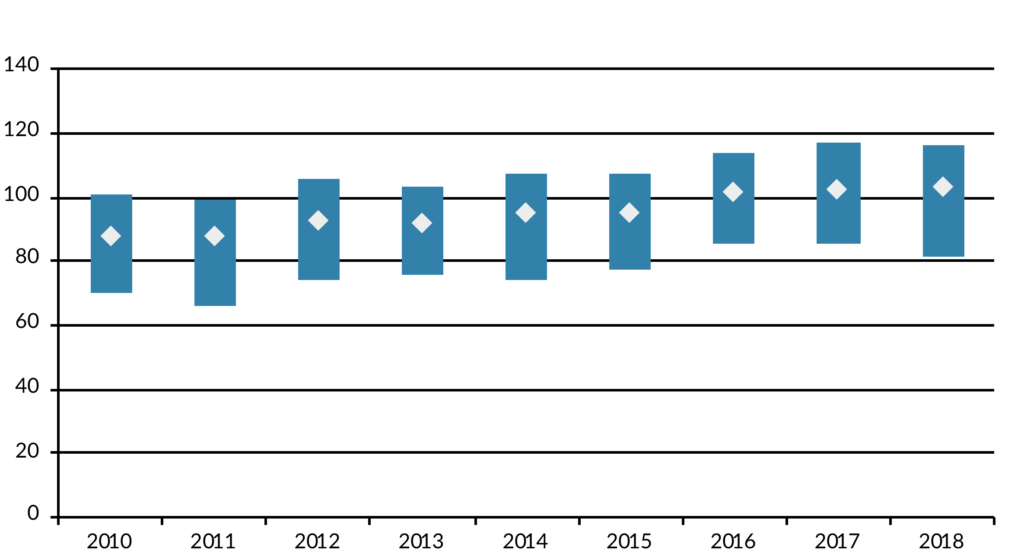
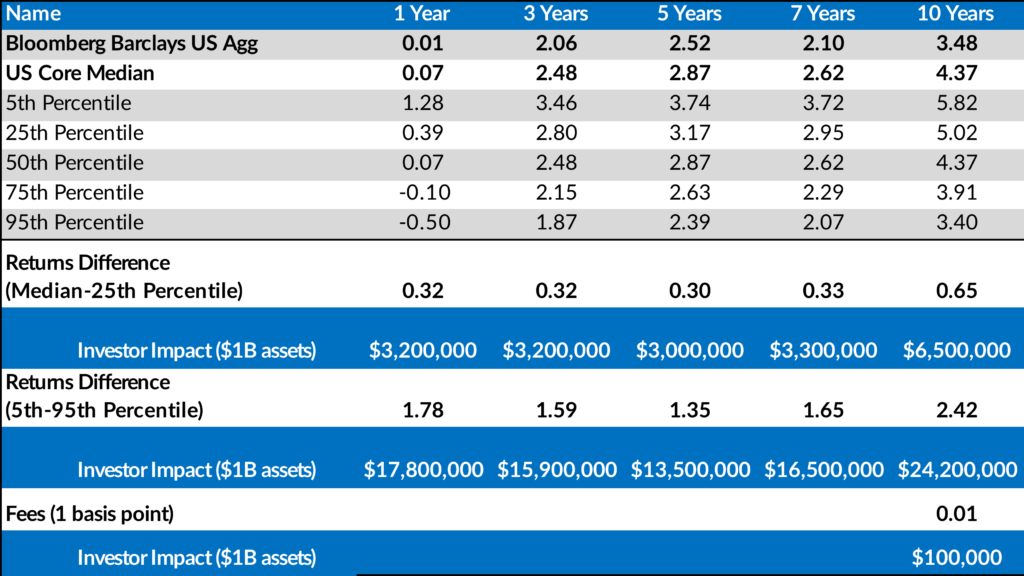
With these factors in mind, we evaluated a universe of institutional core managers with the most comparable objectives and characteristics we could find. The Core managers in this peer group all list the Bloomberg Barclays Aggregate Index as their primary benchmark, share a common duration range, and have an inconsequential allocation to “non-core” bond sectors such as High Yield, Emerging Markets, or non-US dollar assets. Finally, all return statistics for these managers were viewed gross of fees to further eliminate any nuances caused by variations in expenses. In other words, we constructed the most “commoditized” group of US institutional core managers possible. In Exhibit 1 we show the distribution of historical returns for the US Core peer group over the last 10 years. Even over the longest time interval (10 years) the average annualized return difference between the 5th and 95th percentile manager is substantial at 2.42%. In economic terms, that return differential has an impact on investors of $24.2 million a year for every $1 billion in assets. Even the difference between the median core manager and one that performs in the top quartile is significant at 0.65% on average or $6.5 million each year by the same measure (Exhibit 2).

Institutional investors are rightfully mindful of paying reasonable fees to Core managers. Hiring decisions for a new manager in a competitive process are sometimes made with the difference of basis points in management fees being a critical input to who is selected. Comparatively, every 1 basis point (0.01%) in savings for the same $1 billion in assets costs $100,000 less a year. That’s a prudent input for an investor to analyze, but can pale in comparison to the costs of a manager that doesn’t produce competitive returns.

Exhibit 1: US Core Fixed Income Distribution of Returns

Source: Investment Metrics, LLC IM US Broad Market Core Fixed Income (SA+CF) which includes 122 firms and 161 products. Data as of 12/31/2018 and returns greater than 1 year are annualized. 

Exhibit 2: US Core Fixed Income Distribution of Returns – Investor Impact

Source: Investment Metrics, LLC IM US Broad Market Core Fixed Income (SA+CF) which includes 122 firms and 161 products. Data as of 12/31/2018 and returns greater than 1 year are annualized. *Investor Impact – Returns is the difference in annualized returns between Core managers in the 5th and 95t percentile for $1B in assets Fees are the cost of every 1 basis point for $1B. 

Exploring the differences

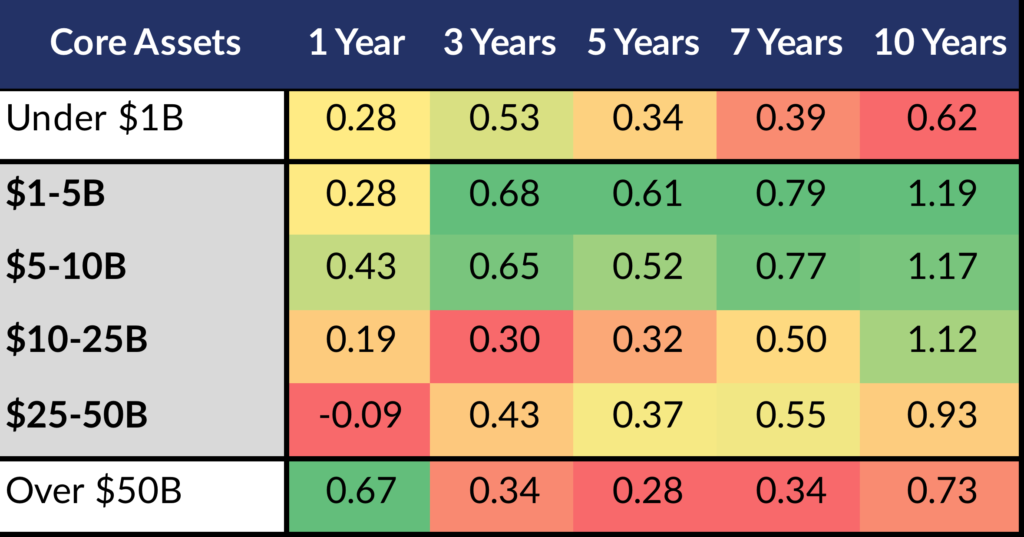
So if performance does in fact affect returns for investors, what is driving the differences in a low interest environment? When you dissect the core universe by asset size, there is a consistent pattern of excess returns relative the benchmark as measured by Alpha. Exhibit 3 shows a heat map of the average Alpha generated by core managers within each core assets category. The colors move gradually from dark green representing the highest (and therefore best) Alpha to dark red representing the lowest. Noticeably, the mid-size managers with core assets ranging form $1 billion-$50 billion exhibited consistently superior performance over all periods longer than 1 year, while both the largest and smallest managers were consistently the worst performers over longer periods of time.

Exhibit 3: Alpha

Source: Investment Metrics US Broad Market Core Fixed Income Separate Accounts and Common Funds Universe. Average Annual Data as of 12/31/2018. US Core Managers benchmarked to the Bloomberg Barclays Aggregate Index. Excludes those with 2% or more in Emerging Markets, High Yield, or Bank Loans, Non-Dollar. Alpha is the measure of the difference between the portfolio’s actual return versus its expected performance given its level of risk as measured by beta. It is a measure of the portfolio’s performance not explained by the movements of the market.

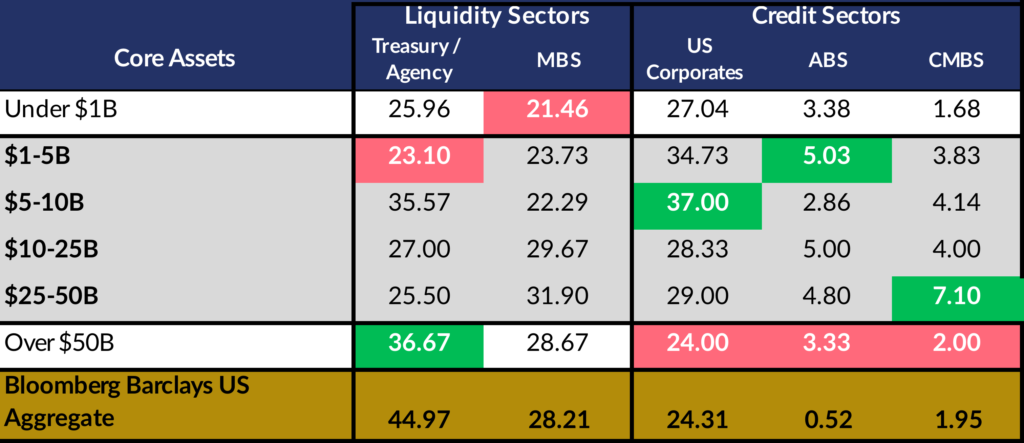
One way to analyze this underperformance is to explore the average sector allocation along the same size segments we examined above. In Exhibit 4, the table highlights that larger managers had hefty allocations to liquidity sectors such as US Treasury and Agencies and the lowest allocation to credit related sectors that traditionally offer more yield. Green indicates the highest average allocation in the peer group while red indicates the lowest. We can see that the $50 billion and over category had the lowest allocation to credit sectors and the most benchmark-like sector allocations overall. This helps explain why the largest managers appear to have the most difficulty delivering excess returns as their positioning closely aligns them with the benchmark itself. For the smaller managers who underperformed, sector allocation alone does not offer a clear explanation. However, a likely consideration is they lack the resources or scale to allow full access to bond dealer offerings.

Exhibit 4: Investment Grade Sector Allocation

Source: Average Sector Allocation per Core Strategy Assets. Investment Metrics US Broad Market Core Fixed Income(SA+CF) Universe, Bloomberg Barclays data as of 12/31/2018. Core Managers benchmarked to the Bloomberg Barclays Aggregate Index. Excludes those with 2% or more in Emerging Markets, High Yield, Bank Loans, Non Dollar.

Identification versus execution

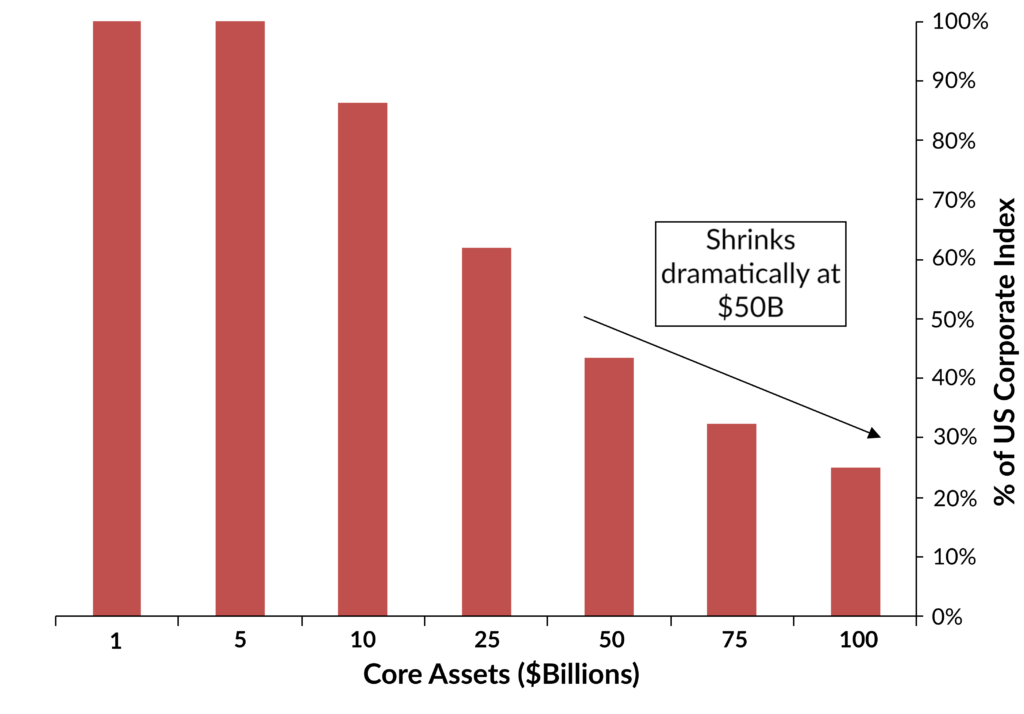
It stands to reason that the largest managers have more difficulty allocating to credit sectors simply because these sectors make up a much smaller portion of the investment grade universe. And even if you successfully allocate to these sectors, it is even more challenging to accumulate an overweight position in a particular bond that offers good value. To illustrate this point, Exhibit 5 shows the percentage of the US Investment Grade issuers that are large enough for a manager to accumulate a 0.5% position, again segmented by manager asset size. We highlight 0.5% because it represents the largest corporate holding in the Bloomberg Barclays US Aggregate Index. So by default, a 0.5% represents an overweight position relative to the benchmark for any other holding. In other words, if a manager buys a 0.5% position in a bond and it performs well, your portfolio outperforms the benchmark because you own a larger position.

As you can see in the chart below, the corporate issuers a manager can overweight shrinks dramatically for managers with assets above $50 billion. Less than half of the index is eligible at $50 billion and only 25% of issuers are large enough at $100 billion. This indicates that implementing trade ideas becomes increasingly difficult for strategies above $50 billion given the limited supply of corporate issuers that are large enough to buy a meaningful position. These managers have the ability to purchase the issues of course, but it is much more difficult to accumulate more than the benchmark’s position size, making it challenging to outperform.

Exhibit 5: Percent of Corporate Market Managers can Overweight (0.5% position)

Source: US Corporate Market is Bloomberg Barclays US Corporate Index US Issuers as of 2/28/2019. *As of 2/28/2019 JPM is the largest US Corporate issuer representing 0.5% of the Bloomberg Barclays US Aggregate Index. Assumes the manager is capped at owning 10% of all of the issuers index eligible debt.

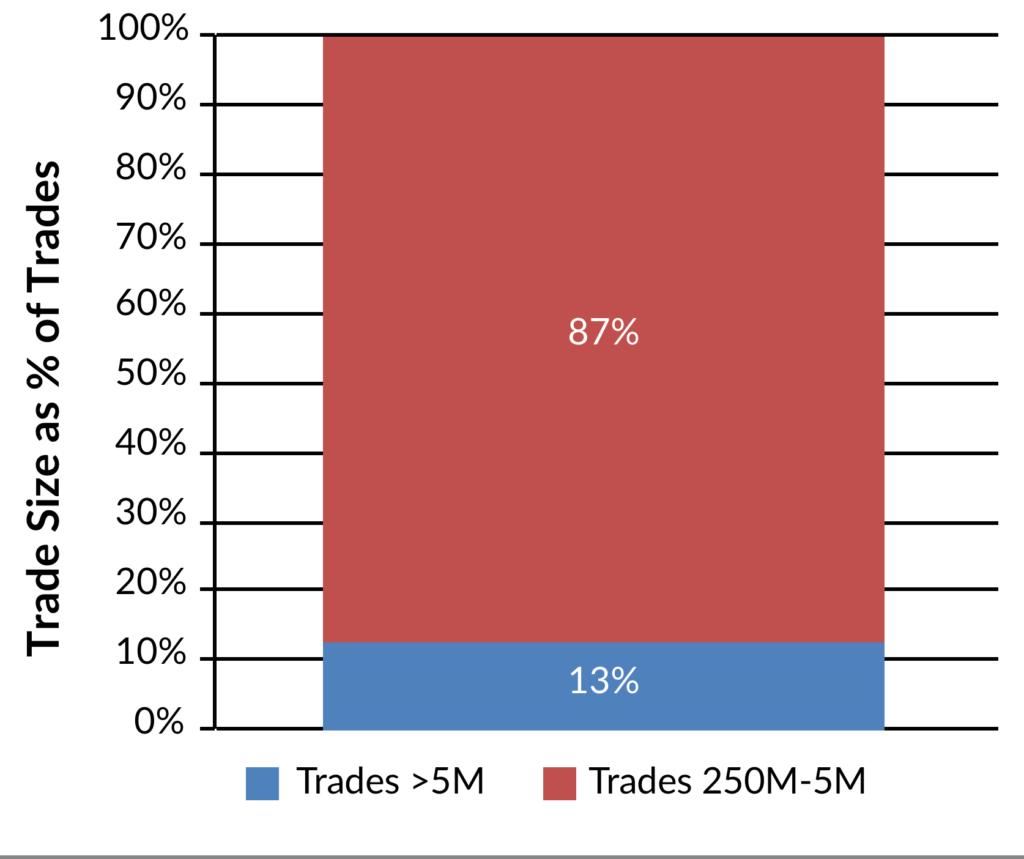
While this example addresses issues related to purchasing bonds, it also pertains to the potential difficulties these same firms encounter when trying to sell large positions whenever credit or valuation concerns arise. The ability to trade large bond positions has declined significantly as bond dealer corporate inventories continue to fall as a regulatory consequence of the financial crisis. At the same time, investment grade debt outstanding has ballooned to all time highs. Put together, because dealers have less capital to make markets buying and selling bonds from their customers, trading volumes in larger sizes have contracted. For example, only 13% of the trades that occurred for the 10 largest bonds in the index were $5 million or greater over recent periods. To put that in perspective, $5 million represents a 0.50% position for a $1 billion portfolio.

Exhibit 6: Investment Grade Debt Outstanding

Source: Morgan Stanley, SIFMA, S&P LCD. Data as of 4/1/2019.

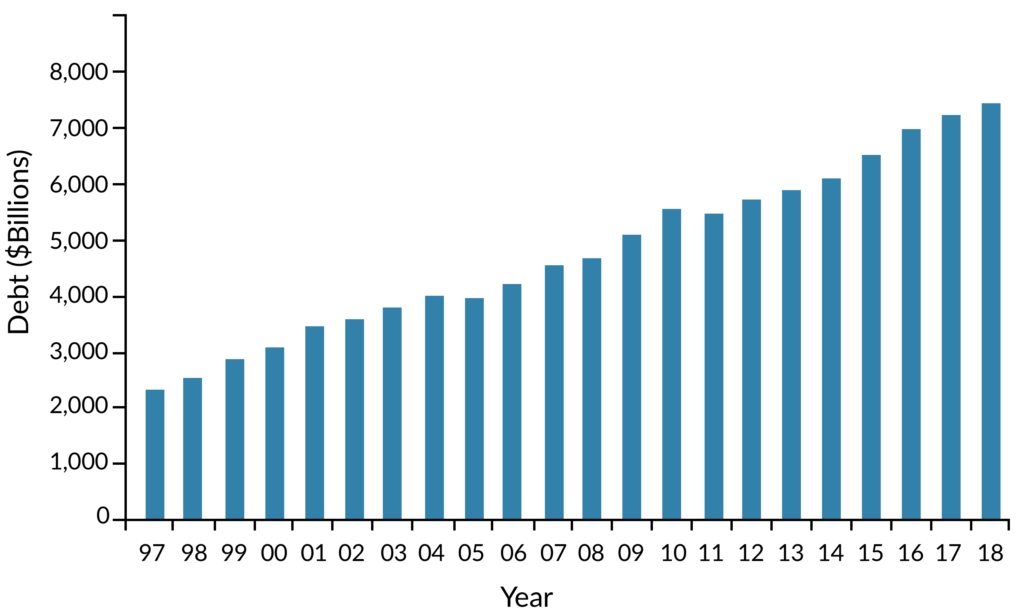
Exhibit 7: Corporate Dealer Inventories

Source: Morgan Stanley Research, Bloomberg, Federal Reserve Bank of New York. Data as of 4/1/2019.

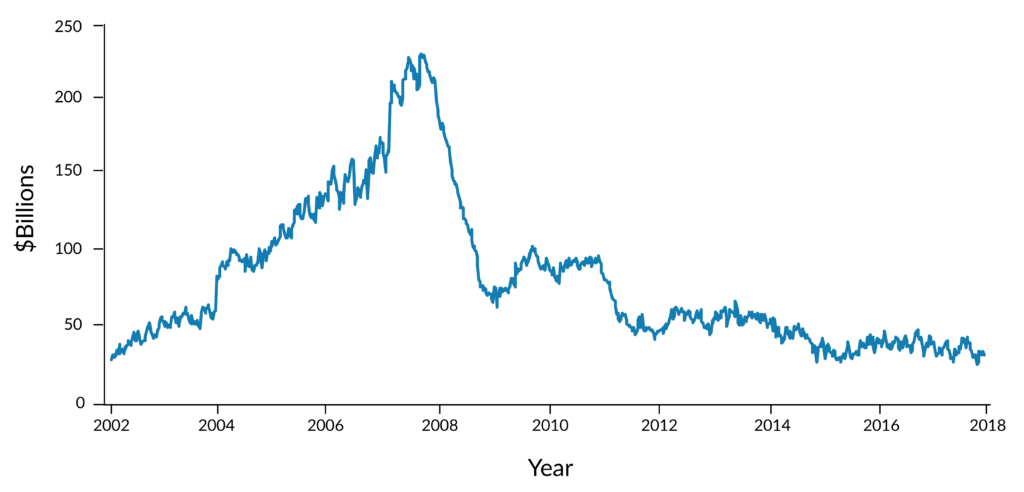
Exhibit 8: Percent of Corporate Trades Based on Size

Source: Bloomberg TRACE data as of 3/14/19. Fixed Coupon IG trades previous 50 days.trades as a % of all trades sized 250,000 par and above.

Conclusion

This analysis has focused on the corporate universe because it is the largest credit related sector. A similar evaluation of the ABS and CMBS sectors would show even less flexibility given the smaller size of these markets. The industry can sometimes assume that larger managers provide superior returns given their size and market influence. However, this analysis demonstrates that size can actually limit the ability to implement relative value views across investment grade sectors or individual credits. Scale and trading limitations can result in portfolios with heavy allocations to Treasury and Agency related securities that are not desirable for income oriented insurance investors.

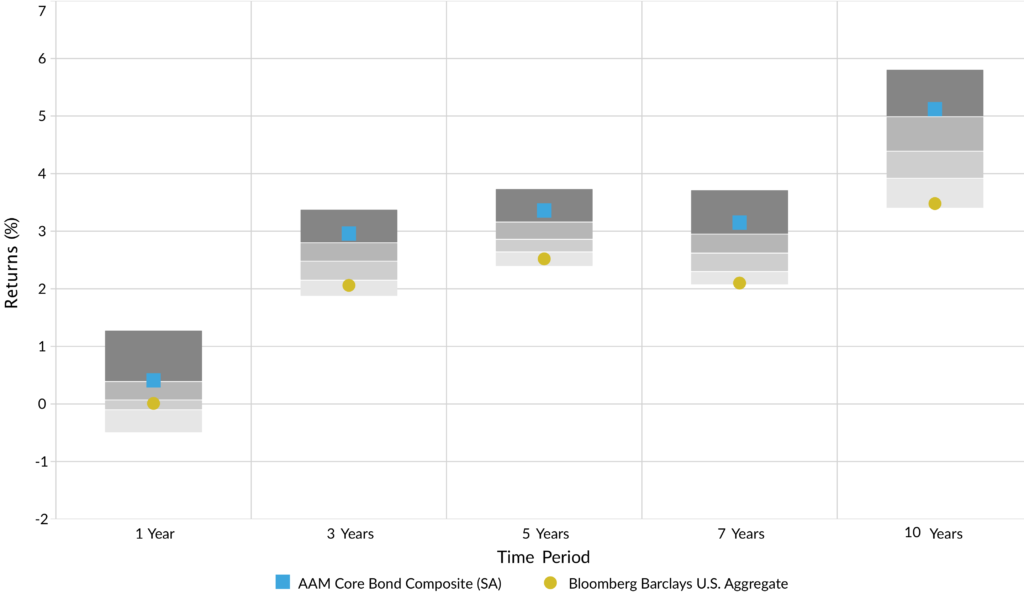
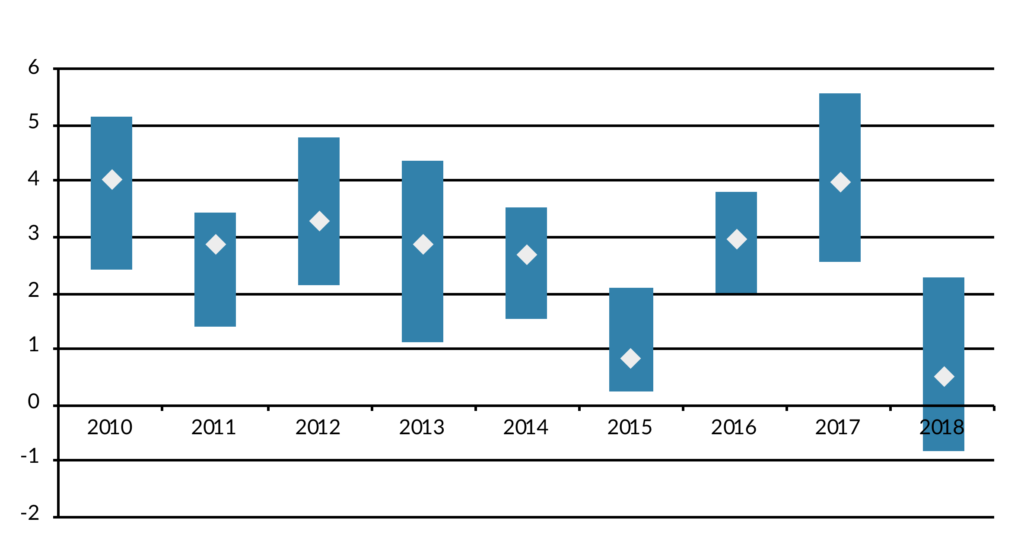
With this analysis, we have shown the connection between the size of a manager’s assets and their portfolio characteristics, which ultimately is reflected in their investment performance. Managers need scale and resources to successfully navigate the market, but being too large can limit execution of investment ideas. At AAM, our philosophy is that insurance portfolios require a yield-oriented approach within a risk-controlled framework. Our research capabilities and size allow the advantage of gaining meaningful allocations to the credit markets and effectively implementing trade ideas within portfolios. That combination has resulted in a track record of consistently competitive total returns.

Exhibit 9: Annualized Returns

Source: Bloomberg Barclays, AAM. Data as of 12/31/2018.

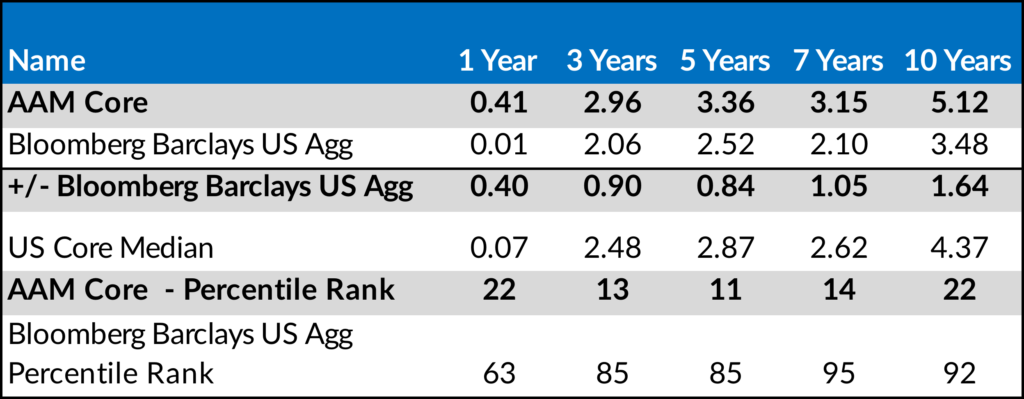
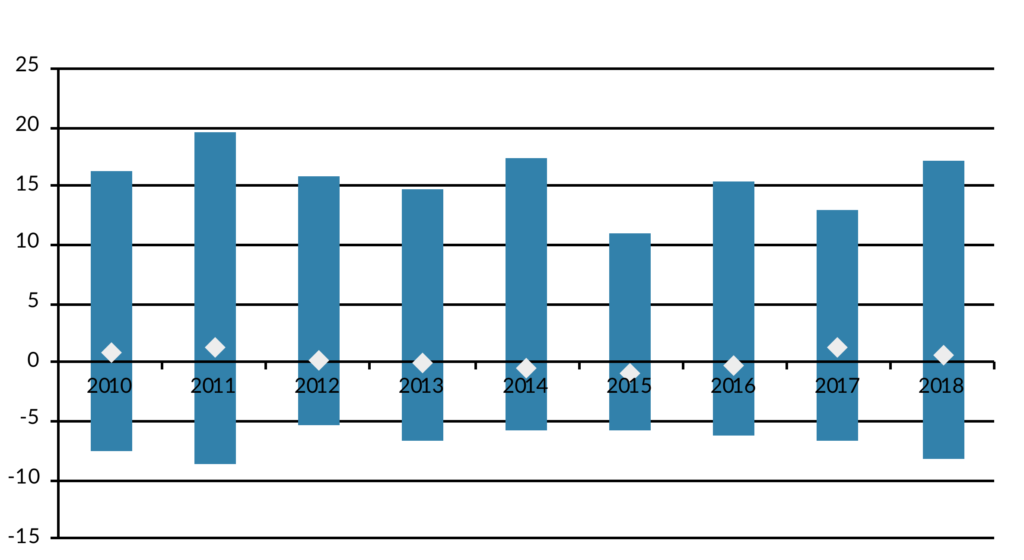
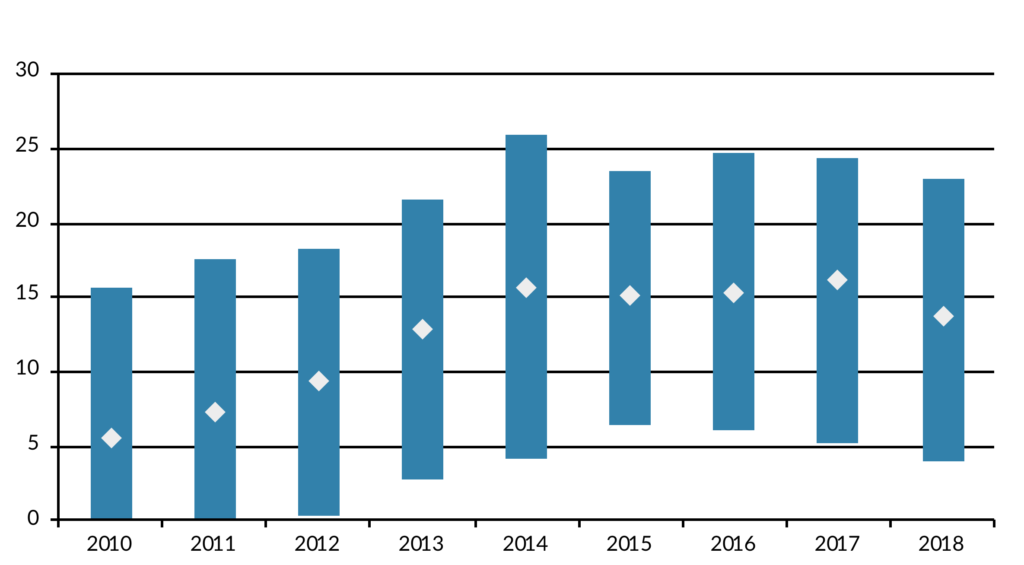
Exhibit 10: US Core Fixed Income Distribution of Returns

Source: Investment Metrics, LLC. All rights reserved. Data as of 12/31/2018. AAM Core Bond Composite includes 9 portfolios and $2,377 million in AUM. Peer group based on IM U.S Broad Market Core Fixed Income (SA + CF) which includes 124 firms and 160 products. 

March 19, 2019 by

This case study was written by Stephen Bard, Chief Operating Officer of Zazove Associates, AAM’s sub-advisor partner for convertible bonds, with contributing authorship belonging to AAM’s Tim Senechalle.

We are roughly nine years into a bull market with many indices having recently been at or near all-time highs. While timing the top of the market is tempting, academics agree that it is a difficult, if not impossible task. An allocation to convertible securities allows an investor to maintain equity exposure, while simultaneously reducing downside participation and risk.

The past decade has been one driven by synchronized worldwide Central Bank easing. The general result has been highly correlated positive returns with constrained volatility. The fourth quarter of 2018 provided a sharp contrast to that norm.

The end of an era

As markets struggle with the end of accommodative Fed policy, the likely outcome is less correlation and decidedly higher volatility. The Zazove convertible strategy is well-suited for this new environment. The combination of stock declines and robust new issuance has created a very attractive universe of balanced convertibles. This allows for the building of high-quality, properly diversified portfolios that can benefit from a market recovery yet be sheltered from continued declines and volatility. As illustrated in Figure 1, balanced convertibles provide investors with equity upside participation with downside protection.

Figure 1

Source: Zazove Associates. For illustrative purposes only.

The fourth quarter of 2018 provided an ideal environment for balanced convertibles to perform and for active managers like Zazove to rebalance portfolios. Given the backdrop of declining stock markets it is not surprising that the primary catalyst within the convertible universe during the quarter was equity sensitivity. While lower Treasury yields, widening credit spreads and spiking volatility also impacted valuations, it was the dramatic equity moves that mostly drove returns.

As expected, the more balanced portion of the convertible universe did an exceptional job of providing downside protection to often stunning equity declines. In contrast, the significant portion of the convertible market that was high delta and equity sensitive fell in lock step with underlying equities.

In it for the long run

The fourth quarter also presented an ideal environment for Zazove’s disciplined, active investment process. Convertible positions that moved down the curve became sell candidates and provided a source of funds to exploit the numerous opportunities created by stock weakness and volatility. As a result of 50%+ stock declines, previously equity-like convertibles became more balanced, valuations became more attractive and yields increased. Each of these factors allowed Zazove to reposition and optimize client portfolios in the balanced region. The traditionally quiet year-end was one of the most active in years and despite the volatility, trading and liquidity remained orderly.

Convertible issuance, combined with the fourth quarter equity market declines, allowed Zazove to counteract two fundamental risk factors associated with the convertible market today: sector concentration and equity sensitivity.

In the aggregate, balanced convertibles provided upside participation as equities climbed during the first three quarters of 2018, while delivering downside protection as markets fell in the fourth quarter. Over a complete market cycle – which has not been seen in nearly ten years – it is expected that the return profile provided by balanced convertibles will result in equity-like returns with less volatility.

Insurance companies, considering statutory accounting principles and regulatory capital requirements, witnessed additional benefits of balanced convertibles during 2018. Since convertibles are treated as bonds on the balance sheet, a significant portion of the economic volatility in the marketplace during Q4 had no impact on statutory capital. Over a market cycle, the long-term exposure to equities should produce realized capital gains while the interim price volatility is muted by the statutory treatment as bonds. Further, the required capital within regulatory and rating agency capital models is substantially lower for convertibles when compared to equities.

More volatility to come?

If the fourth quarter of 2018 foreshadows renewed 2019 market volatility that would be a positive development for investors in Zazove’s balanced convertible strategies. As an active manager, volatility provides abundant trading opportunities and allows for rebalancing, taking advantage of attractive valuations, and continuing to optimize portfolio risk/reward structure. In the long run, volatility increases the value of the embedded option of convertibles.

The supply of balanced convertibles is robust and the opportunity to construct portfolios with compelling risk/return structures is as healthy as it has been in more than a decade.

In summary

• Convertibles are unique and worthy of consideration as part of an asset allocation process;
• The risk/reward profile and low correlations of convertibles are an attractive use of risk budget;
• Insurance companies benefit from reduced potential volatility of capital and improved required regulatory capital relative to equity investments;
• Current market dynamics should prompt fiduciaries to assess the asset class, if they haven’t already.

The opportunity set and trading environment for convertibles is as strong as it has been in years and 2019 should be more of the same.

Please contact us if you would like to schedule a call or meeting with AAM or Zazove Associates to discuss how convertibles can be incorporated into your portfolio and risk budget.

Full length white paper

For access to Zazove Associate’s full length white paper on convertible bonds, please fill out the form provided below.

Access Form

Contact

At AAM:
Tim Senechalle – Senior Portfolio Manager
tim.senechalle@aamcompany.com

John Olvany – Vice President of Business Development
john.olvany@aamcompany.com

Neelm Hameer – Vice President of Business Development
neelm.hameer@aamcompany.com

At Zazove:
Stephen Bard – Chief Operating Officer
sbard@zazove.com

Götz Sennhenn – Director, Client Relations & Business Development
gsennhenn@zazove.com

About Zazove Associates
Zazove Associates, LLC is an independent, employee-owned institutional investment firm that specializes in convertible securities management. The firm was founded in 1971 and manages $2.5 billion in client assets. Zazove works with a range of institutional investors, including insurance companies, public and corporate pension plans, foundations, and family offices. The firm manages a broad range of convertible strategies and invests across the credit spectrum and around the globe. Zazove’s highly disciplined and repeatable approach to convertible investing has generated equity-like returns with significantly less risk over complete market cycles.

February 27, 2019 by

The medical professional liability (MPL) industry is in a period of transition. A protracted era of strong and stable underwriting has had its margins slowly depleted by soft pricing, with the median MPL insurer facing a net underwriting loss in 2016-2018, after years of consistent profits. The historical pattern of conservative reserving practices leading to a tailwind of consistent positive development has moderated, and total premium volume has leveled off, due in part to continuing consolidation of healthcare providers, in the wake of the Affordable Care Act.

Contributing factors

How MPL insurers will respond to this environment remains to be seen. While they are generally profitable and very well capitalized (the ratio of premiums to surplus has fallen from 53% in 2010 to 33% in 2018), they are unlikely to tolerate persistent underwriting losses for very long. Given limited opportunities for growing policy volume, the issue will come down to their inclination and ability to finally raise rates after years of relative stagnation.

On the one hand, MPL is a competitive industry with many monoline players competing for market share, so this could be a difficult proposition. On the other hand, many carriers emphasize high levels of customer service and longstanding relationships with their insureds, which could afford them some leeway in adjusting rates, without sparking the same sorts of loss of customers that one would see in more commoditized sectors like private auto.

Forthcoming effects

One possible outcome is that we may see some participants consolidate, change their legal capital structure, or exit the marketplace altogether. For example, in New York, Berkshire Hathaway recently completed the demutualization of Medical Liability Mutual Insurance Company, and The Doctors Company is purchasing Hospitals Insurance Company, while other carriers are restructuring and using assessments to offset lost premium. We identify five monoline MPL insurers founded in 2013, none in 2014, one in 2015, five in 2016, and two in 2017. Meanwhile, only one has ceased ongoing operations during this period, due to declining capitalization.

The MPL industry has faced a trend of declining reserve releases, rising loss ratios, declining premium growth, declining investment returns, and declining returns to surplus for many years. However, in 2017 the industry finally seemed to reach an inflection point, and results for 2018 at least partially support the idea that these trends may now be reversing.

MPL data

The balance of this article presents a graphical overview of recent financial performance across MPL insurers and explains why their fortunes may be changing for the better, though difficult choices remain.

Figure 1 shows the relationship of returns to surplus for a broad composite of 97 property/casualty (P/C) insurers writing primarily MPL coverage, indicating the 25th-75th percentile range and median for each year. As you can see, returns have shown a pattern of consistent decline over time. We attribute this to three underlying factors: slowing premium growth due to limited capacity to increase rates in a mature market, diminished benefit to underwriting gains from favorable reserve development, and reduced investment returns due to low-fixed income reinvestment rates.

Figure 1: Returns on Surplus

Source: S&P Global Market Intelligence. Data as of 12/31/18.

After consistent declines since 2010, median returns have stabilized at 4-5% and even show signs of recovery. We will see this pattern across many of the statistics we examine. One factor is a modest turnaround in premium volume noted in 2017 (Figure 2) after several years of declines, thanks to strengthening economic conditions.

Figure 2: Growth in Net Written Premium

Source: S&P Global Market Intelligence. Data as of 12/31/18.

Meanwhile on the reserving side, the trend of consistent favorable development each year, which served as the foundation of strong underwriting returns in many recent years, has stabilized (Figure 3), after years of shrinking (less negative = less favorable) reserve releases.

Figure 3: One-Year Reserve Development Divided by Net Premium Earned

Source: S&P Global Market Intelligence. Data as of 12/31/18.

This, in turn, led to a gradual decline in underwriting margin over time, though, once again, we see a pattern of apparent stabilization in the 2017-2018 timeframe (Figure 4).

Figure 4: Combined Ratios

Source: S&P Global Market Intelligence. Data as of 12/31/18.

The investment side

On the investment side, MPL insurers have faced the same declining book yield on fixed-income investments – due to low reinvestment rates – that have affected the whole industry. This has been partly offset by generally strong equity returns ever since the 2008 financial crisis. Figure 5 includes total investment returns for each year (specifically: investment income, realized gains/losses, and unrealized gains/losses marked to surplus below the line) as a percentage of total invested assets, illustrating the downward trend in investment income, but also the strong equity effect from e.g. 2017 (Figure 5).

Figure 5: Total Investment Return (as a Percent of Investments)

Source: S&P Global Market Intelligence. Data as of 12/31/18.

The good news on this front is that reinvestment rates have begun to rise over the last couple of years amid Fed rate hikes and a gradually accelerating economy. The gross bond yield for our composite bottomed at 2.53% in 2016 and rose to 2.85% in 2018. Median equity exposure also tripled between 2010 and 2015, remaining relatively stable thereafter (Figure 6) until declining in Q4 2018 due to market volatility.

Figure 6: Unaffiliated Equity Divided by Investments

Source: S&P Global Market Intelligence. Data as of 12/31/18.

Conclusion: things are improving, but challenges persist

In summary, MPL insurers can look forward to ongoing improvements in earnings derived from favorable reinvestment yields, a welcome development that has been many years in coming. However, the increasingly challenging underwriting environment for this mature sector has brought an end to the era of reliable combined ratios in the range of 85% to 95% for many participants, though in the last couple of years these metrics have begun to stabilize. Whether this ultimately leads to pricing adjustments, consolidation, changes in market structure, or other developments will be key to watch going forward.

For related information please contact:

Neelm Hameer – Vice President of Business Development
neelm.hameer@aamcompany.com

John Olvany – Vice President of Business Development john.olvany@aamcompany.com

February 12, 2019 by

Will auto sales rebound in 2019?

From the floor of the 2019 Chicago Auto Show, AAM Senior Analysts Afrim Ponik and Sebastian Bacchus discuss how China, the US economy, and new technologies will impact auto sales.

January 31, 2019 by

On Monday, January 28, 2019, AAM hosted an Investment Outlook webinar which included a general economic overview and during which our sector experts shared their insights regarding Corporates, Structured Products, Municipals, High Yield, and Convertibles. Watch it here.

January 8, 2019 by

Reproduced with permission from Jason Simkin, CPA | Simkin CPA, LLC – The Insurance Tax Advisory Firm

Just in time for the Government Shutdown, the IRS has issued the discount factor information necessary to run a calculation of the potential tax reform implications for Unpaid Loss, LAE, and Salvage/Subrogation reserves and recoverables. Up to this point companies have generally not updated their financials for the tax implications of this major item. Many of you have probably put a note in your 2017 financials stating that this and other aspects of the tax reform implementation would be accounted for in 2018. Thus, you are now faced with a decision for your year-end financials on if and how to use the specified factors to generate a tax reform adjustment for tax provision. A few important observations:

1) What types of Companies are affected?

All P&C companies, as well as Life & Health companies that write certain A&H products (ex. Group Health, Med Sup, other A&H products excluding guaranteed renewable/non-cancelable, etc.)

2) What was provided in the Revenue Procedure?

a) Estimated Discount Factors to apply to all lines of business for the 2018 accident year (based on concepts in the Proposed Regulations)
b) Estimated Discount Factors to apply to all lines of business for 2017 and prior accident years to calculate the tax reform implementation adjustment to be amortized beginning in 2018 (based on concepts in the Proposed Regulations)

3) Were there any surprises in the Revenue Procedure?

One area that may provide a significantly more material impact to your financials than many were expecting is the approach to computing the tax reform adjustment and future discount factors for all accident years prior to 2018. The approach may be significantly more material as the change covered more years and more aspects of the calculation methodology than many anticipated. These are the potential computations of the tax reform adjustment that were considered, as well as the IRS’ selection in the Revenue Procedure:

a) Not Selected – Follow the 2016 and prior IRS historical industry payment pattern/discount factors and continue to run off those accident years under historical IRS patterns. For the 2017 year the unpaid losses and LAE would be computed using historical industry payment patterns but with the 2017 corporate bond rate.
b) Not Selected – Follow the 2016 and prior IRS historical industry payment pattern but replace the discount factor for those years with a corporate bond rate for that vintage year. For the 2017 year the unpaid losses would be computed using IRS historical industry payment patterns but with the corporate bond rate.
c) IRS Revenue Procedure Selection – The following is the summary from our firm’s discussions with Kathryn Sneade, the principle author of the Regulation and Revenue Procedure, as you will find that some of the underlying assumptions are not explicitly discussed in the Revenue Procedure. Thus, the following may ultimately be changed/clarified in future IRS commentary. Kathryn explained that for 2017 and prior they basically discarded all vintaged historical payment patterns and discount rates for all accident years 2017 and prior. They replaced those payment patterns and discount factors with the 2018 payment pattern and 2018 corporate bond rate. Thus, all years 2017 and prior are not only recomputed with a new discount rate but also with a new payment pattern independent of the payment pattern for that vintage year. For future years (i.e. 2019 and forward) she stated that they would go back to each accident year being vintaged with respect to payment pattern and interest rate. However, the 2018 and prior accident years would continue to use the 2018 payment pattern and corporate rate. Depending on the lines of business you write and the specific accident years you have with unpaid losses the materiality of this approach may be substantially more than you anticipated.

4) Will the factors in the Revenue Procedure change and are the underlying concepts final or estimates?

The factors, which affect all accident years from 2018 and prior, were generally based on the IRS concepts and positions taken in the Proposed Regulations published in November. While unusual, the IRS released the Revenue Procedure with computational results of principles still open to change, and with the provision that it may revise them further after the Regulations are finalized.

5) Will the factors be finalized before company financials are issued?

A hearing for the public to comment on the Proposed Regulations took place on December 20th. The Comment period for the Revenue Procedure is open until February 6, 2019. It’s also not clear how long the Government Shutdown will last and whether it could cause a delay in this area. Thus, it’s possible that there will not be Final Regulations and a final Revenue Procedure until after many companies publish year-end 2018 IFRS/GAAP/STAT financials. This leaves you with a decision to make whether your applicable financial statement guidance (i.e. GAAP/IFRS/STAT) requires you to book a tax reform implementation adjustment based on the new Revenue Procedure, as well as how to account for any future change in the computations after the Regulation and Revenue Procedures are finalized.

Jason Simkin, CPA
Simkin CPA, LLC – The Insurance Tax Advisory Firm
5757 Alpha Road Suite 622, Dallax, TX 75240
Email: jasonsimkin@simkincpa.com
Office: 972-308-0044
Cell: 806-252-9069

The “IRS Tax Reform 2018 and Prior Disc Factors” and “Proposed Regulations – Discounted Unpaid Loss and Salvage and Sub” are provided as supplements in the corresponding PDF document.

Disclaimer: AAM is not providing tax advice. You should consult with your own tax advisor.

  • « Go to Previous Page
  • Page 1
  • Page 2
  • Page 3
  • Page 4
  • Page 5
  • Page 6
  • Interim pages omitted …
  • Page 10
  • Go to Next Page »

Get updates in your inbox.

  • Investment Strategies
    • Investment Grade Fixed Income
    • Specialty Asset Classes
  • Our Clients
    • Client Experience
    • Sample RFP Download
  • Insights
    • Video
    • Webinar
    • News
    • Podcasts
  • About
    • Our Team
    • Contact
    • Client Login

Disclaimer: Asset Allocation & Management Company, LLC (AAM) is an investment adviser registered with the Securities and Exchange Commission, specializing in fixed-income asset management services for insurance companies. Registration does not imply a certain level of skill or training. This information was developed using publicly available information, internally developed data and outside sources believed to be reliable. While all reasonable care has been taken to ensure that the facts stated and the opinions given are accurate, complete and reasonable, liability is expressly disclaimed by AAM and any affiliates (collectively known as “AAM”), and their representative officers and employees. This report has been prepared for informational purposes only and does not purport to represent a complete analysis of any security, company or industry discussed. Any opinions and/or recommendations expressed are subject to change without notice and should be considered only as part of a diversified portfolio. A complete list of investment recommendations made during the past year is available upon request. Past performance is not an indication of future returns. This information is distributed to recipients including AAM, any of which may have acted on the basis of the information, or may have an ownership interest in securities to which the information relates. It may also be distributed to clients of AAM, as well as to other recipients with whom no such client relationship exists. Providing this information does not, in and of itself, constitute a recommendation by AAM, nor does it imply that the purchase or sale of any security is suitable for the recipient. Investing in the bond market is subject to certain risks including market, interest-rate, issuer, credit, inflation, liquidity, valuation, volatility, prepayment and extension. No part of this material may be reproduced in any form, or referred to in any other publication, without express written permission. *All figures shown are approximate and subject to change from quarter to quarter. **The accolades and awards highlighted herein are not statements of any advisory client and do not describe any experience with or endorsement of AAM as an investment adviser by any such client.

Copyright © 2024 AAM | Privacy and Disclosures

  • LinkedIn
  • YouTube