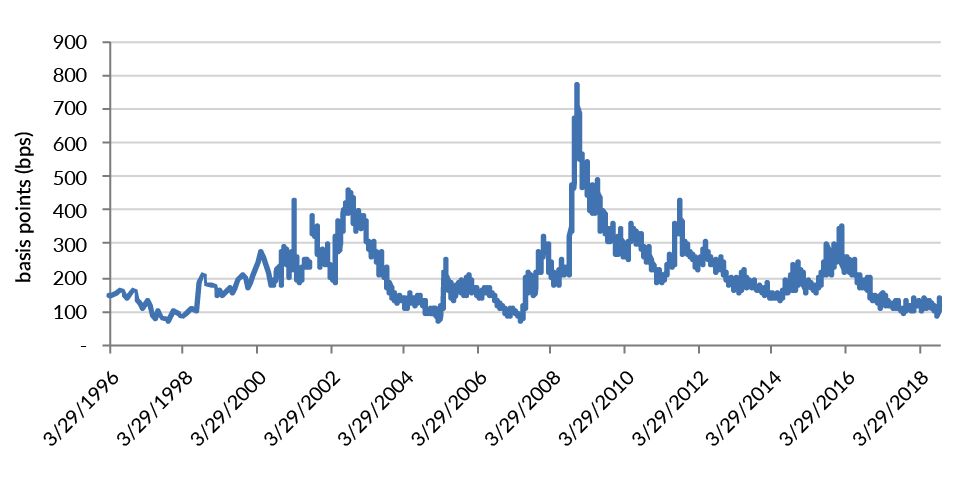
Our investment process includes regular presentations from the analysts on themes that will influence the future performance of companies and credit spreads. Two years ago, we presented 5G and how that will affect companies’ strategic plans in the Telecom, Media and Technology (TMT) industries. Even though 5G was not something we had expected to be deployed meaningfully in the near term, it was a technology that would influence decision making across the TMT space. We have found the investment community to be split on whether 5G will succeed, and perhaps Verizon’s recent success in its test markets may start to increase investor confidence. With the arrest of Huawei’s CFO, it is difficult to dispute the importance of the technology.
There are critical questions to be answered such as: What is 5G, and why do we need it? How will the industry be structured given the tremendous increase in capacity? And, in the quest for returns on the capital deployed, what industries and companies will be disrupted? We will address these questions and more in this report. An important conclusion is that while this technology will take some time to fully implement, the path towards 5G is important and the benefits it could provide to companies and economies are meaningful.
Why are wireless companies investing in 5G?
With four national wireless carriers in the U.S., competition is intense, and aggressive promotions like unlimited data have filled up the networks. Unfortunately for the carriers, they have not captured much of the upside economically. Technology companies like Facebook and Netflix have driven much of the increased usage on the network, profiting nicely, while the wireless carriers have seen little change in consumers’ average monthly payment or ARPU (average revenue per user). Wireless carriers are faced with a problem of increasing capacity on the network because of these strains while earning a return on that investment. The migration from 4G/LTE to 5G is necessary to increase capacity and return potential. The technology will address problems that exist today while providing revenue opportunity associated with new use cases. It also changes the competitive playing field.
What exactly is 5G?
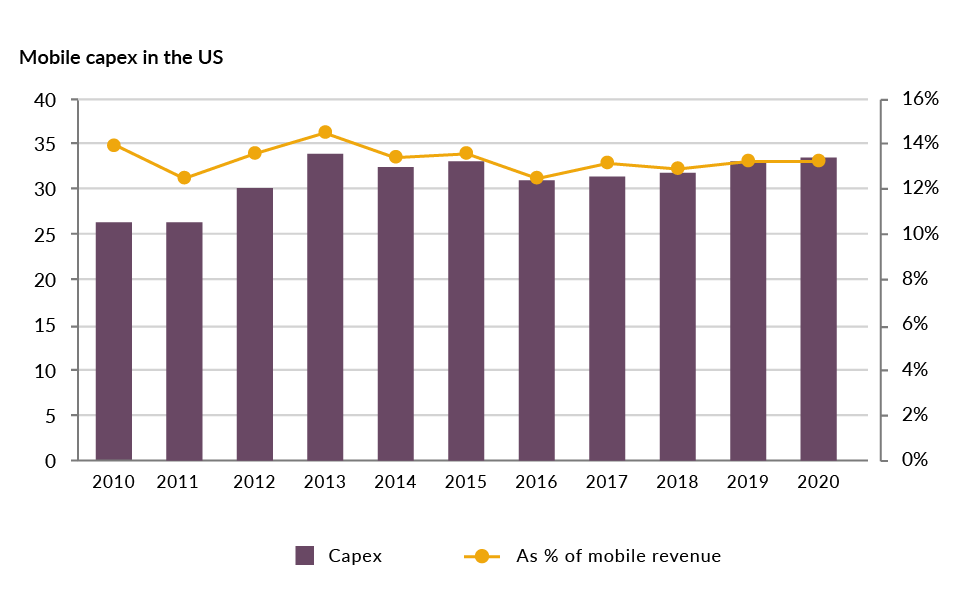
Exhibit 1
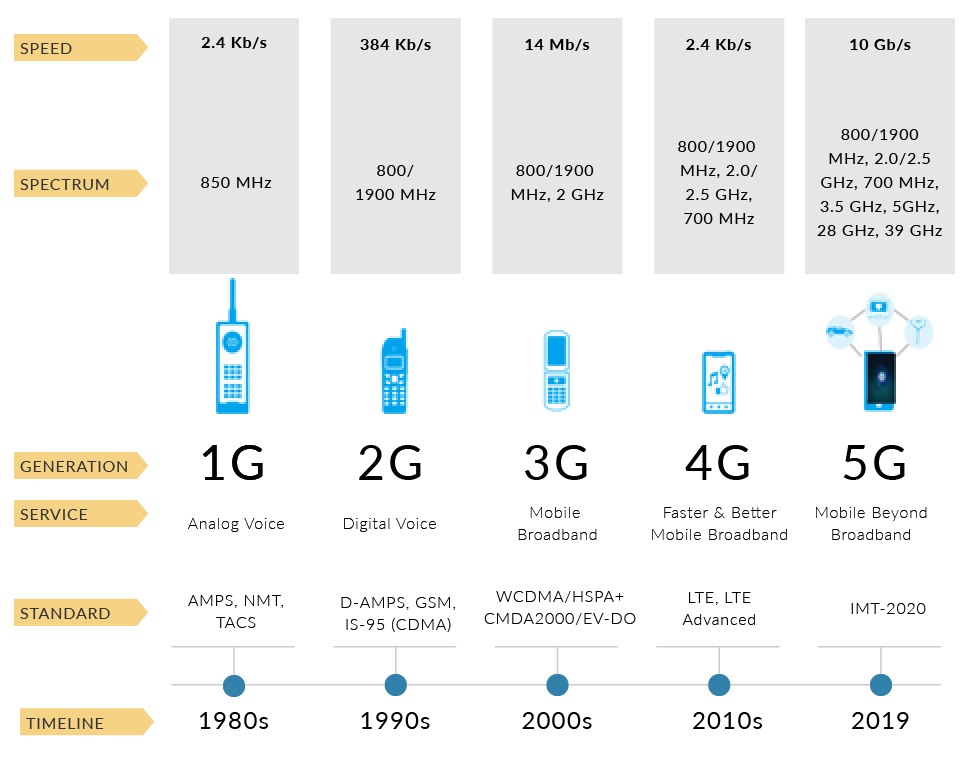
5G is the fifth generation of wireless technology. It differs from predecessor technologies in many ways. Most notably, it requires upgrading the core network in addition to the radio technology. To offer true 5G speeds, a network must be densified, requiring fiber and small cells to be deployed as well as the addition of technology such as Massive MIMO. A 5G network will ultimately allow very low latency (1ms vs. ~20ms in LTE), faster speeds (gigabytes), and the ability for wireless carriers to manage networks in a more efficient and flexible way. Importantly, while a fixed wireless 5G network leverages high band spectrum (>3.5GHz, mmWave), mobile 5G can be deployed on all spectrum bands. Lower bands may not provide the bandwidth necessary to replace a high bandwidth fixed offering (i.e., from a cable company or fiber provider), but will be sufficient to deliver applications for internet of things (IoT), industry automation and other business critical use cases. Also, the advantage over 4G/LTE should be sufficient to cover more rural areas of the U.S., approximately 40% of which do not have speeds of 25Mbps. Furthermore, the path towards 5G allows wireless carriers to upgrade their current mobile offerings. For example, AT&T is expecting to offer speeds over 400 Mbps to mobile subscribers with newer handsets (e.g., iPhone 8, X) next year given the upgrades to their 4G/LTE network as they work towards 5G.
Can 5G be deployed profitably?
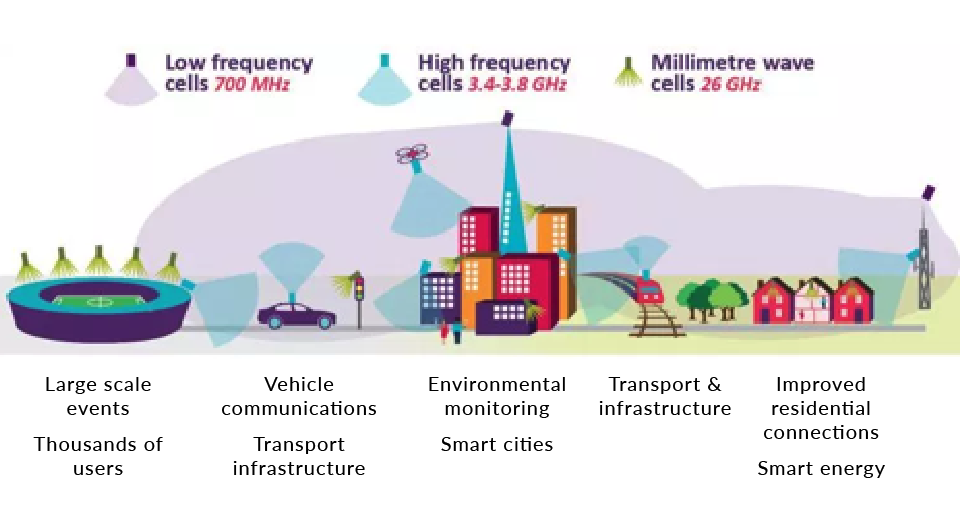
This is the big question that is difficult to answer at this stage. As we explained, wireless carriers need to invest in their networks just to meet the demands today. We believe the additional investment will be made according to use case. The image below shows how various network architectures can be utilized based on the ultimate need and return potential. Lower frequency spectrum provides wider area coverage but cannot provide the very high speeds of a mmWave based 5G network. However, this type of network is not needed for every use case. A true 5G network will likely be deployed in areas like stadiums and smart cities that need to support more devices per area (5G can support 1 million devices per square kilometer vs. 4GLTE’s 2,000). Therefore, we expect carriers to be selective with how they upgrade their networks from a capital investment standpoint. European carriers are already talking about sharing infrastructure to deploy 5G more profitably.
Exhibit 2
In terms of capital spending, we expect carriers to invest at a pace consistent with historic periods. We also believe the investment period will be more gradual and prolonged given the significance. Positively, carriers expect to reduce their operating costs as they migrate to 5G. This is not only a selling point for the wireless carriers but for their end users as well. We believe the benefits of the network will allow enterprise and/or public services to increase their productivity and lower costs. This should have a positive impact on inflationary pressures longer term.
Exhibit 3
Revenue upside for telecom providers is expected to be realized over time. Initially, we expect the wireless carriers to gain market share in video and broadband as consumers “cut the cord” and replace their wired solution with wireless. True 5G will be competitive with modern cable offerings; therefore, the competitive advantage will no longer be speed and reliability but functionality. We believe the wireless companies should have the advantage in the residential market.
The advantage of a 5G network is the ability to use it more broadly – not just for consumers. Use cases even in the initial investment period will involve IoT (smart homes, cities, buildings) and entertainment offerings like advanced augmented reality, virtual reality, connected/autonomous vehicles (infotainment, navigation), industrial and vehicular automation, and mission critical/emergency services. As standalone 5G networks are deployed longer term, the ability to leverage the network for autonomous vehicles is more likely. Verizon and AT&T are involved in the planning phase with vendors, auto manufacturers, and suppliers to ensure their involvement beyond infotainment and navigation. Moreover, the flexibility of the network should allow the carriers to structure various business models depending on the use case. The network will be able to be customized depending on the vertical (healthcare, auto, manufacturing). It also will help support Artificial Intelligence (AI).
It is expected that the initial period will last through 2021, as radio and other equipment is added, with the ramp in investment occurring from 2021-2025, as international standards are finalized and operators have a better understanding of the ROI. Handsets with 5G capabilities should be available by 2020, with 5G expected to become the lead mobile technology in the U.S. by 2025. Longer term, standalone networks will be built to enable full usage of 5G, which is expected by 2035. For this to occur, we believe carriers will need to rationalize the capacity in a way to manage the economics associated with the return. Accordingly, we believe the U.S. needs to become a three carrier market and are keenly interested in the success of the Sprint/T-Mobile merger and the future of Dish and its spectrum portfolio.
Which companies will win or lose?
In the near term, technology, tower, and construction companies will benefit. Their ability to manage this cycle of investment is critical. Crown Castle has been investing in 5G via fiber and small cells, a strategy we like as macro tower revenue growth is likely to flat line or potentially decrease as more small cells are deployed and utilized longer term. Wireless companies in the U.S. must also approach this investment cycle cautiously, especially as virtually all of them have little financial flexibility given their dividend payouts and debt leverage. Conversely, we like the structural benefits of the Canadian wireless industry (more fiber to homes, benign regulatory environment, converged carriers with both cable and telecom) and believe these carriers will benefit from a more disciplined 5G rollout and investment cycle. European carriers are also taking a much more cautious approach but are dealing with pro-consumer regulatory bodies that need to bend to foster 5G investment.
We believe cable, rural telecom providers, and smaller media networks will need to restructure and/or transform their businesses to survive. The regional telecom operators like Frontier and Windstream have suffered in the equity market as investors appreciate the risk to longer term cash flows as their rural markets are vulnerable to wireless substitution. As we noted earlier, rural markets do not need a true 5G solution. Simple upgrades to existing networks, as Sprint/T-Mobile have promised as part of their push to regulators to approve the merger, will disrupt these companies as well as other smaller “mom and pop” cable/telecom companies. We believe the same pressure will be applied to cable companies as they lose their competitive advantage and need to invest and possibly re-engineer their business models around these changes in the marketplace. If they become “broadband only” businesses, do they need media holdings and/or investment grade ratings to maximize returns for shareholders?
From another perspective, will wireless carriers need to offer more than connectivity to maximize their 5G return on investment (ROI)? AT&T clearly believes it will need to participate as a media company with its acquisition of Time Warner, but Verizon does not. We believe the advantage of an integrated offering (content plus distribution) is not truly known today, and as this becomes apparent, will determine future M&A activity for companies like Verizon and Charter. As consumers access media in ways that expand beyond video, using AR and VR capabilities, media network companies (e.g., CBS, Discovery, Viacom) will need to invest and restructure their businesses around their strengths and not simply look to maximize programming to push through linear and virtual channels as they have done to date. In the meantime, with the amount spent on programming expected to reach over $100B in 2020 vs. $65B in 2016 – mostly from new entrants like Apple, Hulu, Facebook, Amazon and Netflix – what does that mean for traditional networks that do not have strong brands or a platform that allows them to directly interact with the consumer?
We expect more M&A activity in the cable and media space in anticipation of pressure to their business models in the intermediate term (2021-2025). This is because the benefits of 5G related technology enhancements enable fixed to wireless substitution, which should pressure cable/satellite cash flows and revenue streams for media networks that rely on payments from cable providers. Notably, critical sports rights expire beyond 2020 (e.g., 2021-2022 Monday and Sunday night football rights), and with 5G technology improving the mobile experience, technology companies like Amazon and Google are likely to be more aggressive in the bidding process. We believe smaller networks like CBS will be unable to support these higher prices. An economic recession could pull forward the destruction of value for cable and media networks, as consumers look to rationalize their media/telecom spend.
Summary
5G is a critical technology not just for the industries and companies involved but for economies around the world. With projections of trillions of dollars being added to global economic activity by 2035 (per IHS Markit), we believe this will continue to drive decisions not only in board rooms but by government officials as well. China has been pushing to be the first with 5G, and Huawei is an important part of that strategy. We are maintaining our bias towards high quality Communications and Technology companies. We continue to expect heightened event risk (asset sales, M&A) and financial disappointments from lower quality, secularly challenged companies.