• Skip to primary navigation
  • Skip to main content
  • Skip to footer
AAM CompanyTransparent Logo

AAM Company

AAM Company Website

  • Investment Strategies
    • Investment Grade Fixed Income
    • Specialty Asset Classes
  • Clients
    • Our Clients
    • Client Experience
    • Download Sample RFP
  • Insights
    • Video
    • Webinars
    • Podcasts
    • News
  • About
    • Our Team
    • Events
  • Login
  • Contact Us
Contact

Featured

May 9, 2017 by

May 8, 2017 by

Chris Priebe
Structured Products Strategy and Trading

Subprime Auto ABS has been a prominent headline recently with multiple articles suggesting that increased delinquencies are a sign of a bubble getting ready to burst, similar to the mortgage crisis of several years ago.   So AAM took a look behind the headlines.

What does a Subprime Borrower Look Like?

Obviously, a borrower who falls into the subprime category is someone who is considered a higher-than-normal risk. Very often individuals find themselves in the subprime category due to one significant occurrence or due to a series of unfortunate events. Bad investments, a failed business, debilitating student loans, loss of employment, catastrophic medical bills and many other circumstances can quickly force people into precarious financial situations.

So what is the profile of a subprime borrower? They may have a history of late or missed payments, default debt, excessive debt, and personal bankruptcy or have few or no assets. As a result, they can only qualify for higher interest rate consumer debt and consequently, pay more in interest for mortgages, credit cards, car loans and car leases. In the United States subprime borrowers are typically categorized as individuals with FICO scores of below 640.

In 2008, subprime lending to people who may not otherwise have qualified lead to the mortgage crisis. Per JP Morgan, roughly 70%-80% of subprime borrowers were issued adjustable rate mortgages and when those loans adjusted to higher interest rates, refinancing was difficult due to declining home values. This resulted in a widespread domino crisis beginning with mortgage defaults which lead to foreclosures and eventually resulted in the declining value of mortgage-backed securities and a meltdown of the entire system.

Is that same trend happening today in Auto ABS?

In AAM’s review of data and information from multiple sources, the good news is that a mortgage-like meltdown does not seem imminent in the Auto ABS sector.  According to JP Morgan:

  • Subprime and deep subprime loans are a relatively small portion of new sales;
  • Delinquency increases have been modest outside of subprime;
  • Loan duration has seen no recent inflection;
  • Premiums to US Treasuries that auto finance companies must pay have moderated.

JP Morgan goes on to state:

“Auto ABS collateral performance shows signs of deterioration in aggregate with the belief based on history that there will likely be a shakeout and/or consolidation of lenders.  However, the feeling is that Auto ABS structures remain sound in spite of potentially higher losses.”

According to Deutsche Bank, the number of cars registered per household is as high as ever at 2.25 and most auto loans are issued to super-prime borrowers.  Also, per JP Morgan, new car loan FICO scores remain flat at 711 going back to 2015, and while delinquencies have risen, they have not done so sharply.    Although loan durations reached an average of 68 months in 2016 this increase is the result of longer average length of ownership and vehicle durability.  It appears that it is well qualified buyers who are driving up loan durations due to continuously increasing new car prices.

So Why the Headlines?

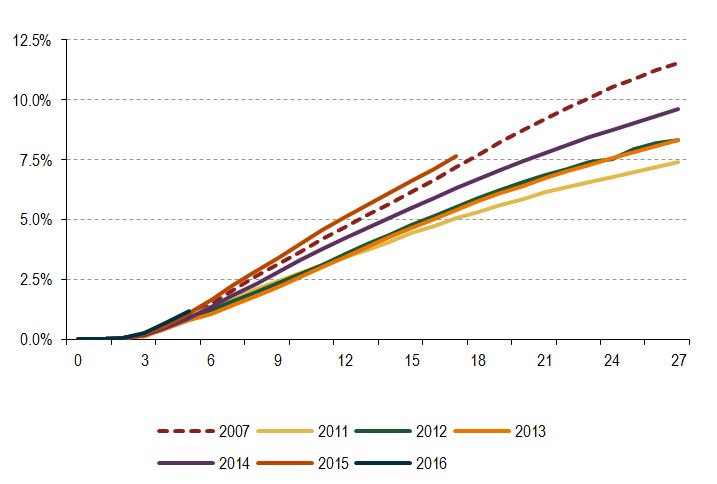
The reason for the worrisome headlines is because subprime Auto ABS cumulative net losses appear to continue to climb.  According to Merrill Lynch, cumulative net losses for the 2014-2015 vintages are higher than the 2011-2013 vintages for sub prime issuers in aggregate.  And, the 2015 vintage is tracking higher than those for the 2007 vintage.

Non-prime auto loan ABS – Cumulative Net Losses

Source: Intex, BofA Merrill Lynch Global Research

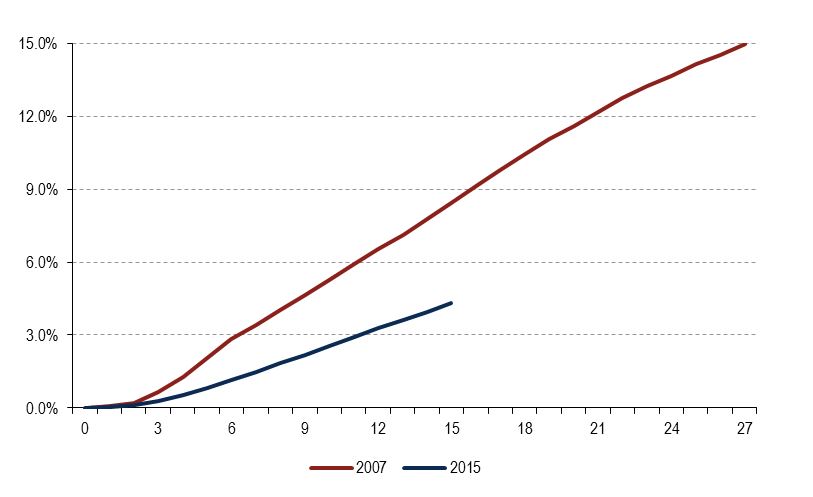
However, it must be noted that in comparing 2007 vintages to 2015 vintages, the latter includes additional and new lenders who focus on the deep subprime market, thereby skewing the results.  When the data is normalized to compare similar types of lenders between periods, the 2015 vintage performs much better than 2007.  According to Merrill Lynch, “Specifically, at 15 months of seasoning, the 2015 vintage has CNL of 4.3% while the 2007 vintage has CNL of 8.4%.  Unadjusted, the CNL would be 6.6% for the 2015 vintage and 6.2% for the 2007 vintage.”  So, as JP Morgan states, the sky is not falling on the automotive finance industry.

Non-prime Auto Loan ABS – Cumulative Net Losses – Normalized
2007 v. 2015

Source: Intex, BofA Merrill Lynch Global Research

But there are some negative trends that warrant attention in the future, including:

  • Car dealer inventories are rising as more vehicles come off leases;
  • Lease penetration has risen to new highs as consumers search for ways to offset higher new vehicle prices;
  • Even more vehicles will come off lease in the next three years;
  • Overall auto loan delinquency rate has moved slightly higher due to uptick in subprime delinquencies

What Does This Mean for AAM Clients?

At AAM, we believe that subprime auto loan performance will continue to deteriorate in 2017 and 2018, although at a slow rate.   Similar to earlier cycles, credit expansion in deep subprime auto lending is moving credit performance to weaker levels. The make up of more recent subprime lenders accessing the ABS market has dramatically changed since the 2008 recession.  Lender and product mix and weaker vehicle prices could drive losses higher.  The current level of enhancement for most auto ABS should limit the downside risk for these subprime deals.

Auto headlines will continue to hit news wires. Used car supply has close to doubled since 2011 and 2012. Higher than usual lease sales will continue to put pressure on supply in the future considering that 30% of all sales are now leases, which is up from 20% a few years back. Close to four million cars annually will be coming off lease in 2017 thru 2019 up from two million annually just a few years ago. AAM structures and light exposure to benchmark subprime ABS autos is nominal and we look to use any widening as an opportunity to add to senior bonds.

At AAM, we still view benchmark ABS issuers in prime auto loans, high quality credit cards, rate reduction, rail car and equipment ABS as a safe haven in structured products. The auto market is seeing tiering in the weaker and new sponsor names but we don’t see a systematic subprime auto breakdown ahead. The market will see spread separation in the usual benchmark subprime issuers versus the deep subprime entrants the market has recently seen.

Despite the subprime credit deterioration news, economic expansion and respectable wage growth is supportive for a majority of the ABS market. While we do see worse credit performance ahead in the student loan market place, consumer lending and deep subprime auto, we believe ABS investors will be well protected by their structures and credit support.


Disclaimer: Asset Allocation & Management Company, LLC (AAM) is an investment adviser registered with the Securities and Exchange Commission, specializing in fixed-income asset management services for insurance companies. Registration does not imply a certain level of skill or training. This information was developed using publicly available information, internally developed data and outside sources believed to be reliable.  While all reasonable care has been taken to ensure that the facts stated and the opinions given are accurate, complete and reasonable, liability is expressly disclaimed by AAM and any affiliates (collectively known as “AAM”), and their representative officers and employees.  This report has been prepared for informational purposes only and does not purport to represent a complete analysis of any security, company or industry discussed. Any opinions and/or recommendations expressed are subject to change without notice and should be considered only as part of a diversified portfolio. A complete list of investment recommendations made during the past year is available upon request. Past performance is not an indication of future returns. This information is distributed to recipients including AAM, any of which may have acted on the basis of the information, or may have an ownership interest in securities to which the information relates.  It may also be distributed to clients of AAM, as well as to other recipients with whom no such client relationship exists.  Providing this information does not, in and of itself, constitute a recommendation by AAM, nor does it imply that the purchase or sale of any security is suitable for the recipient. Investing in the bond market is subject to certain risks including market, interest-rate, issuer, credit, inflation, liquidity, valuation, volatility, prepayment and extension. No part of this material may be reproduced in any form, or referred to in any other publication, without express written permission.

April 20, 2017 by

By Elizabeth Henderson, CFA
Director of Corporate Credit

Elizabeth Henderson

[toc]

Market Summary and Outlook

The Investment Grade (IG) Corporate bond market delivered a 1% total return in the first quarter 2017, with spreads tightening 5 basis points (bps) since year-end 2016. Risk assets outperformed, as the S&P Index increased close to 6% in the first quarter, high yield returned approximately 3%, and Emerging Markets also returned approximately 3%. After outperforming in the fourth quarter 2016, corporate bonds with maturities greater than ten years underperformed in the first quarter.

We continued to see strong demand from bond funds for investment grade securities despite volatility in high yield fund flows. Foreign buying of IG debt has fallen from the very strong levels in 2015-2016, but we continue to expect it to remain a source of demand given the yield advantage (net of hedging costs) of U.S. IG bonds. New issue supply was higher than expected to start the year, with companies accessing the market in anticipation of higher rates, a modest headwind for spreads.

The Option-Adjusted Spread (OAS) is approaching our target for the year; therefore, we expect returns to be generated largely from income over the near term. Our base case expects stable to improving commodity prices, approximately 2% domestic economic growth, containment of risks overseas, regulatory relief in the U.S., and some tax relief. If risks to our base case increase to the downside, we would expect spreads to widen as Treasury yields fall. However, we believe the risk of material spread widening due to an increase in default risk is low given the availability of credit and low probability of a recession. Uncertainty should keep event (and ratings) risk more subdued as well.

Source: Bloomberg Barclays, AAM

Performance Summary and Year-to-Date

The driver of returns for Investment Grade Corporates in the first quarter 2017 was primarily coupon income with spreads starting the year at relatively low levels. Performance has been driven primarily by the higher yielding sectors, Energy and Basic Materials, as well as Financials that tightened due to the prospect of higher interest rates and regulatory relief. For Metals and Mining, metals prices stabilized due to supply disruptions caused by weather and political issues and solid Chinese economic data. This coupled with credit rating upgrades drove tighter spreads for Metals and Mining issuers. The risk of debt funded acquisitions caused the Telecom/Media/Technology sector to underperform even though it is one of the wider spread sectors.

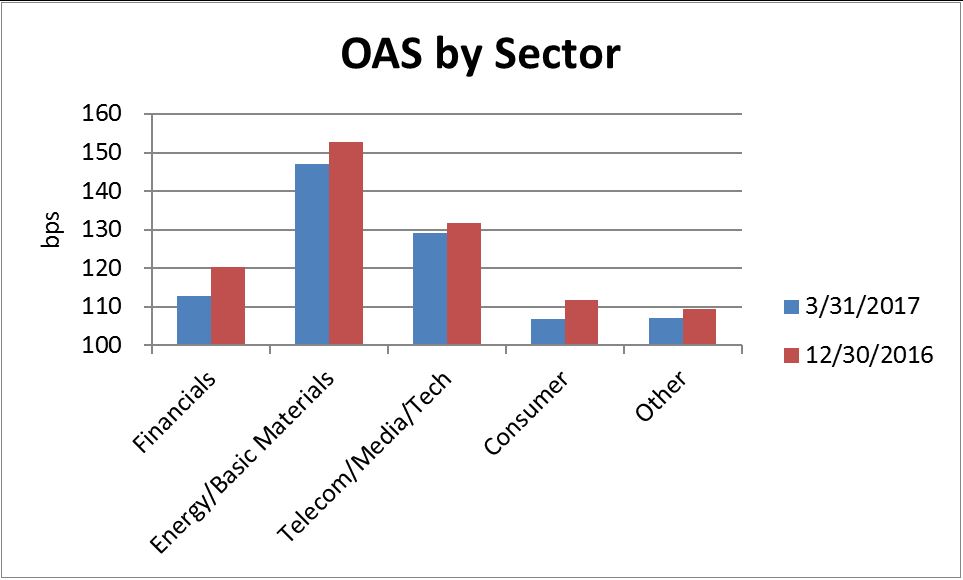
Source: Bloomberg Barclays Index (as of 3/31/2017), AAM 

Credit Fundamentals Expected to Improve From Cyclically Weak Levels

Credit metrics continued to weaken in 2016, as EBITDA growth did not keep up with rising debt levels, resulting in debt leverage to increase once again. That said, companies became more parsimonious with debt leverage in the second half of 2016 in response to the capital markets closing and spreads widening meaningfully with a rising probability of a recession earlier in 2016.

  1. We project improving revenue and EBITDA growth in 2017 driven mainly by:
    Higher commodity prices, benefitting energy and basic material issuers
  2. Higher interest rates relative to 2016 and modest loan growth, benefitting banks
  3. Improving emerging market economies, consumer demand for PCs and smartphones (iPhone 8, new features), and investment in cloud infrastructure, benefitting technology issuers.

Optimism remains elevated post the election, and analyst estimates for EBITDA and capital spending for the majority of sectors remains higher as well. Entering 2017, our outlook for credit fundamentals was generally positive except for a handful of sectors where we expected growth to disappoint (e.g., Autos, Retail, Cable). Growth disappointments related to secular challenges or cyclical slowdowns keep event risk (and thus, ratings risk) elevated. For example, after a disappointing fourth quarter and forecast, S&P downgraded Under Armour from investment grade to high yield.

Default Risk Falls

We expect the default rate to fall in 2017 due to higher commmodity prices and a much improved credit market. Bank standards have loosened, yields have fallen (high yield, investment grade and emerging markets), and the leveraged loan market is wide open after being closed for a period of time in 2015-2016. Demand is especially strong for leveraged loans, causing spreads to tighten in CLOs and bank loans. This has resulted in loan refinancings and investor willingness to accept looser covenants (“covenant lite”). Lastly, the Credit Manager Index continues to reflect a favborable environment for non-bank lenders.

The credit cycle, which had appeared to have peaked in late 2015, has been rejuvenated.  Until we see evidence of credit contraction, we expect spreads to remain range bound (OAS  between 110 – 140 bps).

Rating Stability Expected

The credit rating of the IG Corporate market has fallen over the last ten years as the percentage of BBB rated securities has increased due primarily to: (1) rating downgrades as companies take advantage of lower rates to increase shareholder returns (share repurchase, M&A), (2) changes in rating methodologies in the Finance sector post the financial crisis, and (3) an increase in the number of non-Financial issuers, which tend to be capitalized with more debt.

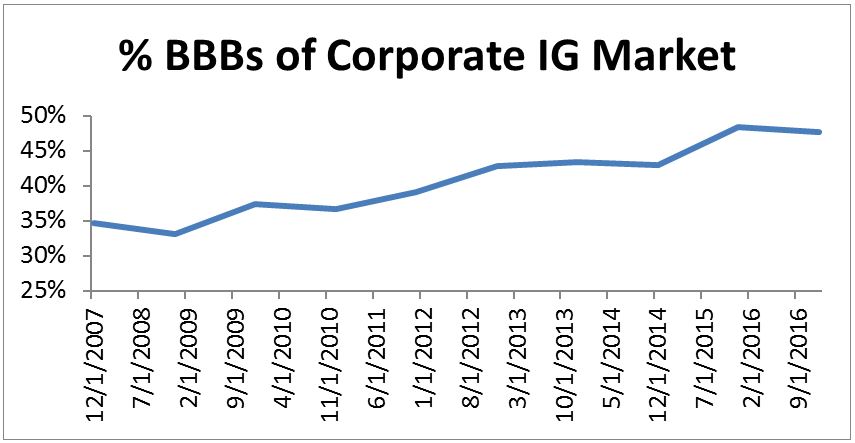
Source: Bloomberg Barclays (based on market values); AAM

Tax policy is uncertain, and the changes being discussed have varying consequences to IG issuers.  While we have an understanding of how this may affect firms in various industries, we (and management teams) are at a standstil until there is more clarity on what is likely to pass.  At this point, we do not expect meaningful changes to the tax code with a modest reduction in the corporate tax rate most likely.  Except for industries that face structural issues such as Retail, we expect ratings to remain largely stable in this period of uncertainty despite a historically flat WACC curve by credit rating.

Market supply and demand technicals remain supportive

Insurance and Pension Funds, traditional holders of corporate bonds, increased purchases in 2016, on the prospect of increased rates and because competing asset classes were less attractive.  Comparatively, money market funds sold corporate bonds due to money market reform.  But, the real story was the increase in demand from foreign investors.  Foreign ownership of corporate bonds has been rising over the past twenty years with an acceleration over the past couple years given very low (or negative) interest rates in overseas markets.  Buying was especially strong from European investors, as the ECB included corporate bonds in its bond buying program, causing yields and supply to fall.

Source: Morgan Stanley

What do we expect this year from foreign buyers?  We believe the political and geopolitical uncertainty in Europe will support an accomodative ECB and keep rates low over the near term.  The risk is that the ECB becomes more hawkish due to higher than expected economic growth or inflation.  We do not believe that risk is incorrectly priced today.

The other technical benefit to IG corporate bonds today is the relative attractiveness to fixed income asset classes such as Structured Products and Municipals, which have experienced spread tightening year-to-date.  Moreover, with equity valuations rising and credit spreads tightening in risk sectors such as high yield and emerging markets, it increases the relative attractiveness of IG corporate bonds.

One risk over the near-to-intermediate term is related to balance sheet management by the Fed.  Mutual Funds reduced their holdings of MBS after 2008 (per Fed Flow of Funds data), increasing their allocation to credit.  If a Federal Reserve unwind of its QE program makes Treasuries and/or Mortgage Backed Securities (MBS) more attractive then a subsequent rotation out of credit and into MBS by fund managers would likely put pressure on corporate spreads.


Written by:

Elizabeth Henderson, CFA


Disclaimer: Asset Allocation & Management Company, LLC (AAM) is an investment adviser registered with the Securities and Exchange Commission, specializing in fixed-income asset management services for insurance companies. Registration does not imply a certain level of skill or training. This information was developed using publicly available information, internally developed data and outside sources believed to be reliable.  While all reasonable care has been taken to ensure that the facts stated and the opinions given are accurate, complete and reasonable, liability is expressly disclaimed by AAM and any affiliates (collectively known as “AAM”), and their representative officers and employees.  This report has been prepared for informational purposes only and does not purport to represent a complete analysis of any security, company or industry discussed. Any opinions and/or recommendations expressed are subject to change without notice and should be considered only as part of a diversified portfolio. A complete list of investment recommendations made during the past year is available upon request. Past performance is not an indication of future returns. This information is distributed to recipients including AAM, any of which may have acted on the basis of the information, or may have an ownership interest in securities to which the information relates.  It may also be distributed to clients of AAM, as well as to other recipients with whom no such client relationship exists.  Providing this information does not, in and of itself, constitute a recommendation by AAM, nor does it imply that the purchase or sale of any security is suitable for the recipient. Investing in the bond market is subject to certain risks including market, interest-rate, issuer, credit, inflation, liquidity, valuation, volatility, prepayment and extension. No part of this material may be reproduced in any form, or referred to in any other publication, without express written permission.

April 20, 2017 by

Greg Bell, CFA
Director of Municipal Bonds

Municipals Experienced Strengthening Technicals during the Quarter.

The tax-exempt sector experienced mixed performance during the first quarter overall, but stronger technicals were building by the end of the quarter. At the beginning of the year, municipal bond investors were concerned about both a rising rate environment and the prospects for major tax reform that could reduce the relative valuations for the sector. Those concerns resulted in very robust demand for short-dated maturities around the 5 year and shorter area that helped push yields lower by 27 and 24 basis points (bps) in 3 and 5 years, respectively. By contrast, the worries over the potential for a substantial cut to the corporate tax rate to 20% have generally been felt in the 15 to 30 year area of the yield curve. Insurance companies and banks, the investors that provide most of the sponsorship to that part of the yield curve, have been very cautious and have favored a neutral positioning until more clarity exists on the extent of tax reform. Yields in that range ended the quarter 1 to 3bps higher. The clear shift in reducing duration risk during the quarter resulted in the slope of the yield curve from 2 to 30 years steepening by 37 bps to a one-year high of 220bps on March 9th.

Since that time, the market did receive some unexpected support from positive developments related to supply technicals. March is historically one of the weakest technical periods of the year. New issuance typically spikes during the month as state and local governments finalize budgets and identify spending initiatives, along with refinancing opportunities. This building supply cycle typically outstrips demand, as reinvestment flows from coupons/calls/maturities fall to the lowest point of the year during March and April. However, this year, March supply came in well-below expectations at $29.8B, which was a drop of 30% from March 2016 and 20% below the 10 year average for March. The major catalyst for the drop has been the rise in interest rates. Municipal 10 year rates moved to a 2017 high of 2.49% during March, which was 78bps higher than average 10yr yields during 2016. The higher rate environment substantially reduced the universe of deals that could generate the necessary reduction in debt servicing costs to execute refinancings.

The market also benefited from the failure of congress to pass repeal and replacement of the Affordable Care Act. The lack of repeal of the law left intact the 3.8% Medicare surtax on investment income, which continues to make tax-exempts attractive relative to taxable alternatives subject to this tax. Additionally, the repeal and replace legislation would have generated a substantial reduction in the budget deficit and would have helped pave the way for a more aggressive push toward cutting corporate rates to the 20% level targeted by the House Speaker, Paul Ryan. Without the budget deficit savings, the market appears to now expect a corporate rate in the 27% to 30% range. Since March 15th, these developments resulted in 10 year muni yields falling by 24bps and the slope of the yield curve from 2 to 30 years to flatten by 17bps.

In looking at our outlook for the 2nd quarter, technicals should continue to exhibit a strengthening trend into the end of the quarter. Reinvestment flows are expected to be the highest of the year during June and July 1st, while supply is expected to remain manageable. However, if rates continue to move lower, cost savings from refinancings could become more compelling and we could see a renewed surge in supply levels. The market is also continuing to wait for more clarity on the extent of tax reform and the sector could experience some volatility around this issue. With our more constructive view on demand technicals, we are transitioning accounts from an underweight to a neutral bias.


Disclaimer: Asset Allocation & Management Company, LLC (AAM) is an investment adviser registered with the Securities and Exchange Commission, specializing in fixed-income asset management services for insurance companies. Registration does not imply a certain level of skill or training. This information was developed using publicly available information, internally developed data and outside sources believed to be reliable.  While all reasonable care has been taken to ensure that the facts stated and the opinions given are accurate, complete and reasonable, liability is expressly disclaimed by AAM and any affiliates (collectively known as “AAM”), and their representative officers and employees.  This report has been prepared for informational purposes only and does not purport to represent a complete analysis of any security, company or industry discussed. Any opinions and/or recommendations expressed are subject to change without notice and should be considered only as part of a diversified portfolio. A complete list of investment recommendations made during the past year is available upon request. Past performance is not an indication of future returns. This information is distributed to recipients including AAM, any of which may have acted on the basis of the information, or may have an ownership interest in securities to which the information relates.  It may also be distributed to clients of AAM, as well as to other recipients with whom no such client relationship exists.  Providing this information does not, in and of itself, constitute a recommendation by AAM, nor does it imply that the purchase or sale of any security is suitable for the recipient. Investing in the bond market is subject to certain risks including market, interest-rate, issuer, credit, inflation, liquidity, valuation, volatility, prepayment and extension. No part of this material may be reproduced in any form, or referred to in any other publication, without express written permission.


February 2, 2017 by

AAM’s Florida Homeowners Aggregate (“FHA”) experienced a moderate increase in catastrophe-related underwriting losses during 2016, resulting in a Last Twelve Months (LTM) combined ratio exceeding 100 for the first time since 2011. Total premium volume continued to grow, but at a significantly reduced rate compared to recent years. Meanwhile, underwriting leverage reversed its recent downward trend, posting the highest level since the 2013 peak. On the investment side the decline in investment yields seems to have finally bottomed out, with the unfortunate implication that portfolios have been fully turned over into the low prevailing rates of recent years. Exposure to common stock investments remain at record high levels (measured as a % of surplus), while cash holdings remain at a relatively low 21% of invested assets, down from 46% as recently as 2012. In this report we will review these and other developments in the Florida homeowners market, and look ahead to important developments in the coming year.

The FHA’s average loss ratio rose from 57.8 in 2015 to 66.0 for the LTM period ended 9/30/16 (all income statement items in this report are on an LTM basis, to compensate for significant seasonality effects present in this market). The first three quarters saw a modest increase in catastrophe losses, though expenses were largely flat. These figures do include the effects of Hurricane Hermine (the first hurricane to make landfall in Florida since Wilma in 2005), but exclude the impact of Hurricane Matthew, which struck the southeastern US in October and was the twelfth costliest storm ever in that region per National Oceanic and Atmospheric Administration (NOAA) calculations. Fortunately, Matthew ultimately caused much lower losses than initially feared and makes a good field test for the reinsurance and risk management programs of the many FL homeowner start-ups that have emerged in the past 10 years. Unfortunately, it will also likely lead to increased assignment-of-benefits activity, pending legislative relief for this ongoing issue in the Florida market. Between the effects of Matthew and the possibility of unfavorable reserve development in Q4, it appears that the recent era of relatively benign loss activity may finally be drawing to a close.

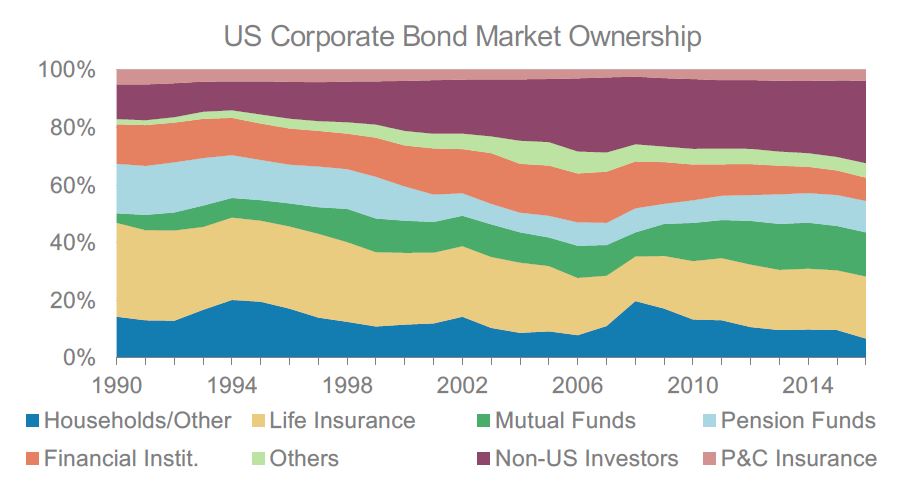
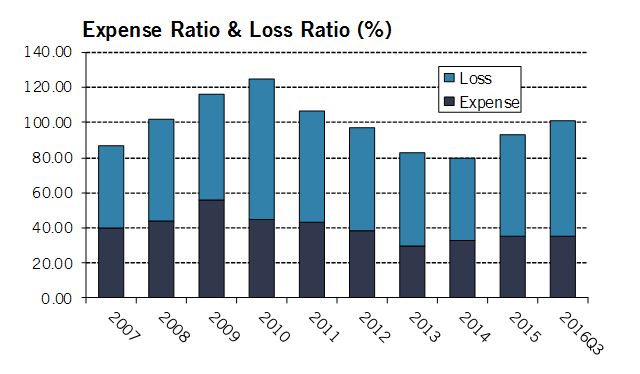
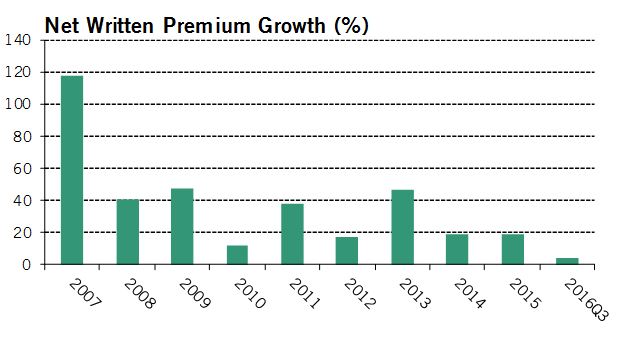
Premium growth declined for the LTM period, coming in at just 4.5% after consistently posting double-digit growth for many years. Although start-up activity remains robust as Citizens continues to shed premium, competition has intensified and placed downward pressure on prices in some markets. Meanwhile, the aforementioned assignment-of-benefits controversy has had a chilling effect on impacted markets, as private insurers grow wary of opening themselves up to lawsuits from contractors for denial of claims. Citizens’ CEO Barry Gilway commented in a September interview with the Sun-Sentinel that “Markets are shutting down in South Florida. New business has no place to go but us (sic). It would not be a smart decision on the part of a CEO to pick up South Florida business until we’ve got legislative remedies for [assignment of benefits].”

Anecdotal evidence also suggests that this practice is spreading into other parts of the state, suggesting that further declines in the rate of premium growth may be in the cards if nothing is done. This topic remains hotly contested between insurers and the litigators filing claims against them, and is likely to be examined by the Florida legislature during the upcoming session. Meanwhile the FHA’s retention ratio remained flat at about 48% of gross premium, virtually unchanged from the level of the past 3 years. Reinsurance pricing has been heavily pressured by the low claims activity of the last several years, and if 2016’s increased losses reverse this situation, it may create incentives for insurers to re-assess their reinsurance programs accordingly.

The average net yield on the FHA’s investments increased marginally during 2016, though the overall level remains largely flat since 2010. This reflects the impact of the FHA’s relatively short-duration bond investments (~70% of holdings in maturities of 5 years or less) and high cash holdings, both driven by a need for ready liquidity in case of sudden uptick in claims. Although it is welcome to see investment yields stable rather than declining, this is largely due to the fact that older investments predating the post-crisis low rate environment have mostly rolled off of insurers’ books, suggesting that even when rates do increase it will take a period of years for portfolio yields to fully adjust as lower-yielding bonds roll off. The rise in rates in late 2016—driven by expected higher inflation and the possibility of multiple Fed rate hikes in 2017—brought some relief, but also reduces the liquidity of existing holdings by moving bonds into an unrealized loss position.

With all that said, bond portfolios are in general prudently invested, with broad diversification across sectors, and duration and quality buckets. Exposure to tax-exempt municipal bonds have grown, with tax-exempt income growing from 6.9% of investment income in 2011 to 14.9% in 2015. Spreads on such bonds exploded higher after the election, and while they’ve reversed much of the move since then, the prospects for changes in corporate tax rates in 2017 suggest that more volatility lies ahead for this important investment sector.

The FHA’s average exposure to unaffiliated common stock investments rose slightly through 9/30 to 10.5%, the highest in recent years. While lower than the overall industry average, this is in keeping with the P&C industry trend towards increased equity exposure.  The strong stock market returns since 2008 have greatly benefited insurers and helped to replace surplus lost in the financial crisis, though the combination of Fed rate hikes, a volatile political environment, and elevated valuation measures suggest that downside risks may finally be lurking below the surface after the seemingly unstoppable rally from the 2009 lows.

Although common stocks are the most common risk asset type held by P&C insurers, Florida homeowners companies prudently hold only about one-third of the exposure of the broader industry, as the elevated risk of concentrated underwriting losses in catastrophe lines is best offset by reduced exposure to relatively volatile investment categories. Conversely, FHA companies hold significant amounts of cash on hand for ready liquidity, with 9/30 exposure little changed at just over 20%. This figure has dropped significantly in recent years, from over 60% in 2007 to the current level. Reasons for such a reduction include improved risk and liquidity management programs, increased participation in the Federal Home Loan Bank (FHLB) system for short-term cash needs, and an attempt to increase investment income and offset low yields by putting idle cash to work during periods of low loss activity.

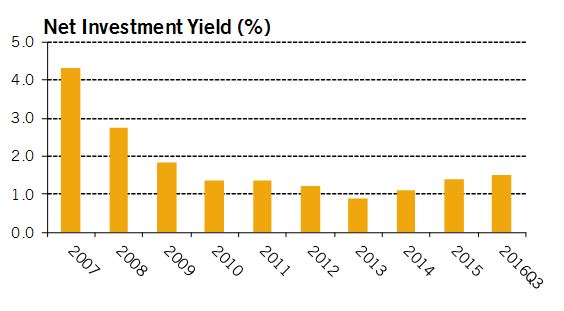
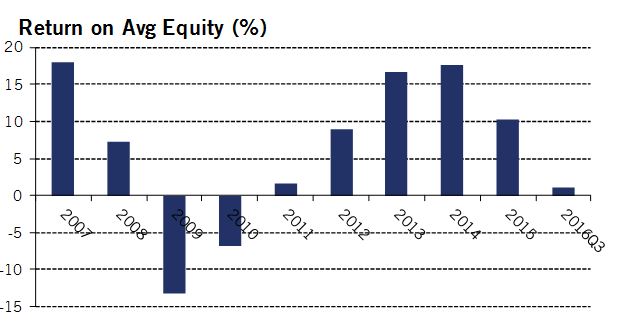
Between unfavorable loss experience and the ongoing low level of investment yields, the FHA achieved a return on equity of just over 1% for the LTM period through 9/30/16. Additional underwriting losses in Q4 may push this figure below zero for the calendar year, though strong equity market returns may partially offset such losses. The period from 2012-2015 was very strong for this industry, thanks to modest storm activity and a booming stock market. Now it appears these tailwinds are fading, and challenges like the assignment-of-benefits controversy and increased pricing pressure from the influx of market entrants could mean a period of lean years lie ahead.

As always, a customized, diversified, and prudently balanced investment strategy is key to both supporting profitable underwriting through stable, predictable interest income, while also growing long-term surplus through strategic allocations to non-core asset classes. AAM has extensive experience advising Florida homeowners insurers on every aspect of investment strategy, and are available to provide a variety of complimentary analyses to companies interested in finding ways to refine and sharpen their portfolios.

AAM’s Florida Homeowners Aggregate is a collection of 28 Florida-domiciled P&C insurers writing primarily Homeowners coverage in the US Southeast region. All financial statement data is sourced from SNL.


Written by:

Peter Wirtala, CFA Insurance Strategist


Disclaimer: Asset Allocation & Management Company, LLC (AAM) is an investment adviser registered with the Securities and Exchange Commission, specializing in fixed-income asset management services for insurance companies. Registration does not imply a certain level of skill or training. This information was developed using publicly available information, internally developed data and outside sources believed to be reliable.  While all reasonable care has been taken to ensure that the facts stated and the opinions given are accurate, complete and reasonable, liability is expressly disclaimed by AAM and any affiliates (collectively known as “AAM”), and their representative officers and employees.  This report has been prepared for informational purposes only and does not purport to represent a complete analysis of any security, company or industry discussed. Any opinions and/or recommendations expressed are subject to change without notice and should be considered only as part of a diversified portfolio. A complete list of investment recommendations made during the past year is available upon request. Past performance is not an indication of future returns. This information is distributed to recipients including AAM, any of which may have acted on the basis of the information, or may have an ownership interest in securities to which the information relates.  It may also be distributed to clients of AAM, as well as to other recipients with whom no such client relationship exists.  Providing this information does not, in and of itself, constitute a recommendation by AAM, nor does it imply that the purchase or sale of any security is suitable for the recipient. Investing in the bond market is subject to certain risks including market, interest-rate, issuer, credit, inflation, liquidity, valuation, volatility, prepayment and extension. No part of this material may be reproduced in any form, or referred to in any other publication, without express written permission.

January 26, 2017 by

[toc]

AAM continues to monitor important regulatory changes affecting the insurance industry. Below we summarize recent developments on policies currently facing significant changes:

NAIC RBC Changes

The NAIC had their latest meeting in December and discussed the status of their plan to increase the number of ratings categories for bonds for RBC calculation purposes. Here are some highlights:

  • After many months of discussion, there does now appear to be a consensus that the granularity of Life bond RBC factors will increase, in the form of an electronic-only column added to Schedule D
  • The specific factors to be used are still subject to revision, but are likely to be broadly in line with those proposed by the American Academy of Actuaries
  • It is likely (though still not finalized) that the increased granularity will also be applied to P&C and Health insurers, though they may have somewhat different factors
  • Beyond the change in factors, the second step in determining bond RBC involves an adjustment based on the number of bonds/issuers in the portfolio. The details of this second step are also being reviewed, and are likely to be changed from the current form to more accurately reflect the impact of diversification on risk of credit losses
  • The NAIC is still targeting year-end 2017 to implement the changes, though some in the industry view this as ambitious
  • The ACLI proposed a materially different (mostly lower) set of expanded factors based on a study they did of historical default and recovery rates, including a recommendation to provide different factors for different bond types (e.g. corporate, muni, etc). This will be reviewed and discussed in future meetings

AM Best BCAR

In November AM Best released their intended adjustments to the BCAR formula for P&C companies. These were largely in line with those described for Life companies earlier in the year (using factors based on DFA modeling, reporting 5 BCAR scores based on confidence intervals instead of a single one, removing the suggested guidance for BCAR vs rating, etc). They intend to collect comments on this release over the winter, make any additional needed adjustments over the summer, and start implementing the new system in late 2017. The bottom line continues to be that in general they do not expect this new process to change existing ratings, though rare exceptions may exist. One notable investment-related feature of the new system is that bond ratings will now be based on a mix of rating and maturity bucket instead of rating alone, though we continue to believe that the most important BCAR contribution of an investment portfolio is through losses of surplus (if any), not the direct impact of the factors themselves.

Tax Reform

It is fairly likely that a federal tax reform bill will be passed in 2017. The single likeliest feature of such a bill is a reduction in corporate rates, and elimination of the AMT is also a possibility. This has already caused some volatility in the muni market, and will likely cause more in the future. We do not recommend accelerating realization of gains/losses as mechanisms exist to carry gains back to previous years anyway, even if 2017’s tax rates decline. We expect to learn more about the shape of this proposal shortly and will provide commentary at that time.

Schedule D Treatment of ETFs

In past NAIC meetings there was debate about the possibility of breaking ETF holdings out into a separate schedule in financial statements, with a field designating the underlying security type. This was resisted as insurers prefer to be able to keep reporting approved bond ETF’s in Schedule D. As a compromise, the current proposal is to show bond ETF’s as a separate bond subgroup on Schedule D. Relatedly, there has been debate about what book value should be for such ETF’s. Both historical cost and market value are viewed as inappropriate. The prevailing proposal is to use a measure called “systematic value”, which may entail somewhat complex calculations. Blackrock has released a paper offering a suggested form of this calculation, but it is possible that the standard could ultimately vary somewhat from state to state. This project is ongoing but could ultimately see adoption in 2017 or 2018.

Somewhat relatedly, a proposal has been made to institute an abbreviated and electronic-only collection of holdings data at mid-year (currently holdings data is only collected at year-end, with trades reported quarterly). This also appears to be acceptable to the industry and likely to be implemented within a year or two. In AAM’s view this will be very helpful for providing up-to-date industry and peer analytics.

Principles-Based Reserving

Although AAM is primarily focused on regulations with direct investment implications, this one is worth noting here given how significant and long-awaited it’s been. Briefly, this is a regulatory change going into effect in 2017 that will allow life insurers broader discretion in how they calculate reserves for life lines (over time the new rules will be extended to cover other lines), in contrast to the current formulaic approach. Among the various goals of the change is to remove the incentives for complex life reinsurance (“XXX/AXXX”) transactions, which were undertaken due to previous formulaic reserving requirements being viewed as punitive by insurers, but also tended to make the industry more opaque and challenging to regulate. Additionally, the greater flexibility of the new rules should make it easier to accommodate new product designs without needing to constantly alter state laws. This change is probably most material for very large life insurers, but over time will likely impact virtually the entire industry.

Solvency II

This is the recently-implemented European insurer risk-based capital regulation, somewhat comparable to NAIC RBC in the US. While we mainly focus on domestic regulation, we mention this here because the Federal Insurance Office announced in September that the US does not intend to modify our own regulation to be able to apply for Solvency II “equivalence” (which, for example, Bermuda has done), putting speculation to rest on this issue. While US and EU insurance regulation may still converge over time, this will only be to the extent that regulators in each country view it as best for their own domestic jurisdiction. That said, in January the US and EU reached an accord on several key areas of insurance regulation, including ending “local presence” requirements for insurers operating outside their home country, and a reduction in collateral requirements for reinsurers conducting cross-border transactions.


Written by:
PeterAWirtala
Peter Wirtala, CFA
Insurance Strategist


Disclaimer: Asset Allocation & Management Company, LLC (AAM) is an investment adviser registered with the Securities and Exchange Commission, specializing in fixed-income asset management services for insurance companies. Registration does not imply a certain level of skill or training.  This information was developed using publicly available information, internally developed data and outside sources believed to be reliable. While all reasonable care has been taken to ensure that the facts stated and the opinions given are accurate, complete and reasonable, liability is expressly disclaimed by AAM and any affiliates (collectively known as “AAM”), and their representative officers and employees. This report has been prepared for informational purposes only and does not purport to represent a complete analysis of any security, company or industry discussed. Any opinions and/or recommendations expressed are subject to change without notice and should be considered only as part of a diversified portfolio. A complete list of investment recommendations made during the past year is available upon request. Past performance is not an indication of future returns.

This information is distributed to recipients including AAM, any of which may have acted on the basis of the information, or may have an ownership interest in securities to which the information relates. It may also be distributed to clients of AAM, as well as to other recipients with whom no such client relationship exists. Providing this information does not, in and of itself, constitute a recommendation by AAM, nor does it imply that the purchase or sale of any security is suitable for the recipient. Investing in the bond market is subject to certain risks including market, interest-rate, issuer, credit, inflation, liquidity, valuation, volatility, prepayment and extension. No part of this material may be reproduced in any form, or referred to in any other publication, without express written permission.

  • « Go to Previous Page
  • Page 1
  • Interim pages omitted …
  • Page 5
  • Page 6
  • Page 7
  • Page 8
  • Page 9
  • Page 10
  • Go to Next Page »

Get updates in your inbox.

  • Investment Strategies
    • Investment Grade Fixed Income
    • Specialty Asset Classes
  • Our Clients
    • Client Experience
    • Sample RFP Download
  • Insights
    • Video
    • Webinar
    • News
    • Podcasts
  • About
    • Our Team
    • Contact
    • Client Login

Disclaimer: Asset Allocation & Management Company, LLC (AAM) is an investment adviser registered with the Securities and Exchange Commission, specializing in fixed-income asset management services for insurance companies. Registration does not imply a certain level of skill or training. This information was developed using publicly available information, internally developed data and outside sources believed to be reliable. While all reasonable care has been taken to ensure that the facts stated and the opinions given are accurate, complete and reasonable, liability is expressly disclaimed by AAM and any affiliates (collectively known as “AAM”), and their representative officers and employees. This report has been prepared for informational purposes only and does not purport to represent a complete analysis of any security, company or industry discussed. Any opinions and/or recommendations expressed are subject to change without notice and should be considered only as part of a diversified portfolio. A complete list of investment recommendations made during the past year is available upon request. Past performance is not an indication of future returns. This information is distributed to recipients including AAM, any of which may have acted on the basis of the information, or may have an ownership interest in securities to which the information relates. It may also be distributed to clients of AAM, as well as to other recipients with whom no such client relationship exists. Providing this information does not, in and of itself, constitute a recommendation by AAM, nor does it imply that the purchase or sale of any security is suitable for the recipient. Investing in the bond market is subject to certain risks including market, interest-rate, issuer, credit, inflation, liquidity, valuation, volatility, prepayment and extension. No part of this material may be reproduced in any form, or referred to in any other publication, without express written permission. *All figures shown are approximate and subject to change from quarter to quarter. **The accolades and awards highlighted herein are not statements of any advisory client and do not describe any experience with or endorsement of AAM as an investment adviser by any such client.

Copyright © 2024 AAM | Privacy and Disclosures

  • LinkedIn
  • YouTube