• Skip to primary navigation
  • Skip to main content
  • Skip to footer
AAM CompanyTransparent Logo

AAM Company

AAM Company Website

  • Investment Strategies
    • Investment Grade Fixed Income
    • Specialty Asset Classes
  • Clients
    • Our Clients
    • Client Experience
    • Download Sample RFP
  • Insights
    • Video
    • Webinars
    • Podcasts
    • News
  • About
    • Our Team
    • Events
  • Login
  • Contact Us
Contact

Featured

June 15, 2016 by

What does a Leave vote likely mean?

• Considerable volatility in risk assets globally 
• Likely recession in the UK
• Actual transition out of the EU taking 5 to 10 years

brexit-shutterstock2

As the June 23rd UK referendum on whether to leave the EU (colloquially termed Brexit) approaches, we thought it worthwhile to address recurring client questions about the implications of a Leave vote.

At the time of publication, multiple polls indicate the Leave camp has pulled ahead of the Remain camp. We believe that a Leave vote would be more consequential in the near-term, so we wanted to examine potential effects of the same.

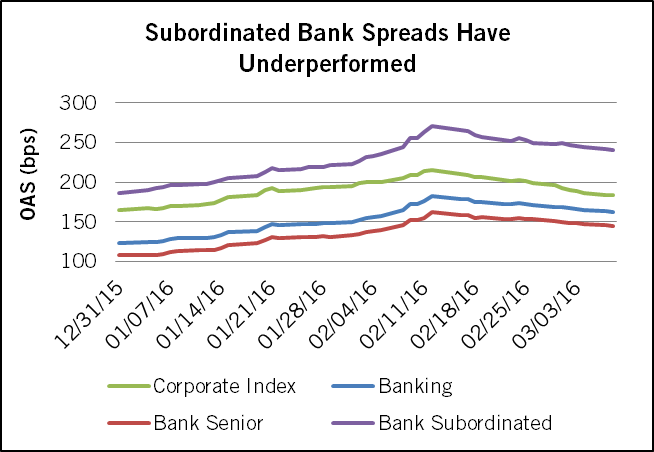
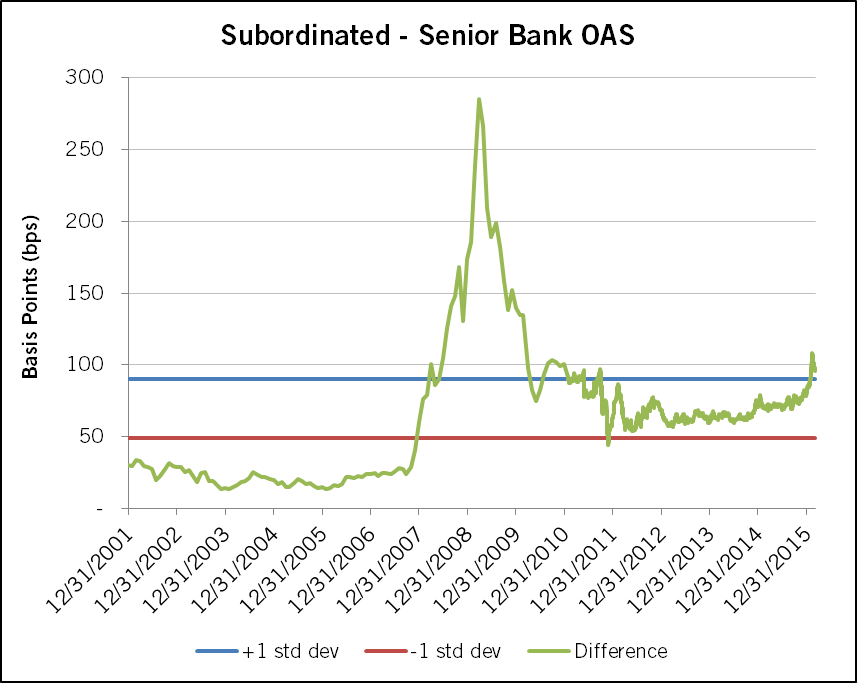
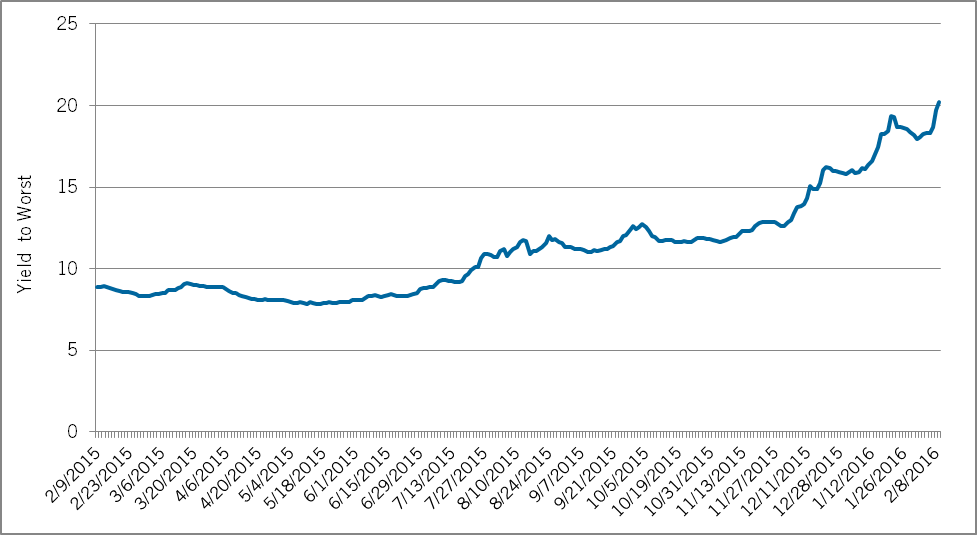
The immediate impact would likely be a continuation of recent trends in financial markets; the Pound has been weakening since May and in the past week GBP risk assets have been selling off. Interestingly, the UK Gilt market has rallied over the past two months and has outperformed both UST and Bunds market, despite some speculation that it would underperform relative to other developed sovereign curves. We would expect considerable volatility in risk assets globally and particularly in the UK and EU in the event of a Leave vote. There is potential for disruption in the money markets as well, with a potential for a buyers’ strike in relation to UK and European banks, but many of the liquidity programs put in place by the BOE, ECB and the Fed in response to the 2011/12 Eurozone crisis remain in place, so we remain sanguine about systemic liquidity.

In the intermediate-term, the bigger concern is macro-political. The most likely outcome of a Leave vote would be a UK recession, as continued GBP weakening and re-negotiated trade/tariff treaties with the EU put pressure on an already large current account deficit. Business sentiment surveys have already begun to highlight unwillingness by UK businesses to engage in major capital investments until the outcome of the referendum is known. While the BOE MPC would likely provide systemic liquidity support, we are uncertain of ability/willingness to support the UK economy via monetary policy, particularly if a weakening GBP aggravated already rising inflation. Given the size of its economy, a UK recession will likely affect other countries within and outside of the EU.
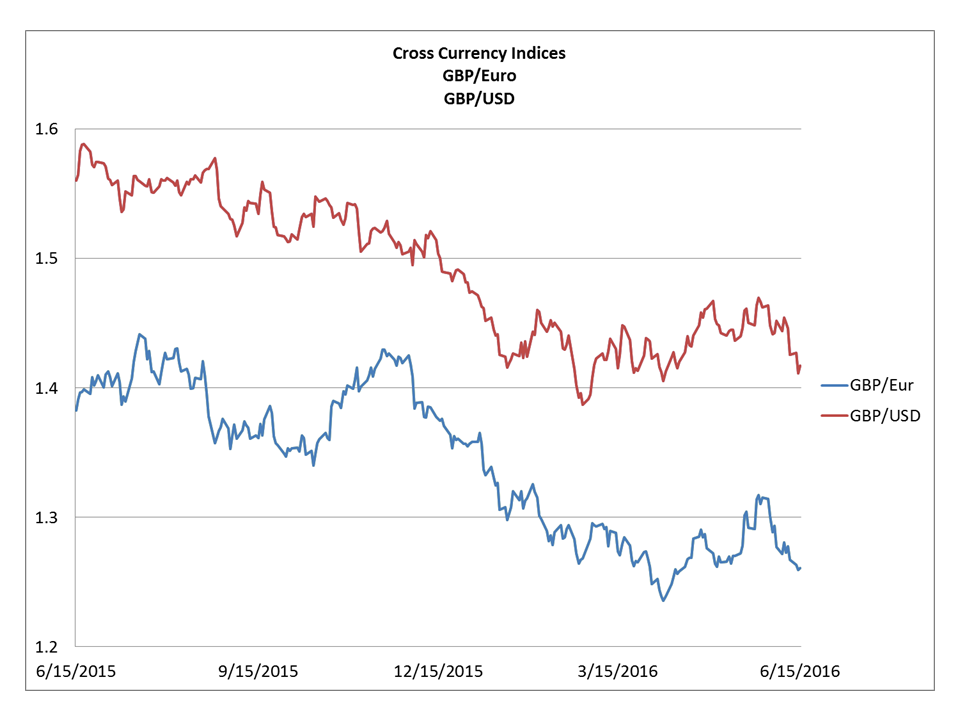
GBP Graph

Source: Bloomberg

Following a Leave vote, there would then be a two year period to negotiate a managed exit from the EU following a formal submission of resignation by the UK. Importantly, trade/tariff agreements, visa/border control, environmental treaties and financial services regulations would all need to be recast from the EU model to a bilateral agreement between the EU and an independent UK. The WTO framework, as well as the treaties that govern the relationship between non-EU members Switzerland and Norway provides some framework for what these treaties could look like. However, there may be meaningful political resistance to providing any sort of preferential treatment to the UK by the remaining EU members (as well as an incentive to make the UK “suffer the consequences” as a warning to other EU members that are considering an exit). Additionally, Norway and Switzerland’s tight relationship to the EU are based on their acceptance of most of the treaties that form the basis for the EU (financial regulations/EU judicial review/migration), which are precisely the biggest points of contention for the Leave supporters in the UK. Assuming a successful exit negotiation over two years, the actual transition out of the EU could take 5-10 year,

Domestically, the failure of the Remain campaign would likely result in a leadership fight in the Tory Party, and potentially a general election if the government falls. In addition, a UK departure from the EU would likely precipitate another Scottish referendum to remain in the EU. And finally within the EU, the success of a Leave vote might bolster the prospects of other EU skeptic political movements (National Front in France/Podemos in Spain).

Banks/Finance would likely be the most impacted sector in the wake of a Leave vote. Global banks would have to decide whether to retain their London offices as their European capital markets headquarters or shift to an EU domicile (Frankfurt/Paris/Amsterdam). RBS would likely re-domicile to London (UK Treasury still controls). HSBC likely faces the largest questions about restructuring/retaining its UK business and domiciling its capital markets businesses. Separate from the banking sector, UK domiciled corporates may come under pressure to the extent that they have significant non-GBP liabilities or cost base, and UK listed corporations may be subject to increased M&A on the basis of lower GBP and equity valuations.

Finally, consideration of a Remain vote should not be disregarded. Polling suggests that the outcome is likely to be close, and a narrow Remain vote suggests that the Tory party leadership would be in a weakened position even though they have nominally succeeded. The UK, which has always held itself at a distance from the EU, has clearly engendered ill will in the rest of the EU members in the run-up to the referendum (as evidenced by increasingly sharp public comments from member nations). As a result, even in the event of a Remain vote, we see the stability of the EU shaken.

Written by:

NSebastianBacchus

Sebastian Bacchus, CFA
Senior Analyst, Corporate Credit

Disclaimer: Asset Allocation & Management Company, LLC (AAM) is an investment adviser registered with the Securities and Exchange Commission, specializing in fixed-income asset management services for insurance companies. This information was developed using publicly available information, internally developed data and outside sources believed to be reliable. While all reasonable care has been taken to ensure that the facts stated and the opinions given are accurate, complete and reasonable, liability is expressly disclaimed by AAM and any affiliates (collectively known as “AAM”), and their representative officers and employees. This report has been prepared for informational purposes only and does not purport to represent a complete analysis of any security, company or industry discussed. Any opinions and/or recommendations expressed are subject to change without notice and should be considered only as part of a diversified portfolio. A complete list of investment recommendations made during the past year is available upon request. Past performance is not an indication of future returns.
This information is distributed to recipients including AAM, any of which may have acted on the basis of the information, or may have an ownership interest in securities to which the information relates. It may also be distributed to clients of AAM, as well as to other recipients with whom no such client relationship exists. Providing this information does not, in and of itself, constitute a recommendation by AAM, nor does it imply that the purchase or sale of any security is suitable for the recipient. Investing in the bond market is subject to certain risks including market, interest-rate, issuer, credit, inflation, liquidity, valuation, volatility, prepayment and extension. No part of this material may be reproduced in any form, or referred to in any other publication, without express written permission

May 2, 2016 by

Relative value performance for tax-exempts were volatile during the first quarter of 2016. Tax-adjusted yield spreads to Treasuries for 10-year maturities dropped as low as 40 basis points (bps) during the first week of the year, before widening to a 91 basis points (bps) spread by the first week of March. Most of this volatility in relative performance was a direct result of the rapidly shifting supply/demand imbalances within the sector, combined with a substantial flight-to-quality rally for Treasuries. Although both sectors benefited from the “risk-off” demand, Treasury rates during the quarter fell by 50 basis points (bps), while municipal yields fell by only 22 basis points (bps).

During January, in addition to the flight-to-quality trading that developed, tax-exempt performance also benefited from very strong seasonal technicals that typically occurs during the first two months of the year. A combination of robust reinvestment flows and a dearth of new issuance supply helped push tax-adjusted spread levels to Treasuries to a near ten year low on January 7 of 40 basis points (bps). Spreads remained at these overbought levels for most of January before crossover investors started selling aggressively. In addition to the selling pressure, tax-exempt new issue supply started to see a considerable rebound from levels exhibited over the prior five months. After new issuance averaged only $27 billion per month from September 2015 to January 2016, average supply for February and March increased by 30%.

February issuance came in relatively heavy at $31 billion. That was an increase of 22% relative to the 10 year average for February supply. Supply in March was also heavy at $39.3 billion, with refinancing activity leading the way at $16 billion. During February and March, refinancings averaged $14.45 billion, resulting in an increase of 76% versus the monthly average over the prior 5 month period. During the fourth quarter of 2015, municipalities scaled back their refunding activity in an attempt to avoid any potential market volatility surrounding the timing of the Federal Reserve’s first expected move towards normalizing rates. With that event now past and the market demand for tax-exempts exceptionally strong, issuers have started to take advantage of the low absolute rate environment during the quarter.

Weaker supply Technicals are expected to remain in place for the next 2.5 months. As of April 11, 2016 10 year municipal rates were at 1.59%, which remains at a very compelling level for issuers to continue targeting debt service savings through refinancings. Additionally, infrastructure-related financings have been on the rise this year. On a year-to-date basis, new issuance classified as “new money” is up 27% versus 2015. The combination of these two components are expected to help the market produce a total of $80 billion in issuance in May and June, and potentially provide for very compelling entry points for a sector rotation move into the tax-exempt sector. At the moment, tax-adjusted spread levels for 10 year maturities stands at 50 basis points (bps), which we view as expensive heading into the expected supply surge. We are currently positioning accounts to an underweight exposure to the sector until compelling opportunities present themselves that warrant a move to a neutral or overweight bias.

Written by:

GregoryABell

Gregory A. Bell, CFA, CPA
Principal and Director of Municipal Products

Disclaimer: Asset Allocation & Management Company, LLC (AAM) is an investment adviser registered with the Securities and Exchange Commission, specializing in fixed-income asset management services for insurance companies. This information was developed using publicly available information, internally developed data and outside sources believed to be reliable. While all reasonable care has been taken to ensure that the facts stated and the opinions given are accurate, complete and reasonable, liability is expressly disclaimed by AAM and any affiliates (collectively known as “AAM”), and their representative officers and employees. This report has been prepared for informational purposes only and does not purport to represent a complete analysis of any security, company or industry discussed. Any opinions and/or recommendations expressed are subject to change without notice and should be considered only as part of a diversified portfolio. A complete list of investment recommendations made during the past year is available upon request. Past performance is not an indication of future returns.

This information is distributed to recipients including AAM, any of which may have acted on the basis of the information, or may have an ownership interest in securities to which the information relates. It may also be distributed to clients of AAM, as well as to other recipients with whom no such client relationship exists. Providing this information does not, in and of itself, constitute a recommendation by AAM, nor does it imply that the purchase or sale of any security is suitable for the recipient. Investing in the bond market is subject to certain risks including market, interest-rate, issuer, credit, inflation, liquidity, valuation, volatility, prepayment and extension. No part of this material may be reproduced in any form, or referred to in any other publication, without express written permission.


March 17, 2016 by

A.M. Best recently released its long-awaited draft guidelines for the major reforms they are making to the Best’s Capital Adequacy Ratio. In this paper, AAM Insurance Strategist Pete Wirtala summarizes the biggest changes, and offers resources for those wanting a more detailed review. AAM will continue to monitor this project as it proceeds and provide periodic updates.


A.M. Best has recently been evaluating a suite of changes to their Best’s Capital Rating Methodology for insurers, most particularly affecting how the Best’s Capital Adequacy Ratio (“BCAR”) score will be calculated. It released presentations in April and October of 2015 outlining these changes and the reasons for making them. More recently on March 10, 2016 it released a draft document describing the new process entitled “Understanding Best’s Capital Adequacy Ratio For P&C insurers” for a comment period, and will shortly start sending rated companies sample calculations of it’s BCAR scores under the new system using 2014 data (Life/Health insurers should expect similar releases later in 2016). Key changes to the BCAR formulas include:

  • While BCAR has historically been calculated as Adjusted Surplus divided by Net Required Capital (i.e., the estimated capital required to support the company’s risk profile), the new proposed calculation takes the difference between Available Capital and Net Required Capital, and divides the result by Available Capital. This simplifies the interpretation of the score, as a score above zero indicates a surplus of available capital over the calculated requirement, while a negative score suggests a deficit.
  • In addition to the seven factors traditionally used to calculate Net Required Capital for P&C insurers, an eighth factor for Catastrophe Risk has been added. This factor is not included in the covariance adjustment (which has also undergone some changes), reflecting Best’s view that an insurer must be able to absorb catastrophe losses independently of all other risks they face.
  • Companies will no longer receive a single BCAR score, but rather a table of five scores representing five different statistical confidence intervals. Relatedly, a number of the specific risk factors will now use statistical modeling techniques to generate distributions of capital requirements rather than single point estimates. This will allow BCAR to illustrate tail risk exposure, and increase the utility and transparency of the analysis. The following graph was included in the latest materials to illustrate how scores could be presented going forward:

BCAR1

         Source: A.M. Best’s Credit Rating Methodology (March 10, 2016)

  • Given the above changes, overall BCAR scores will be significantly lower under the new system. This does not mean ratings will necessarily change (Best has announced that it “does not expect sweeping ratings changes” and that its “assumption is that current ratings are appropriate”). However, Best also plans to phase out their guidance regarding the relationship between BCAR scores and financial strength ratings; it previously published a graph with indicative scores for each rating, but have now decided that this is no longer appropriate given the numerous other factors outside the BCAR score that affect ratings decisions. In addition to balance sheet strength (of which BCAR is just one measure), Best also cite operating performance, business profile, enterprise risk management, and rating enhancement/drag from affiliated companies as other critical factors in assigning a rating.

The above is just a short overview of some of the largest changes being proposed. We encourage all P&C insurers to obtain the draft materials and review them closely, and to provide A.M. Best with their feedback and suggestions.  All the materials mentioned above are available on the A.M. Best website www.ambest.com, or you can also contact AAM and we will forward them along.  Additionally, A.M. Best is holding free webinars to review the draft materials on March 18, 2016 and on March 21, 2016 for all interested parties.  Life and Health insurers may also be interested in reviewing the materials as a preview of the kinds of changes they can expect to see in their own BCAR calculations when that information is released later this year.

Written by:
PeterAWirtala
Peter Wirtala, CFA
Insurance Strategist

March 10, 2016 by

The Bank sector has experienced a reversal of its strong relative performance vs. the Corporate Index during the first quarter of 2016.  In this white paper, AAM’s bank analyst examines the drivers of performance in the sector and looks at trades that have outperformed during the recent volatility.


In fiscal year 2015, the Bank sector was one of the best performing subsectors of the Barclays Capital U.S. Corporate Investment Grade Index (“the Index”), reflecting strong capital, improving asset quality and expectations of an impending rate hike cycle.

This trend reversed abruptly in the first two months of 2016 with banks participating in the sharp acceleration of negative excess returns in the Index. As of February month end, the bank sector had generated year-to-date negative excess returns of -227 basis points (bps) as compared to -248 bps for the Index. While broad corporate bond performance has retraced some of this performance in March, the bank sector has actually lagged the overall Index, having generated 40 bps of positive excess returns month-to-date vs. 94 bps for the Index.

However, a more granular examination of the performance in the bank sector better illustrates what trades have helped or hurt performance in the space. If we break out performance of senior bank bonds vs. subordinated bonds (the latter representing the riskier portion of the bank capital structure), it quickly becomes clear that the bulk of the negative excess returns were driven by the subordinated bonds (-498 bps through February). In contrast, senior bank bonds actually outperformed the Index with negative excess returns of -163 bps through February (Exhibit 1).

Exhibit 1:

GBR1

          Source: Barclays, AAM

Additionally, the performance in the bank sector has been depressed by the non-domestic (Yankee) banks (-203 bps excess returns YTD for Yankee banks vs. -186 bps for banks overall). The negative performance in Yankee banks was driven in particular by the sharp sell-off in European banks in February as fears about capital adequacy and the ability to continue paying coupons on capital securities were sparked by poor financial results and diminished return on equity prospects for several of the continent’s largest banks (Deutsche Bank, Credit Suisse and Unicredit were all subject to material sell-offs).

Anecdotally, many total return managers were also hurt by their overweighting of Additional Tier 1 /Contingent Convertible (CoCo) securities, which represents an investment in the most junior layer of the bank capital structure. While CoCos are not included in the Index (because they are generally not investment grade rated), they generated very strong performance in fiscal year 2015 (+6.3% total return), and were a top recommendation of most sell-side credit strategists heading into 2016. However, through February AT1/CoCos delivered a -8.6% total return as fears about coupon sustainability grew.

So how is AAM positioned within the bank space?

We have been overweight the bank sector since mid-2009 based on improving fundamentals and an increasingly benign economic outlook. However, within the bank sector we have retained a strong preference for senior vs. subordinated bonds, reflecting a preference for downside protection and a desire for clarity on Total Loss Absorbing Capacity/Capital (TLAC) rules. We have also increasingly weighted regional and community banks vs. universal banks, reflecting the potential for increased issuance by universal banks to meet TLAC minimum debt requirements, as well as our view that the traditional banking model of the regional space was likely to have better fundamental momentum in a slow growth environment and less residual regulatory liability.

Finally, we have been underweight Yankee banks, and particularly European banks, since macro-political instability in Greece, Italy and Spain sparked the European sovereign crisis in 2011. Although fears of a Euro or EU break-up have receded somewhat, we have remained underweight as we feel the underlying causes of that crisis (lack of political consensus and stagnant economic growth) remain unresolved. Additionally, we view the European universal banks as having a much greater restructuring burden with regard to meeting TLAC requirements as compared to the U.S. universal banks.

While our underweight to subordinated debt and Yankee banks constrained investment performance during 2014 and 2015, the benefits of this credit selection can be seen in the downside protection in periods such as the first quarter of 2016. Conversely, we began selectively investing in subordinated bank debt of the U.S. universal banks in late February, as we felt that the spread widening over the previous two months had made certain credits attractive given our fundamental outlook (Exhibit 2).

Exhibit 2:

GBR2

Source: Barclays, AAM

Written by:
NSebastianBacchus
N. Sebastian Bacchus, CFA
Senior Analyst, Corporate Credit


For more information, contact:

Colin T. Dowdall, CFA
Director of Marketing and Business Development
colin.dowdall@aamcompany.com

John Olvany
Vice President of Business Development
john.olvany@aamcompany.com

Neelm Hameer
Vice President of Business Development
neelm.hameer@aamcompany.com

March 7, 2016 by

The start of the year ushered in a heightened level of spread volatility.  Markets reacted to lower commodity prices and an increased risk of a global recession.  The Investment Grade Corporate market experienced spread widening of 50 basis points at the wide point in mid-February.  Defensive industries have outperformed, with non commodity sectors contributing more to the market widening this year. 


Is It Over?

As of early March, the market has recovered about half of that widening due to the bounce in commodities and more favorable economic data. The economic data points we follow have signaled a slight improvement from the deterioration we have seen since September 2015. Market anxiety remains in regards to China, “Brexit,” and the trajectory of commodity prices. AAM entered the year expecting volatility to be higher and economic growth to be lower than expected but not negative. We have been communicating that we believe we have been in the late stage of the credit cycle since mid-2014. After reviewing fourth quarter results and listening to earnings calls during which management teams provides their guidance for the year and discuss capital allocation, we do not believe the cycle has turned, and thus, do not expect Investment Grade credit spreads to meaningfully tighten.

Fundamentally, credit risk is elevated. At a market or median level and excluding commodity related sectors, revenue and EBITDA growth rates remain abysmal. There are certainly exceptions at an industry level. We highlight sectors such as Pharmaceuticals that are expected to grow nicely this year. That sector is one we expect will continue to be active with mergers and acquisitions, and we anticipate attractively priced new debt issues to be the result.

During earnings calls, we did not hear management teams become more balance sheet focused unless they were in the midst of deleveraging from a prior transaction or in a stressed sector like Energy. We heard much of the same – cash flow and capital allocated to share repurchase programs, increased dividends, and the pursuit of M&A opportunities. With the cost of debt still well below the cost of equity, we don’t anticipate a change. Until markets reprice risk, we expect to remain in this trading range, more likely resetting higher as economic risk increases given the tightening of financial conditions.

Is There Value in the Investment Grade Market Today?

Yes. We entered the year, expecting the corporate OAS to trade within a range of 145-215 basis points (“The Future Ain’t What It Used to Be” – AAM 2016 Investment Outlook), and we remain on the wider end of that range. We highlight the following opportunities:

1. New debt issuance from:

a. issuers funding M&A transactions that we project will add value to the enterprise

i.Examples include credits in the Beverage and Pharmaceutical industries (Anheuser-Busch InBev N.V. (ABIBB), Molson Coors Brewing Company (TAP), Teva Pharmaceutical Industries Limited (TEVA), Pfizer, Inc. (PFE), Mylan N.V. (MYL))

b. high quality companies financing share repurchase programs

i. Examples include companies with stable cash flows and a sensitivity to credit quality because of their need to fund working capital (Lowe’s Companies, Inc. (LOW), Wal-Mart Stores, Inc. (WMT), 3M Company (MMM), Walt Disney Company (DIS))

c. high quality credits in sectors that have cheapened with the increasing risk of recession and “lower for longer” interest rates

i. Examples include Autos, Retail, Insurance Brokers, Banks (subordinated)

2.  Secondary opportunities in credits with the financial flexibility to maintain investment grade ratings in a downside scenario. We also note the improvement in value on the short end of the corporate curve (1-5 years) relative to the last five years (Exhibit 1).

Exhibit 1:

CCV 1B

 Source: Barclays and AAM

We do not see value everywhere; however, and are largely avoiding sectors and credits we believe are most vulnerable in a low growth environment.  The Technology sector is one that has raised a lot of debt and now faces lower return prospects.  We are avoiding credits rated BBB in that sector.  Another is Healthcare REITs, a sector we have avoided because of concerns about rapid consolidation and competition amongst the largest operators, and given our view that not all of the operators will thrive once the sector stabilizes.  We are also cautious about the aggressive push into operating businesses under RIDEA (REIT Investment Diversification and Empowerment Act) by the largest Healthcare REITs.  Lastly, the Food and Consumer Products sectors are filled with household names that have failed to execute and are vulnerable to shareholder activist pressure or debt financed M&A to increase shareholder returns.  Looking at various spreads in these sectors (Exhibit 2), we fail to find value in the single-A rated credits vs. Industrial peers.  For BBB Tech and Healthcare REITs, we believe the rationalization that needs to occur will push spreads wider, towards BB levels.

Exhibit 2:

CCV 2B
Source: Barclays (as of 2/29/16), AAM [Note: Total = Barclays Industrial sector]


For more information, contact:

Colin T. Dowdall, CFA
Director of Marketing and Business Development
colin.dowdall@aamcompany.com

John Olvany
Vice President of Business Development
john.olvany@aamcompany.com

Neelm Hameer
Vice President of Business Development
neelm.hameer@aamcompany.com


Disclaimer: Asset Allocation & Management Company, LLC (AAM) is an investment adviser registered with the Securities and Exchange Commission, specializing in fixed-income asset management services for insurance companies. This information was developed using publicly available information, internally developed data and outside sources believed to be reliable. While all reasonable care has been taken to ensure that the facts stated and the opinions given are accurate, complete and reasonable, liability is expressly disclaimed by AAM and any affiliates (collectively known as “AAM”), and their representative officers and employees. This report has been prepared for informational purposes only and does not purport to represent a complete analysis of any security, company or industry discussed. Any opinions and/or recommendations expressed are subject to change without notice and should be considered only as part of a diversified portfolio. A complete list of investment recommendations made during the past year is available upon request. Past performance is not an indication of future returns.This information is distributed to recipients including AAM, any of which may have acted on the basis of the information, or may have an ownership interest in securities to which the information relates. It may also be distributed to clients of AAM, as well as to other recipients with whom no such client relationship exists. Providing this information does not, in and of itself, constitute a recommendation by AAM, nor does it imply that the purchase or sale of any security is suitable for the recipient. Investing in the bond market is subject to certain risks including market, interest-rate, issuer, credit, inflation, liquidity, valuation, volatility, prepayment and extension. No part of this material may be reproduced in any form, or referred to in any other publication, without express written permission.

February 18, 2016 by

We believe investors should be aware of distressed exchanges given the increased number of fallen angels in the energy space and the negative influence that this liability management tool is having on bond prices and the high yield sector. In the following pages, we detail how an exchange typically takes place and why they are becoming more prevalent. We also provide a list of items that investors must consider when evaluating an exchange offer, review how the exchanges are influencing the high yield market, and review past exchanges. Unfortunately, there is no template for investors to use when deciding to exchange or not. Each exchange is unique, and a careful evaluation of many factors is necessary. This opinion is supported by the ultimate success of an exchange, which is slightly greater than 50/50 according to a New York University study1.


Distressed Debt Exchange Description

 In a distressed debt exchange (DDE), a company proposes that existing debt holders take a haircut on their principal amount in exchange for moving up in payment priority in the form of secured debt. Generally, a distressed exchange is proposed by a company to avoid a bankruptcy, improve liquidity, reduce debt, manage its maturity dates (by exchanging debt securities that are coming due for debt securities with an extended maturity) and to reduce or eliminate onerous covenants.

For example, XYZ Company has $100 million principal of 7.0% senior unsecured bonds due June 30, 2018. Due to market conditions, these distressed bonds are trading for $30, yielding 66% with a par value of $100. The company has little liquidity and external capital options are limited, so refinancing or repaying this upcoming maturity is doubtful. In order to avoid a costly bankruptcy, XYZ may offer to its bond holders the chance to exchange 100% of its 7.0% senior unsecured bonds maturing in 2018 for 80% of the original principal for new, 8% secured second lien debt maturing June 30, 2022. The new second lien debt will be issued at $50; yielding 25% based on peer trading levels and have a par value of $100. If all $100 million of principal is exchanged, the issuer will have eliminated the need to refinance in the near term (from 2018 to 2022), delayed a bankruptcy, reduced debt by $20 million (from $100 million to $80 million, also known as a Cancellation of Debt), and reduced annual interest expense by $0.6 million ($100 million x 7% – $80 million x 8%). Investors will forgo $20 million of principal, but will move to a secured position in the capital structure and see the price of its holding increase to $50 from $30. A secured position offers higher recovery values relative to an unsecured position if the company were to ultimately file for bankruptcy (See Exhibit 1).

Exhibit 1:
DD - Ex 1
Source: AAM

The rating agencies play a role in DDEs as well. Based on their respective methodologies, if the exchange is viewed as effectively allowing the issuer to avoid bankruptcy or payment default, the rating agencies will take action to reflect the loss expected to be incurred by participating debt holders (e.g., Caa3, Ca, or C, using Moody’s scale). Otherwise, the agency will view it to be an opportunistic refinancing. Moody’s explains that often, the rating of the issuer is the determining factor of whether or not it is opportunistic. Debt exchanges from issuers rated B1 and higher are typically deemed as opportunistic refinancings vs. those rated Caa1 being viewed as distressed exchanges. This likely causes companies to pull forward the timing of the DDE, so the downgrade is less onerous.

Why are They Being Discussed Now?

DDEs are not new and have been used for decades. They have become more common in the last year following the surge in distressed energy companies. In fact, we are aware of at least a dozen energy companies that have employed this tactic since the beginning of 2015. Upon the completion of a DDE, the issuer will likely have reduced total debt and interest expense without using cash, thereby improving its credit profile modestly.

Reduced cash flows combined with inflated capital structures have contributed to an increase in liability management as a tool to delay or prevent a costly Chapter 11 default. In the Energy sector, lower commodity prices reduce companies’ borrowing bases, since banks use frequently updated asset values based on discounted cash flow analysis to determine borrowing-base availability. These updates, which generally occur every six months, are known as redeterminations. Exploration and Production (E&P) companies with unhedged production volumes leave themselves entirely exposed to low commodity prices, and risk significant borrowing-base reductions when the redetermination takes place. Banks generally give E&P companies some time to improve their liquidity, rather than take over the E&P assets themselves, but will take action if necessary.

Additionally, there are tax reasons for the increased use of this tool. Historically, if companies repurchased bonds at a discount, the difference between the par amount and the purchase price was a gain and taxed accordingly, significantly offsetting the benefits of the exchange. However, this changed in 2009 when the American Reinvestment and Recovery Act allowed deferral of most cancellation of debt (COD) income for five years and then allowed amortization of that COD over a five year period. Presently, section 108(a) of the Tax Code provides that in insolvency and bankruptcy the COD income is permanently excluded from taxation.

Evaluating a DDE Offer

When faced with a DDE offer, an investor must first determine the probability of default. Analyzing the issuer’s existing liquidity and the amount of time that the company can operate in the existing stressed environment should provide direction on whether or not a default is likely in the near term. If the investor is confident that a bankruptcy is unlikely and the issuer is simply attempting to take advantage of market conditions to reduce leverage via an exchange, then declining the exchange is the best course of action.

If a bankruptcy is more likely, investors should closely analyze and stress the company’s cash flows and multiples to determine a reasonable amount of debt that the company could support and receive court approval to emerge from Chapter 11. If the restructured company will only be able to support the amount of senior secured debt being offered as part of the exchange, then accepting an exchange offer should be strongly considered.

DDEs are usually voluntary and some holders of the debt may not exchange, which presents a holdout issue that investors must consider when deciding whether or not to accept the exchange offer. Importantly, debt exchange offers may be conditioned on the tender of a high percentage (e.g., 90% or more) of the debt sought in the offer. Such a minimum condition can provide comfort to holders who may otherwise be wary of exchanging debt securities at a discount if other holders who do not participate will reap the economic benefits of the exchange (i.e., the borrower’s improved balance sheet and ability to pay debts) without the cost. A minimum condition provides assurance that there will be, at most, a limited number of such free riders. Additionally, debt exchange offers can be structured to include various incentives such as secured debt and early tender premiums to holders to participate. Moreover, debt exchange offers can be combined with consent solicitations that propose, through an indenture amendment, to strip covenants and other protections from the debt sought in the exchange offer.

Another item to evaluate when considering an exchange is the influence of credit default swaps (CDS) owners on the issuer. Holdouts and the acceptance rate of the exchange will certainly be affected by those investors who own CDS. Bondholders that buy protection under CDS will be incentivized to force the issuer into bankruptcy in order to collect under their CDS contracts and therefore will likely not participate in efforts by the issuer to improve liquidity, extend maturities or reduce debt. The problem is increased if an issuer requires a high acceptance rate in order to make the debt exchange offer economically viable.

A final consideration in the exchange decision is estimating what liquidity there will be for the non-exchanged unsecured bonds. A significantly reduced total issue size will reduce liquidity of that issue, negatively affecting prices and likely incentivize holders to exchange. However, this concern is somewhat mitigated for holders of debt maturing prior to the secured notes offered as part of the exchange. The logic is that the improved credit profile of the issuer subsequent to the exchange could actually improve the likelihood that the original debt will be repaid. It will obviously mature first and the total funds required to repay or refinance the original debt that remains outstanding will be reduced significantly due to the exchange.

Influence on Today’s Market

We believe the threat of more DDEs with potentially new senior secured debt has contributed to rapidly declining prices in the high yield energy market (Exhibit 2) for two reasons. The first result of this potential threat is an increase in the number of sellers of any issuer that has capacity to take on senior secured debt, regardless of whether or not there is an impending need for liquidity or solvency issue. The second result is that there are few investors willing to buy unsecured debt given the lack of confidence in the future capital structure of the investment. We believe this environment will persist until unsecured investors involved in exchanges demand more favorable terms, issuers provide assurances that there is no need for an exchange in the foreseeable future, and/or macroeconomic conditions improve.

Exhibit 2: High Yield Energy Yield to Worst

DD - Ex 2Source: Bank of America Merrill Lynch High Yield Energy Index (HOEN)

Evaluation of DDEs

We believe that the success of a distressed exchange should be viewed from the perspectives of the original investor, the distressed investor and the issuer. It is too early to determine the outcome of the exchanges from the investors’ perspectives in the recent energy related transactions. However, it appears as though those companies have merely delayed the inevitable default at this point, which probably favors those investors that accepted the exchange offer.

If a DDE is eventually followed by a bankruptcy, the restructuring efforts could be characterized as unsuccessful. However, we believe that the exchanges have achieved several of the companies’ goals. The exchanges have in fact partially extended near term maturities, reduced total debt and interest expense, allowing the companies to postpone a costly default in hopes of a recovery in the operating environment.

Studies of the outcomes of previous exchanges have to be viewed cautiously because few such transactions have taken place. Out of 57 DDEs to take place from 1984- 2008, 26 (46%) were followed by a bankruptcy filing (20 Chapter 11 reorganizations and six Chapter 7 liquidations), seventeen (30%) firms were eventually acquired, while 11 (24%) were still operating in 2009 (Exhibit 3). Additionally, the recovery rate of the exchanged debt that eventually defaulted was 52%, whereas, the recovery rate for the 875 non-DDE defaults in that same period was 42%.

Exhibit 3: Subsequent Development of Distressed Exchanges (1984 – 2007)

DD - Ex 3   Source: The Reemergence of Distressed Exchanges in Corporate Restructurings  (2009), AAM

Conclusion

Market participants believe debt exchanges are going to accelerate in the upcoming year as distressed energy companies attempt to reduce debt, improve liquidity, and delay a costly bankruptcy. Other companies may seek to take advantage of the weak environment and offer an exchange despite not having a liquidity or solvency issue in the near term. We have outlined several critical factors to analyze when deciding to accept an exchange offer or decline. We believe this knowledge prepares us to make disciplined investment decisions in the event we are faced with deciding against an exchange offer or accepting less than the original promised principal.

Written by:

PatrickJMcGeever
Patrick McGeever
Senior Analyst Corporate Credit


1 Edward I. Altman and Brenda Karlin, “The Reemergence of Distressed Exchanges in Corporate Restructurings,” (March 2009) accessed February 11, 2016, https://people.stern.nyu.edu/ealtman/Reemergence%20of%20Distressed%20Exchanges.pdf
2 Edward I. Altman and Brenda Karlin, “The Reemergence of Distressed Exchanges in Corporate Restructurings,” (March 2009)
Lenny Aizenman et al., “Distressed Exchanges: Implications for Probability of Default Ratings, Corporate Family Ratings and Debt Instrument Ratings,” Moody’s Global Corporate Finance, (March 2009)
3 Ze’-ev D. Eiger et al., Liability Management Handbook 2015 Update, International Financial Law Review, 82, accessed February 11, 2016, https://media.mofo.com/files/Uploads/Images/MofoLiabMan.pdf
4 “Debt Exchange Offers in the Current Market,” The Bankruptcy Strategist, Law Journal Newsletters, Volume 26, Number 9 (July 2009)
5 “Debt Exchange Offers: Legal Strategies for Distressed Issuers – Navigating Complex Securities Laws When Restructuring Convertible Debt Securities,” 7, (April 15, 2010). Accessed February 11, 2016, https://media.straffordpub.com/products/debt-exchange-offers-legal-strategies-for-distressed-issuers-2010-04-15/presentation.pdf
6 Edward I. Altman and Brenda Karlin, “The Reemergence of Distressed Exchanges in Corporate Restructurings,” (March 2009) 


For more information, contact:

Colin T. Dowdall, CFA
Director of Marketing and Business Development
colin.dowdall@aamcompany.com

John Olvany
Vice President of Business Development
john.olvany@aamcompany.com

Neelm Hameer
Vice President of Business Development
neelm.hameer@aamcompany.com


Disclaimer: Asset Allocation & Management Company, LLC (AAM) is an investment adviser registered with the Securities and Exchange Commission, specializing in fixed-income asset management services for insurance companies. This information was developed using publicly available information, internally developed data and outside sources believed to be reliable. While all reasonable care has been taken to ensure that the facts stated and the opinions given are accurate, complete and reasonable, liability is expressly disclaimed by AAM and any affiliates (collectively known as “AAM”), and their representative officers and employees. This report has been prepared for informational purposes only and does not purport to represent a complete analysis of any security, company or industry discussed. Any opinions and/or recommendations expressed are subject to change without notice and should be considered only as part of a diversified portfolio. A complete list of investment recommendations made during the past year is available upon request. Past performance is not an indication of future returns.

This information is distributed to recipients including AAM, any of which may have acted on the basis of the information, or may have an ownership interest in securities to which the information relates. It may also be distributed to clients of AAM, as well as to other recipients with whom no such client relationship exists. Providing this information does not, in and of itself, constitute a recommendation by AAM, nor does it imply that the purchase or sale of any security is suitable for the recipient. Investing in the bond market is subject to certain risks including market, interest-rate, issuer, credit, inflation, liquidity, valuation, volatility, prepayment and extension. No part of this material may be reproduced in any form, or referred to in any other publication, without express written permission.

  • « Go to Previous Page
  • Page 1
  • Interim pages omitted …
  • Page 7
  • Page 8
  • Page 9
  • Page 10
  • Go to Next Page »

Get updates in your inbox.

  • Investment Strategies
    • Investment Grade Fixed Income
    • Specialty Asset Classes
  • Our Clients
    • Client Experience
    • Sample RFP Download
  • Insights
    • Video
    • Webinar
    • News
    • Podcasts
  • About
    • Our Team
    • Contact
    • Client Login

Disclaimer: Asset Allocation & Management Company, LLC (AAM) is an investment adviser registered with the Securities and Exchange Commission, specializing in fixed-income asset management services for insurance companies. Registration does not imply a certain level of skill or training. This information was developed using publicly available information, internally developed data and outside sources believed to be reliable. While all reasonable care has been taken to ensure that the facts stated and the opinions given are accurate, complete and reasonable, liability is expressly disclaimed by AAM and any affiliates (collectively known as “AAM”), and their representative officers and employees. This report has been prepared for informational purposes only and does not purport to represent a complete analysis of any security, company or industry discussed. Any opinions and/or recommendations expressed are subject to change without notice and should be considered only as part of a diversified portfolio. A complete list of investment recommendations made during the past year is available upon request. Past performance is not an indication of future returns. This information is distributed to recipients including AAM, any of which may have acted on the basis of the information, or may have an ownership interest in securities to which the information relates. It may also be distributed to clients of AAM, as well as to other recipients with whom no such client relationship exists. Providing this information does not, in and of itself, constitute a recommendation by AAM, nor does it imply that the purchase or sale of any security is suitable for the recipient. Investing in the bond market is subject to certain risks including market, interest-rate, issuer, credit, inflation, liquidity, valuation, volatility, prepayment and extension. No part of this material may be reproduced in any form, or referred to in any other publication, without express written permission. *All figures shown are approximate and subject to change from quarter to quarter. **The accolades and awards highlighted herein are not statements of any advisory client and do not describe any experience with or endorsement of AAM as an investment adviser by any such client.

Copyright © 2024 AAM | Privacy and Disclosures

  • LinkedIn
  • YouTube