• Skip to primary navigation
  • Skip to main content
  • Skip to footer
AAM CompanyTransparent Logo

AAM Company

AAM Company Website

  • Investment Strategies
    • Investment Grade Fixed Income
    • Specialty Asset Classes
  • Clients
    • Our Clients
    • Client Experience
    • Download Sample RFP
  • Insights
    • Video
    • Webinars
    • Podcasts
    • News
  • About
    • Our Team
    • Events
  • Login
  • Contact Us
Contact

Municipals

October 28, 2018 by

July 18, 2018 by

Elevated Selling activity Pressures Muni Relative Valuations to Weaker Levels

After a sloppy finish to the first quarter, tax-exempt municipals performed relatively well for most of the second quarter. First quarter performance was hampered by a very elevated level of bid list activity that was primarily tied to the selling from banks. Data provided by Bloomberg on the aggregate par amount of bid list activity reveals that selling flows peaked at the end of the quarter, with a 10-day average in excess of $1 Billion per day. That was 60% above the 3 year average. The selling pressure resulted in 10 year nominal spread relationships between munis and Treasuries to widen by 23 basis points (bps) between Jan 22nd and the end of the quarter.

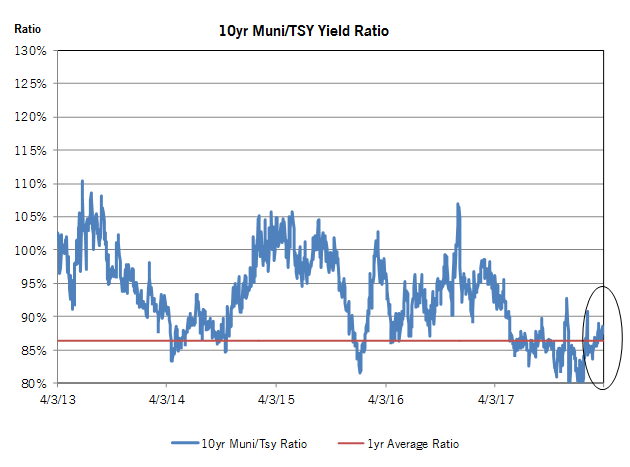
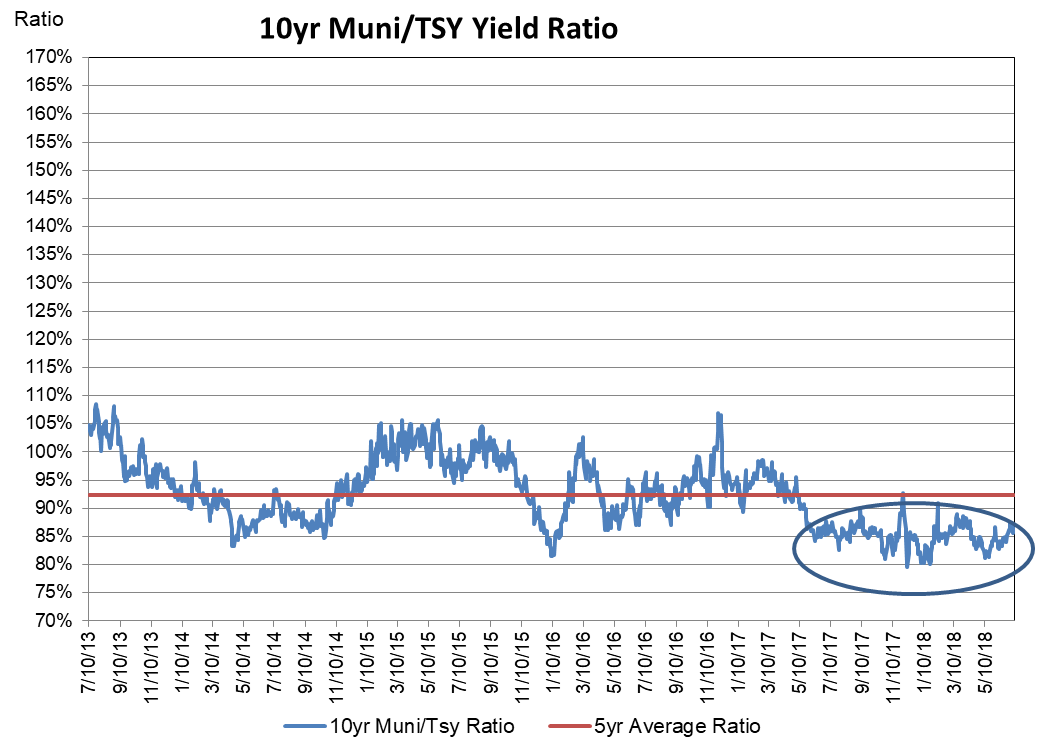
Since that time, bid list activity has moderated quite a bit, with the 10-day average falling by 35% to $670 million per day on June 5th.  Although new issuance for the 2nd quarter was up a significant 48% relative to the first quarter, the reduction in selling activity, combined with a firm buying tone from the retail or household investor segment, was enough to generate a substantial amount of outperformance relative to taxable alternatives. Nominal spreads to Treasuries on a maturity-matched basis tightened by 28, 18 and 17 bps in 5, 10 and 20 year maturities, respectively. This sizable contraction in yield spread levels resulted in tax-equivalent yield levels for property and casualty companies to reach 2018 spread lows of -89, -103 and -84bps versus ‘A’-rated corporates as of June 5th.

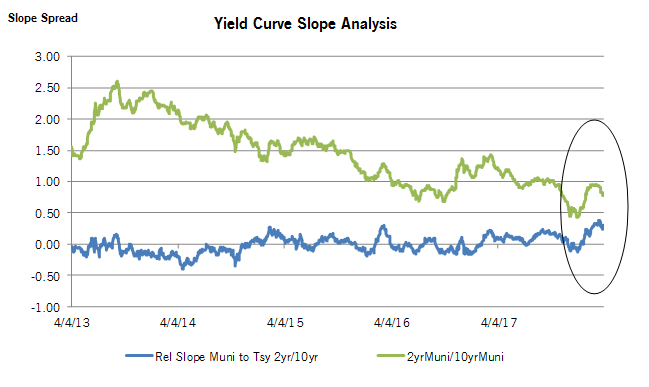
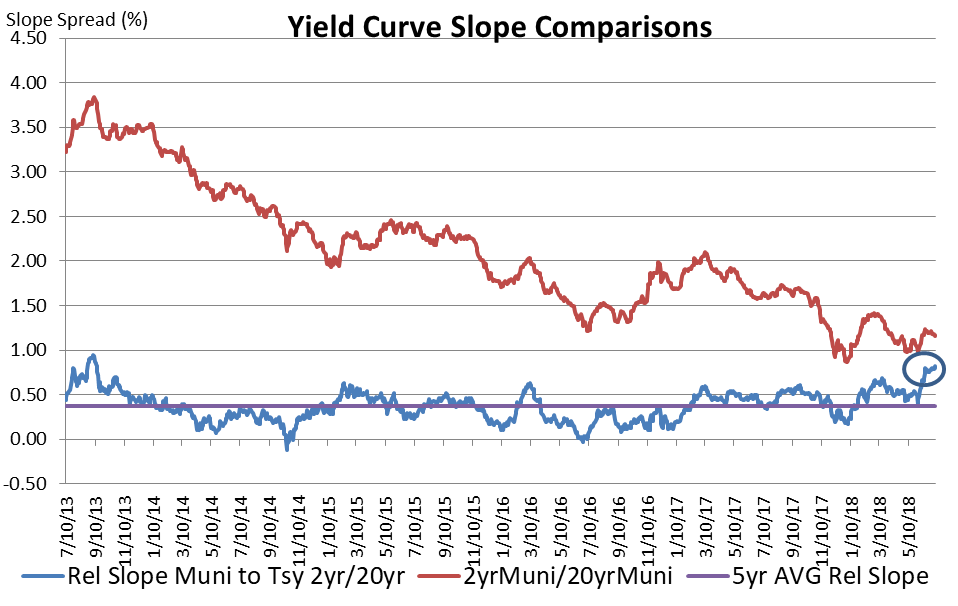
These new and very unattractive relative valuation levels seemingly sparked another round of selling for the balance of the quarter. From June 6th to June 27th, aggregate daily bid list activity surged 45% to $970 million per day, with the lion’s share of this activity concentrated in the 1 to 10yr maturity range. Broker/dealer inventory levels, as reported by the Federal Reserve, show that inventory levels of municipal fixed rate bonds with a maturity between 1 and 10yrs spiked by 60% between May 30th and June 27th. The net result of this selling pressure and the surge in inventory levels helped produce a significant steepening bias to the muni yield curve on both an absolute and relative basis. The slope of the muni curve between 2 and 30yrs moved steeper by 22bps, and relative to the Treasury curve, the muni curve steepened by 41bps. As we enter the 3rd quarter, the shape of the muni curve looks very attractive. The relative slope or the excess steepness of the muni term structure versus the Treasury curve from 2 to 30 yrs now stands at 84 bps or 2.3 standard deviations (z-score) steep relative to the 1 yr average.

In looking at our outlook for the 3rd quarter, we are looking for an improved tone over the next two to three months, based in large part on very favorable technicals. The market is expected to see a 22% drop in new issue supply relative to the 2nd quarter’s $96 Billion. Additionally, the sector will also absorb the strongest flows of the year from coupons/calls/maturities. When incorporating the surge in these reinvestment flows, net supply during the quarter is expected to fall from negative $7.8 Billion in the 2nd quarter to negative $52 Billion. We expect that this improved technical condition will result in better relative performance during the quarter, which should also lead to a flatter yield curve and tighter tax-equivalent yield spreads relative to taxable alternatives. For our property and casualty company portfolios, our goal will be to continue to look at opportunities to take advantage of any significant outperformance and rotate out of the sector and into taxable sectors with a much better tax-adjusted return profile.

_____________________________________________________________________________________________________________________________________________

Disclaimer: Asset Allocation & Management Company, LLC (AAM) is an investment adviser registered with the Securities and Exchange Commission, specializing in fixed-income asset management services for insurance companies. Registration does not imply a certain level of skill or training. This information was developed using publicly available information, internally developed data and outside sources believed to be reliable.  While all reasonable care has been taken to ensure that the facts stated and the opinions given are accurate, complete and reasonable, liability is expressly disclaimed by AAM and any affiliates (collectively known as “AAM”), and their representative officers and employees.  This report has been prepared for informational purposes only and does not purport to represent a complete analysis of any security, company or industry discussed. Any opinions and/or recommendations expressed are subject to change without notice and should be considered only as part of a diversified portfolio. A complete list of investment recommendations made during the past year is available upon request. Past performance is not an indication of future returns. This information is distributed to recipients including AAM, any of which may have acted on the basis of the information, or may have an ownership interest in securities to which the information relates.  It may also be distributed to clients of AAM, as well as to other recipients with whom no such client relationship exists.  Providing this information does not, in and of itself, constitute a recommendation by AAM, nor does it imply that the purchase or sale of any security is suitable for the recipient. Investing in the bond market is subject to certain risks including market, interest-rate, issuer, credit, inflation, liquidity, valuation, volatility, prepayment and extension. No part of this material may be reproduced in any form, or referred to in any other publication, without express written permission.

April 26, 2018 by

Tepid Demand Leads to Steeper Yield Curve

Entering 2018, there was a general consensus that the tax-exempt sector was heading into a more constructive tone, based in large part on very favorable technicals. After an extremely volatile fourth quarter in 2017 that produced a total of $144 Billion in new issuance, with a record $62 Billion in December, the new year was expected to produce a substantial drop in supply. Most of this expected contraction was a direct result of the tax reform that was passed late last year that disallowed tax-exempt advance refundings. New issuance for 2018 was expected to drop by ~23% relative to 2017, with the first quarter expected to produce $62 Billion, a drop of 57% relative to the fourth quarter of 2017.

Demand was also expected to be very supportive. The December through February timeframe is the second strongest period of the year for reinvestment flows of coupons/calls/maturities. The strong demand flows, combined with the expected drop in new issue supply, was expected to produce net supply of negative $41 Billion, a record low for the first quarter.

In looking at the actual performance for the quarter, the results were mixed. Relative performance during January was very strong, as supply/demand imbalances produced a very strong “January effect.” Issuance during the month came in at $20.5B, down 43% relative to January of 2017, and net supply came in at negative $17 Billion. That led to municipal yields to fall by 1 basis points (bps) in 3years and to rise by only 15bps in the 10year maturity between the beginning of the year and January 22nd. This was in stark contrast to the Treasury market which saw rates rise by 23 and 25bps in these years, respectively.

However, relative performance over the balance of the quarter was a different story. Although retail investors remained engaged, the concerns over a further rise in Treasury rates were enough to discourage these investors from moving out of the short-end of the yield curve. Additionally, with tax reform reducing corporate tax rates from 35% to 21%, banks and insurance companies were recalibrating their holdings under the new tax regimen and were finding better after-tax opportunities in the taxable bond sectors. Consequently, there was a heavier flow of overall bid list activity for the quarter relative to historical trends. More notable, from January 23rd to the end of the quarter, average daily bid list activity reported by Bloomberg was approximately 47% higher than the average during the first 22 days of 2018 and 42% higher than the daily average during all of 2017. In addition to their selling flows, the corporate investment segment has only provided very tepid interest on new deal flow activity, resulting in higher market clearing levels in the longer end of the yield curve.

Historically property and casualty companies and banks have provided most of the sponsorship in the 10- to 30-year maturity range.

The net result of the weaker demand from corporate investors and the solid, front-end demand from the retail/household segment has been for the curve to steepen dramatically relative to the Treasury market. Since the beginning of the year, the curve from to 2 to 10years has steepened by 35 bps on an absolute basis and by 40 bps relative to the Treasury curve. The bifurcation in the demand segments has also resulted in municipal-to-Treasury yield ratios in 10yrs for the quarter to rise to 88% from 82%.

In looking forward at our outlook for the second quarter, we are retaining our constructive view for the sector for the balance of the year. However, we could see the steepness of the muni yield curve and relative valuation levels remain at elevated levels for most of the next quarter, before very favorable technicals develop going into the third quarter. The supply/demand imbalances for the June to August time period is expected to produce net supply of negative $61 Billion. That compares favorably with the same time period over the past three years: net supply levels of negative $45.5B last year, negative $13.3B in 2016 and negative $38B in 2015.

In terms of where we find the most value heading into the favorable summer technicals, the 10 year and longer area of the curve looks attractive. The excessive curve steepening that has occurred since the beginning of the year has created an entry point to either put new money to work in the sector or to retain positions in this maturity segment. If we see any meaningful improvement in relative valuation levels and/or substantial relative curve flattening to develop, we would continue to explore a further sector rotation out of tax-exempts and into sectors that provide a better after-tax yield profile.


Disclaimer: Asset Allocation & Management Company, LLC (AAM) is an investment adviser registered with the Securities and Exchange Commission, specializing in fixed-income asset management services for insurance companies. Registration does not imply a certain level of skill or training. This information was developed using publicly available information, internally developed data and outside sources believed to be reliable.  While all reasonable care has been taken to ensure that the facts stated and the opinions given are accurate, complete and reasonable, liability is expressly disclaimed by AAM and any affiliates (collectively known as “AAM”), and their representative officers and employees.  This report has been prepared for informational purposes only and does not purport to represent a complete analysis of any security, company or industry discussed. Any opinions and/or recommendations expressed are subject to change without notice and should be considered only as part of a diversified portfolio. A complete list of investment recommendations made during the past year is available upon request. Past performance is not an indication of future returns. This information is distributed to recipients including AAM, any of which may have acted on the basis of the information, or may have an ownership interest in securities to which the information relates.  It may also be distributed to clients of AAM, as well as to other recipients with whom no such client relationship exists.  Providing this information does not, in and of itself, constitute a recommendation by AAM, nor does it imply that the purchase or sale of any security is suitable for the recipient. Investing in the bond market is subject to certain risks including market, interest-rate, issuer, credit, inflation, liquidity, valuation, volatility, prepayment and extension. No part of this material may be reproduced in any form, or referred to in any other publication, without express written permission.

February 20, 2018 by

With all the news surrounding recent tax reform and the municipal market, we wanted to get a better understanding of how those changes affected our clients. We sat down with Peter Wirtala, CFA, AAM’s Insurance Strategist, to discuss how tax reform has reshaped the investment landscape for insurers.

Q: We’ve all heard that the new tax regime is making insurers rethink their strategy towards tax-exempt municipal bonds. Can you sum up what has changed and what it means?

A: Big changes are definitely taking place. Historically, P&C insurers have been major buyers of tax-exempts, with about two-thirds of them owning at least a few, and typical allocations ranging from 30-40% of investment grade bond holdings. But with the lower corporate tax rate in place, taxable bonds are now much more attractive relative to tax-exempt bonds. Insurers typically “gross up” the yield on a tax-exempt bond to compare it to taxable yields, and the magnitude of that gross-up just got a lot smaller.

A simple example: previously a tax-exempt bond yielding 2.50% and a taxable bond yielding 3.64% produced the same after-tax income. Now, the tax-exempt bond would need to yield 3.00% to compete. Unfortunately, muni spreads haven’t widened 50 bps to compensate, so a large swath of the market has ceased to be appealing to insurance investors.

Q: Can you further quantify what you mean when you say tax-exempt munis are less appealing now?

A: Another quick illustration should help: at this writing, a representative 10yr AA-rated municipal bond yields about 2.63%, or 3.15% after the gross-up factor is applied. That’s a spread of 28 bps over the 10yr US Treasury. At the old tax rate, this bond would’ve had a grossed-up yield of 3.83%, or a spread of 96 bps.

The Bloomberg Barclays Corporate Index currently shows a spread of about 65 bps on 10yr AA-rated corporate bonds. You can see that at the old tax rate, the muni bond would’ve looked appealing by comparison, but at the new one it does not.

Q: I take it thus far you’ve been talking about P&C insurers, but what about the Life industry?

A: That’s right, the comments above apply to P&C companies. However, the situation for Life insurers has changed dramatically as well. These companies mostly avoided tax-exempt munis in the past (though they bought plenty of taxable munis). Historically, only around 10% of Life companies reported any tax-exempt bond income, and usually just small amounts. This is because under the previous law, the degree of tax exemption Life insurers could get on these bonds was both complicated to calculate, and frequently too small to be worthwhile.

That’s now changed. Life insurer treatment of tax-exempt income has been greatly simplified, the uncertainty about being able to use the tax exemption has been removed, and overall their rules are now very similar to P&C insurers’.

At first glance this would suggest Life companies could now start adding muni allocations, but they face the same issue mentioned above: yields on most tax-exempts can no longer compete with taxable alternatives.

Q: How about Health insurers, where do they fit in?

A: They’re probably the ones least affected here. Their tax rules have traditionally worked similarly to P&C insurers’, but they’ve mostly avoided the sector. To put a number to it, in 2016 only about 5% of health insurers reported more than a negligible amount of tax-exempt bond income. The main reason has to do with asset-liability matching. Health insurers usually have short liabilities that turn over very quickly, so their assets mostly need to be invested in shorter-duration securities; for example, at 12/31/16 the industry reported less than 10% of their bond holdings had maturities of over 10 years. But munis have always been most attractive at longer maturities, from around 7 year maturities and out. Health companies don’t have much appetite for that part of the yield curve, and that is unlikely to change in the foreseeable future.

Q: So are insurers just going to stop buying munis, unless spreads widen?

A: Not necessarily. It’s true that most tax-exempt muni bonds’ spreads are no longer attractive to insurers, and this appears unlikely to change in the near future since top individual tax rates didn’t change nearly as much as corporate rates, and retail investors make up the bulk of muni buyers. Still, there are pockets of value, at least relatively speaking.

The key is to break the market out by maturity and quality buckets. Broadly speaking, muni bonds rated AA and above, and/or maturing in 10yrs or less, have experienced the largest relative decline in attractiveness. Munis rated A or BBB, or maturing in >20yrs, have spreads significantly closer to those on comparable taxable bonds.

The table below compares representative spreads to Treasuries on some selected quality/maturity buckets:


Source: Bloomberg Barclays indexes. Values are indicative. As of 2/8/2018

This suggests that insurers should consider investing in longer and lower-quality munis than they have in the past. Complicating this is the fact that A and BBB rated munis are much rarer than higher-rated bonds, making up only 24% and 8% respectively of the overall Bloomberg Barclays Municipal index by market value.

By contrast, A and BBB bonds make up 42% and 48% of the Corporate index (which is also over 3x larger than the Municipal index). This could make bonds difficult to source for larger insurance companies, and creates a risk that a large-scale shift into these ratings buckets by insurers could drive down spreads, defeating the point of the exercise.

In any case, insurers with large legacy allocations to tax-exempt municipals should now consider reducing those exposures in favor of taxable alternatives, which now offer superior tax-adjusted spreads for most maturities and ratings buckets.

While corporate and muni spreads will fluctuate relative to each other as time goes by, with both offering value at certain points in the cycle, it is likely that insurers will need to consider longer, lower-rated munis if they want to obtain the best tax-adjusted yields available from the sector.

Written by: Peter Wirtala, CFA


Disclaimer: Asset Allocation & Management Company, LLC (AAM) is an investment adviser registered with the Securities and Exchange Commission, specializing in fixed-income asset management services for insurance companies. Registration does not imply a certain level of skill or training. This information was developed using publicly available information, internally developed data and outside sources believed to be reliable.  While all reasonable care has been taken to ensure that the facts stated and the opinions given are accurate, complete and reasonable, liability is expressly disclaimed by AAM and any affiliates (collectively known as “AAM”), and their representative officers and employees.  This report has been prepared for informational purposes only and does not purport to represent a complete analysis of any security, company or industry discussed. Any opinions and/or recommendations expressed are subject to change without notice and should be considered only as part of a diversified portfolio. A complete list of investment recommendations made during the past year is available upon request. Past performance is not an indication of future returns. This information is distributed to recipients including AAM, any of which may have acted on the basis of the information, or may have an ownership interest in securities to which the information relates.  It may also be distributed to clients of AAM, as well as to other recipients with whom no such client relationship exists.  Providing this information does not, in and of itself, constitute a recommendation by AAM, nor does it imply that the purchase or sale of any security is suitable for the recipient. Investing in the bond market is subject to certain risks including market, interest-rate, issuer, credit, inflation, liquidity, valuation, volatility, prepayment and extension. No part of this material may be reproduced in any form, or referred to in any other publication, without express written permission.

November 2, 2017 by

Strong Municipal Demand Remains Unabated in the Face of Higher Rates and Tax Reform

Relative valuations stayed consistently expensive during the third quarter, buoyed in large part by the excessive levels of reinvestment flows of coupons/calls/maturities. Supply was also a factor as the new issue calendar was down 20% relative to the second quarter and down 25% relative to the third quarter of 2016. It appears that although yield levels are very conducive to executing additional refinancings, the opportunity set of deals that can be refinanced is not large enough to generate the level of refinancings that occurred during the record levels that were executed during 2016 and 2015. Refinancings on a year-to-date basis are down 40% through the end of the third quarter, and with rates moving higher over the last 3 weeks of the quarter, this downward trend is now likely to continue through the balance of the year.

Since the end of the quarter, 10 year Treasury rates have continued their upward trend with rates rising by another 9 basis points (bps). The increased prospects for the passage of tax reform and the resulting potential for increased Treasury issuance, budget deficits and inflation from economic stimulus have helped pressure yields to higher levels. The higher yield levels have also resulted in the Treasury curve flattening by another 3 basis points from 2 to 30 years, after flattening by 8 bps during the quarter.

In regards to tax-reform, on September 27th, the ”Big Six”, which includes Paul Ryan, Mitch McConnell, Kevin Brady, Orin Hatch, Steve Mnuchin and Gary Cohn, released the framework for their tax-reform proposals. Although the framework was short on details, some of the major issues tackled would be to reduce tax brackets from the current seven down to three: 12%, 25% and 35%. Additionally, corporate rates would decline from 35% to 20%.

Although the current reform proposals don’t appear to impact the demand for tax-exempts from retail investors, (even less so if a fourth tax bracket is added above the proposed 35%) institutional investors could see some major changes to their demand profile. If the corporate rate is cut to 20%, property and casualty companies (P&C) and banks, who make up ~28% of the market would find it difficult to remain fully invested in tax-exempts. Under a 20% rate, tax-adjusted yield levels would decline sharply relative to the yields of competing taxable alternatives. Those concerns have already led to the muni curve to steepen by ~57 bps on a relative basis to the Treasury curve since the beginning of the year through the middle of September. Institutional investors provide a substantial amount of sponsorship to the long end of the curve and these investors have remained on the sidelines much of the year as they await more clarity on the tax-reform issues. Another potential area that could keep the pressure on the curve to stay steep is that P&C carriers are expected to see downward pressure on their profitability as they absorb losses related to hurricanes Irma, Harvey and Maria, and the wildfires in northern California. The net effect of these events lessens the need for tax-exempt income and could generate liquidity needs to pay claims.

However, outside of the aforementioned curve steepening bias, from a relative valuation standpoint, it appears that the tax-exempt market has remained indifferent to the risks related to tax-reform and has continued to enjoy solid technical conditions. While 10 year Treasury rates have risen by 39 bps since September 8th, 10 year nominal spreads to Treasuries have contracted by 23 bps, which is based on both continued strong demand as well as supply levels that are running below expectations. New issuance was expected to reach $40B during October, but during the first three weeks the market has only produced approximately $23 billion, while demand flows from coupon/calls/maturities have remained solid. Mutual fund flows have also been supportive. Inflows reported by Lipper reached $536 million for the period ending October 18th, increasing aggregate inflows for the year to $15.2 billion. The net result is that, as of the date of this writing, munis have moved to their most expensive relationship to taxables, with 10 year Municipal-to-Treasury ratios reaching a 2017 low of 81%.

In terms of our outlook for the balance of the year, with Municipal-to-Treasury ratios hovering around 81% in 10 years and tax-adjusted yield spreads to Treasuries of -9, -3 and 11 basis points, in 3, 5 and 7 years respectively, we continue to believe that the market is overvalued. Although the higher rate environment is expected to slow new issuance, there are major concerns related to tax-reform and the potential for an asset allocation shift out of tax-exempts by institutional investors. At a 20% corporate rate, current “AAA” tax-adjusted yield levels for insurance companies would fall 48 bps to 2.38%, and a spread of -4 bps versus 10 year Treasury levels. To put that number into further context, that would be a full 73 bps through 10 year “A” rated industrial corporate yield levels. In the 5 year maturity, muni spreads to corporates would be negative by 83 bps. At these spread levels, those institutional investors that seek to optimize after-tax income would find the asset allocation shift out of tax-exempts and into taxables to be a compelling strategy. Consequently, we are maintaining our underweight bias in the tax-exempt sector.


Disclaimer: Asset Allocation & Management Company, LLC (AAM) is an investment adviser registered with the Securities and Exchange Commission, specializing in fixed-income asset management services for insurance companies. Registration does not imply a certain level of skill or training. This information was developed using publicly available information, internally developed data and outside sources believed to be reliable.  While all reasonable care has been taken to ensure that the facts stated and the opinions given are accurate, complete and reasonable, liability is expressly disclaimed by AAM and any affiliates (collectively known as “AAM”), and their representative officers and employees.  This report has been prepared for informational purposes only and does not purport to represent a complete analysis of any security, company or industry discussed. Any opinions and/or recommendations expressed are subject to change without notice and should be considered only as part of a diversified portfolio. A complete list of investment recommendations made during the past year is available upon request. Past performance is not an indication of future returns. This information is distributed to recipients including AAM, any of which may have acted on the basis of the information, or may have an ownership interest in securities to which the information relates.  It may also be distributed to clients of AAM, as well as to other recipients with whom no such client relationship exists.  Providing this information does not, in and of itself, constitute a recommendation by AAM, nor does it imply that the purchase or sale of any security is suitable for the recipient. Investing in the bond market is subject to certain risks including market, interest-rate, issuer, credit, inflation, liquidity, valuation, volatility, prepayment and extension. No part of this material may be reproduced in any form, or referred to in any other publication, without express written permission.

July 25, 2017 by


Greg Bell, CFA
Director of Municipal Bonds

Surge in Tax-Exempt Performance Driven by Strong Technicals and Indifference to Tax-Reform Risks

The tax-exempt sector experienced very strong performance due to a continued build in positive technicals however; the market did absorb some rate volatility to close the quarter. Hawkish commentary from the European and British Central Banks pressured 10 year Treasury yields higher by 17 basis points (bps) over the last three trading days of the quarter. Muni yields in 10 years followed suit, with a selloff of 14 bps yet even with this backslide, the sector saw substantial gains for the quarter.

Very strong demand flows combined with a manageable new issue calendar provided the basis for the firm tone in the market. Municipal yields in 10 years finished the quarter by contracting by 26 bps, while 10 year Treasuries yields fell by a total of only 8 bps. The outperformance by the muni sector drove relative valuations to very expensive levels with 10 year municipal-to-Treasury yield ratios finishing the quarter at 86%.

In reviewing the primary catalysts for the strong muni performance, a very manageable calendar continues to play an important role. Overall issuance this year is down from last year by 14% driven in large part by a sharp contraction in refinancings. This segment of the new issue calendar produced a record last year and with rates surging at the end of 2016 the market expected to see a reduction in this issuance during 2017. Year-to-date the flow of deals classified as straight or pure refinancing saw a drop of 46% compared to 2016. However, we could be in the midst of a dramatic turnaround in this trend. Since the beginning of the year, tax-exempt yields in 10 and 20-year bonds have dropped by 32 and 25 bps respectively. As a result, the interest cost savings available from refinancings have become more compelling and are in line with the savings levels that were available over the last two record-producing years. The market is already showing signs of taking advantage of the new savings opportunities, with the monthly average of straight refinancings over the last two months increasing by 54% versus the monthly average over the first four months of 2017. We expect that this issuance trend will continue to build over the balance of the year if rates fall or remain range-bound around current levels.

Even with a substantial increase in supply, the market is poised to maintain its expensive relative valuation profile versus Treasuries in the near term. The market is currently enjoying record reinvestment flows of coupons/calls/maturities that should be in place through the end of August. Additionally, investors have seemingly become indifferent to any risks related to potential tax reform. As of this writing, muni relative valuations to taxables have richened to the point that they now exceed the levels that existed before the presidential elections. It appears that the market consensus has “priced-out” the risks for tax reform in 2017 driven in part by the protracted execution of the repeal and replacement of the Affordable Care Act. Although recent efforts have failed, congress and the President could remain preoccupied with this agenda item and hinder their efforts toward advancing other priorities. Consequently, it appears that expectations for tax-reform have been pushed into 2018 or beyond and as a result muni investors have become more emboldened to take more duration risk. That’s evident by a sharp 30 bps flattening in the muni yield curve from two to 30 years during the second quarter. As long as the execution of the President’s political agenda on healthcare and tax-reform continues to be protracted, investors will likely remain indifferent and demand flows should remain unabated.

In looking forward to our outlook for the third quarter and the balance of the year, we believe that the market is at overbought levels. Positive technicals should support the market over the next two to three months, but the market could see these supply/demand imbalance factors weaken going into the fourth quarter. The current yield environment increases the likelihood that a building supply cycle could develop on the heels of compelling refinancing metrics, which could pressure relative valuations to weaker levels. Additionally, we believe that the risk related to tax-reform, especially a reduction in corporate tax rates, is still an important event that bears close watching. Should there be any positive developments toward this agenda item as the Republican Party becomes more driven to produce reform and cuts before the 2018 mid-term elections, we could see a substantial amount of rate volatility and weaker relative valuation levels. Given these risks and the sector’s expensive relative valuation profile, we have moved to an underweight bias for the sector.


Disclaimer: Asset Allocation & Management Company, LLC (AAM) is an investment adviser registered with the Securities and Exchange Commission, specializing in fixed-income asset management services for insurance companies. Registration does not imply a certain level of skill or training. This information was developed using publicly available information, internally developed data and outside sources believed to be reliable.  While all reasonable care has been taken to ensure that the facts stated and the opinions given are accurate, complete and reasonable, liability is expressly disclaimed by AAM and any affiliates (collectively known as “AAM”), and their representative officers and employees.  This report has been prepared for informational purposes only and does not purport to represent a complete analysis of any security, company or industry discussed. Any opinions and/or recommendations expressed are subject to change without notice and should be considered only as part of a diversified portfolio. A complete list of investment recommendations made during the past year is available upon request. Past performance is not an indication of future returns. This information is distributed to recipients including AAM, any of which may have acted on the basis of the information, or may have an ownership interest in securities to which the information relates.  It may also be distributed to clients of AAM, as well as to other recipients with whom no such client relationship exists.  Providing this information does not, in and of itself, constitute a recommendation by AAM, nor does it imply that the purchase or sale of any security is suitable for the recipient. Investing in the bond market is subject to certain risks including market, interest-rate, issuer, credit, inflation, liquidity, valuation, volatility, prepayment and extension. No part of this material may be reproduced in any form, or referred to in any other publication, without express written permission.


  • « Go to Previous Page
  • Page 1
  • Page 2
  • Page 3
  • Page 4
  • Interim pages omitted …
  • Page 6
  • Go to Next Page »

Get updates in your inbox.

  • Investment Strategies
    • Investment Grade Fixed Income
    • Specialty Asset Classes
  • Our Clients
    • Client Experience
    • Sample RFP Download
  • Insights
    • Video
    • Webinar
    • News
    • Podcasts
  • About
    • Our Team
    • Contact
    • Client Login

Disclaimer: Asset Allocation & Management Company, LLC (AAM) is an investment adviser registered with the Securities and Exchange Commission, specializing in fixed-income asset management services for insurance companies. Registration does not imply a certain level of skill or training. This information was developed using publicly available information, internally developed data and outside sources believed to be reliable. While all reasonable care has been taken to ensure that the facts stated and the opinions given are accurate, complete and reasonable, liability is expressly disclaimed by AAM and any affiliates (collectively known as “AAM”), and their representative officers and employees. This report has been prepared for informational purposes only and does not purport to represent a complete analysis of any security, company or industry discussed. Any opinions and/or recommendations expressed are subject to change without notice and should be considered only as part of a diversified portfolio. A complete list of investment recommendations made during the past year is available upon request. Past performance is not an indication of future returns. This information is distributed to recipients including AAM, any of which may have acted on the basis of the information, or may have an ownership interest in securities to which the information relates. It may also be distributed to clients of AAM, as well as to other recipients with whom no such client relationship exists. Providing this information does not, in and of itself, constitute a recommendation by AAM, nor does it imply that the purchase or sale of any security is suitable for the recipient. Investing in the bond market is subject to certain risks including market, interest-rate, issuer, credit, inflation, liquidity, valuation, volatility, prepayment and extension. No part of this material may be reproduced in any form, or referred to in any other publication, without express written permission. *All figures shown are approximate and subject to change from quarter to quarter. **The accolades and awards highlighted herein are not statements of any advisory client and do not describe any experience with or endorsement of AAM as an investment adviser by any such client.

Copyright © 2024 AAM | Privacy and Disclosures

  • LinkedIn
  • YouTube