• Skip to primary navigation
  • Skip to main content
  • Skip to footer
AAM CompanyTransparent Logo

AAM Company

AAM Company Website

  • Investment Strategies
    • Investment Grade Fixed Income
    • Specialty Asset Classes
  • Clients
    • Our Clients
    • Client Experience
    • Download Sample RFP
  • Insights
    • Video
    • Webinars
    • Podcasts
    • News
  • About
    • Our Team
    • Events
  • Login
  • Contact Us
Contact

Municipals

April 20, 2017 by

Greg Bell, CFA
Director of Municipal Bonds

Municipals Experienced Strengthening Technicals during the Quarter.

The tax-exempt sector experienced mixed performance during the first quarter overall, but stronger technicals were building by the end of the quarter. At the beginning of the year, municipal bond investors were concerned about both a rising rate environment and the prospects for major tax reform that could reduce the relative valuations for the sector. Those concerns resulted in very robust demand for short-dated maturities around the 5 year and shorter area that helped push yields lower by 27 and 24 basis points (bps) in 3 and 5 years, respectively. By contrast, the worries over the potential for a substantial cut to the corporate tax rate to 20% have generally been felt in the 15 to 30 year area of the yield curve. Insurance companies and banks, the investors that provide most of the sponsorship to that part of the yield curve, have been very cautious and have favored a neutral positioning until more clarity exists on the extent of tax reform. Yields in that range ended the quarter 1 to 3bps higher. The clear shift in reducing duration risk during the quarter resulted in the slope of the yield curve from 2 to 30 years steepening by 37 bps to a one-year high of 220bps on March 9th.

Since that time, the market did receive some unexpected support from positive developments related to supply technicals. March is historically one of the weakest technical periods of the year. New issuance typically spikes during the month as state and local governments finalize budgets and identify spending initiatives, along with refinancing opportunities. This building supply cycle typically outstrips demand, as reinvestment flows from coupons/calls/maturities fall to the lowest point of the year during March and April. However, this year, March supply came in well-below expectations at $29.8B, which was a drop of 30% from March 2016 and 20% below the 10 year average for March. The major catalyst for the drop has been the rise in interest rates. Municipal 10 year rates moved to a 2017 high of 2.49% during March, which was 78bps higher than average 10yr yields during 2016. The higher rate environment substantially reduced the universe of deals that could generate the necessary reduction in debt servicing costs to execute refinancings.

The market also benefited from the failure of congress to pass repeal and replacement of the Affordable Care Act. The lack of repeal of the law left intact the 3.8% Medicare surtax on investment income, which continues to make tax-exempts attractive relative to taxable alternatives subject to this tax. Additionally, the repeal and replace legislation would have generated a substantial reduction in the budget deficit and would have helped pave the way for a more aggressive push toward cutting corporate rates to the 20% level targeted by the House Speaker, Paul Ryan. Without the budget deficit savings, the market appears to now expect a corporate rate in the 27% to 30% range. Since March 15th, these developments resulted in 10 year muni yields falling by 24bps and the slope of the yield curve from 2 to 30 years to flatten by 17bps.

In looking at our outlook for the 2nd quarter, technicals should continue to exhibit a strengthening trend into the end of the quarter. Reinvestment flows are expected to be the highest of the year during June and July 1st, while supply is expected to remain manageable. However, if rates continue to move lower, cost savings from refinancings could become more compelling and we could see a renewed surge in supply levels. The market is also continuing to wait for more clarity on the extent of tax reform and the sector could experience some volatility around this issue. With our more constructive view on demand technicals, we are transitioning accounts from an underweight to a neutral bias.


Disclaimer: Asset Allocation & Management Company, LLC (AAM) is an investment adviser registered with the Securities and Exchange Commission, specializing in fixed-income asset management services for insurance companies. Registration does not imply a certain level of skill or training. This information was developed using publicly available information, internally developed data and outside sources believed to be reliable.  While all reasonable care has been taken to ensure that the facts stated and the opinions given are accurate, complete and reasonable, liability is expressly disclaimed by AAM and any affiliates (collectively known as “AAM”), and their representative officers and employees.  This report has been prepared for informational purposes only and does not purport to represent a complete analysis of any security, company or industry discussed. Any opinions and/or recommendations expressed are subject to change without notice and should be considered only as part of a diversified portfolio. A complete list of investment recommendations made during the past year is available upon request. Past performance is not an indication of future returns. This information is distributed to recipients including AAM, any of which may have acted on the basis of the information, or may have an ownership interest in securities to which the information relates.  It may also be distributed to clients of AAM, as well as to other recipients with whom no such client relationship exists.  Providing this information does not, in and of itself, constitute a recommendation by AAM, nor does it imply that the purchase or sale of any security is suitable for the recipient. Investing in the bond market is subject to certain risks including market, interest-rate, issuer, credit, inflation, liquidity, valuation, volatility, prepayment and extension. No part of this material may be reproduced in any form, or referred to in any other publication, without express written permission.

 

October 25, 2016 by

Given our outlook and the currently attractive relative valuation levels, we are moving to an overweight bias for the municipal sector.

Supply technicals were expected to drive volatility in relative valuations this year, and so far, that’s played out in the second half of the year. With 10-yr Treasury rates plunging at the beginning of the 3rd quarter to 1.36% following Britain’s decision to leave the European Union, munis followed suit, with rates moving to a record low of 1.29%. These low nominal yields have induced state and local governments to execute refinancings to levels that are running in tandem with 2015’s record level of issuance. The surge in refinancings during the quarter helped produce record levels of issuance in August and September, resulting in yields rising across the yield curve. Tax-exempt yields in 10-yrs moved higher by 16 basis points (bps) versus a 12 bps move in Treasuries. The long-end of the municipal curve exhibited the worst performance, with yields in 20 and 30-yrs increasing by 27 and 29 bps, respectively. Treasury rates in 30-yrs were higher by only 3 bps.

The front end of the muni yield curve also faced poor performance as the market adjusted to the new regulations surrounding money market reform. New standards that went into effect on October 14th now require that money market funds sold to institutions move to a floating valuation and adopt restrictions that limit investor withdrawal access if the fund’s liquidity falls below certain levels. These reform measures have resulted in year-to-date municipal money market fund outflows of $126 billion as of October 19th.

Consequently, relative valuations of bonds with maturities from 1 to 3-yrs have moved to some of the most attractive levels the market has experienced in over three years. Since August 29th, tax-adjusted spreads for these maturities moved wider by 39, 49 and 44 bps in 1, 2, and 3-yrs, respectively. These adjustments in spread levels have moved our relative valuation bias to a neutral position for this area of the curve from a negative bias that was in place during the first 9 months of the year.

Similarly, the balance of the yield curve is also facing significantly weaker relative valuation levels resulting from weaker technicals. Mutual fund flows, which were experiencing very strong weekly inflows through September with an average of ~$700 million per week, have now moved to outflows of $136 million as of October 19th.

Additionally, seasonal reinvestment flows for coupons/calls/maturities are also near lows for the year during October and November. The drop in demand flows, combined with the recent surge in new issuance, has produced substantial curve steepening pressure. The slope of the yield curve from 5 to 20-yrs has steepened by 13 bps since August 29th and tax-adjusted spreads in 15 and 20-yrs have widened by 43 and 41 bps, respectively, providing that area of the curve with a very compelling entry point for investment.

In looking at the supply outlook for the year, the market is expecting the sector to produce a new record of $445 billion. Both August and September have already reached record levels for their months, with issuance of $45 billion and $35.6 billion, respectively. The market also expects that October and November could approach record levels of over $50 billion per month. Consequently, key relative valuation metrics of municipal/Treasury ratios and tax-adjusted yield spreads to Treasuries have adjusted to near 6-month highs as of this writing.

Looking forward, we expect to see a dramatic slowdown in issuance going into December. In a comparable fashion to the issuance cycle that developed during the latter portion of 2015, it’s expected that state and local governments will curtail issuance, especially rate-sensitive refinancings, to avoid any potential market volatility surrounding the Federal Reserve’s next rate increase. Going into potential Federal Reserve rate hikes in September and December last year, new issuance supply plunged 24% during the last 6 months of the year. Similarly, with the market consensus of at least one rate hike for the balance of this year, the market projects issuance in December this year to decline by 33% relative to the average expected monthly issuance of $41 billion from August to November. This dramatic drop in issuance, combined with the anticipated improvement in demand technicals from robust reinvestment flows of coupon/calls/maturities in December and January, should produce solid muni relative performance going into the new year. Given our outlook and the currently attractive relative valuation levels, we are moving to an overweight bias for the municipal sector. Our objective will be to gradually build up our sector exposure level into the projected supply surge and to further extend our overweight exposure if further dislocations in relative valuations develop.

Written by:
GregoryABell
Greg Bell, CFA
Director of Municipal Products

Disclaimer: Asset Allocation & Management Company, LLC (AAM) is an investment adviser registered with the Securities and Exchange Commission, specializing in fixed-income asset management services for insurance companies. This information was developed using publicly available information, internally developed data and outside sources believed to be reliable. While all reasonable care has been taken to ensure that the facts stated and the opinions given are accurate, complete and reasonable, liability is expressly disclaimed by AAM and any affiliates (collectively known as “AAM”), and their representative officers and employees. This report has been prepared for informational purposes only and does not purport to represent a complete analysis of any security, company or industry discussed. Any opinions and/or recommendations expressed are subject to change without notice and should be considered only as part of a diversified portfolio. A complete list of investment recommendations made during the past year is available upon request. Past performance is not an indication of future returns.

This information is distributed to recipients including AAM, any of which may have acted on the basis of the information, or may have an ownership interest in securities to which the information relates. It may also be distributed to clients of AAM, as well as to other recipients with whom no such client relationship exists. Providing this information does not, in and of itself, constitute a recommendation by AAM, nor does it imply that the purchase or sale of any security is suitable for the recipient. Investing in the bond market is subject to certain risks including market, interest-rate, issuer, credit, inflation, liquidity, valuation, volatility, prepayment and extension. No part of this material may be reproduced in any form, or referred to in any other publication, without express written permission.
August 25, 2016 by

Municipals performed very well during the quarter, as the sector continued to follow closely behind the strong performance in Treasuries. Treasury yields overall were lower by 30 basis points (bps) during the quarter. Most of the move was attributed to the flight-to-quality rally that followed Britain’s decision to exit the European Union. Municipal performance was even stronger, with 10yr rates falling by 35 bps during the quarter.

The strong demand for municipals remained in place in the face of potential headline risk from the credit events surrounding Puerto Rico. As expected, on July 1st, the Commonwealth defaulted on approximately $800 million in debt service payments on its general obligation debt, preferring instead to make payments due to its employees. The Governor declared a moratorium on the island’s debt a day after the President signed into law the Puerto Rico Oversight, Management, and Economic Stability Act (PROMESA). The legislation creates a federal seven-member control board, which will have broad fiscal management oversight powers and the authority to restructure the debt of the Commonwealth. Passage of this legislation was seen as the first important step towards putting the island on a path toward fiscal recovery; however, there are some market concerns that the law does not provide any economic stimulus initiatives to improve revenues going forward. Market prices were generally up after passage of PROMESA and prices since the default are generally unchanged, as the market fully expected the Governor to declare the moratorium.

The overall muni market also saw very little reaction to the Puerto Rico headlines. The sector has generally been consumed by a build in momentum of technical imbalances heading into the summer months. Collectively, June and July experiences the heaviest reinvestment flows of the year resulting from coupons/calls/maturities, while new issue supply was expected to plunge 25% in July from June’s $44 billion in issuance. With seemingly few challenges to curtail demand in the near term, these improving technicals should provide solid relative performance versus taxable alternatives for the 3rd quarter. Even with yields hovering near record low levels, tax-exempt investors have remained consistently engaged all year. Mutual fund flows through July 6th have experienced 40 consecutive weeks of inflows and a year-to-date weekly average of $1.25 billion. With expectations that the Federal Reserve will likely slow the pace of normalizing rates, these fund flows are expected to continue to support the market over the balance of the year.

Although the trend in demand appears to be very supportive for strong relative performance over the 2nd half of the year, a heavier-than-expected new issuance cycle could pose some potential headwinds. In the near term, supply technicals appear to be favorable. After the market produced $119 billion in supply during the 2nd quarter, the market should see a 20% drop in the 3rd quarter, which would be consistent with long-term historical trends. However, today’s near record low yield environment has created very compelling refinancing opportunities for municipalities. Low absolute yields, combined with the flattening in the slope of the muni yield curve, have now increased the universe of outstanding deals that could be refinanced going forward. At the beginning of the 2nd quarter, the only deals that provided compelling refinancing opportunities were debt structured with call features of 3 years or shorter. With the muni yield curve flattening by 58bps since April 1st and high-grade rates starting the 3rd quarter at 1.35% in 10 years, older deals with calls as long as 5 to 7yrs now provide enough in debt service savings to be considered for refinancing. If rates remain near current levels, we expect to see this potential increase in refinancings enter the market late in the 3rd quarter at a time when demand techincals move to much weaker levels on October 1st and November 1st. Consequently, we are moving to a neutral bias for the sector and awaiting opportunities to build exposure to the sector on any potential market dislocations that develop late in the 3rd quarter.

Written by:

GregoryABell

Gregory Bell, CFA, CPA
Director of Municipal Bonds

Disclaimer: Asset Allocation & Management Company, LLC (AAM) is an investment adviser registered with the Securities and Exchange Commission, specializing in fixed-income asset management services for insurance companies. This information was developed using publicly available information, internally developed data and outside sources believed to be reliable. While all reasonable care has been taken to ensure that the facts stated and the opinions given are accurate, complete and reasonable, liability is expressly disclaimed by AAM and any affiliates (collectively known as “AAM”), and their representative officers and employees. This report has been prepared for informational purposes only and does not purport to represent a complete analysis of any security, company or industry discussed. Any opinions and/or recommendations expressed are subject to change without notice and should be considered only as part of a diversified portfolio. A complete list of investment recommendations made during the past year is available upon request. Past performance is not an indication of future returns.This information is distributed to recipients including AAM, any of which may have acted on the basis of the information, or may have an ownership interest in securities to which the information relates. It may also be distributed to clients of AAM, as well as to other recipients with whom no such client relationship exists. Providing this information does not, in and of itself, constitute a recommendation by AAM, nor does it imply that the purchase or sale of any security is suitable for the recipient. Investing in the bond market is subject to certain risks including market, interest-rate, issuer, credit, inflation, liquidity, valuation, volatility, prepayment and extension. No part of this material may be reproduced in any form, or referred to in any other publication, without express written permission.

August 2, 2016 by

Within the investment grade fixed income market, there are four primary ways to enhance return: credit quality, liquidity, duration, or structure.  All of these strategies introduce additional risk to the insurer’s balance sheet. We believe that there is one more lever for a taxable P&C insurer to pull, the crossover trade between taxable and tax-exempt securities.  This trade does not involve adding incremental risk to the organization, rather it involves closely watching the spread relationship between taxable and tax-exempt securities, to exploit the opportunity as it presents itself.

Why an opportunistic strategy emphasizing average life, structure and liquidity is optimal.

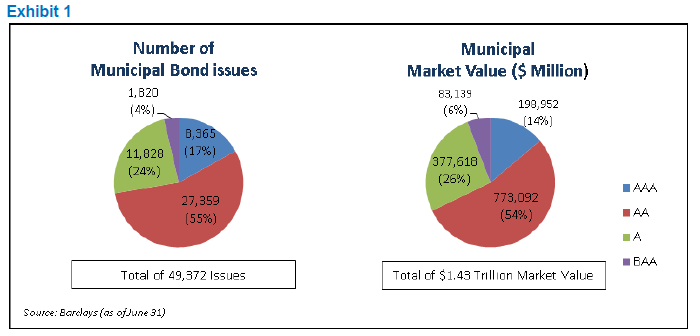
Let’s begin by stating the obvious – the tax exempt municipal bond sector is illiquid and concentrated in high quality issues. From Exhibit 1 below, there are 49,372 issues in the Barclays’ Municipal Bond Index with a market value of $1.43 trillion.Muni Paper Exhibit 1

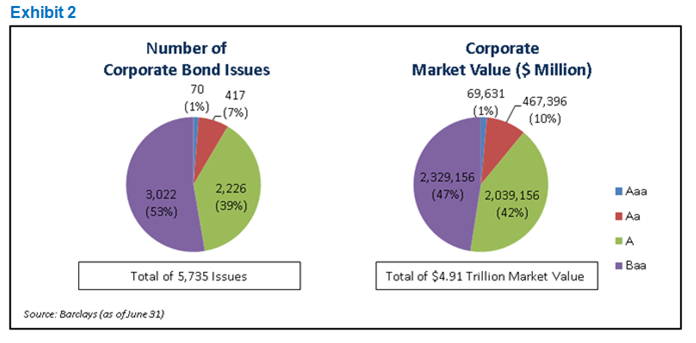
By comparison, there are 5,735 issues in the Barclays’ Corporate Index with a market value of $4.91 trillion as outlined in Exhibit 2. Thus, the Corporate Index has 11.6% of the number of issues and 3.4 times the market value of the Municipal Index.

Muni Paper Exhibit 2

Also note that the Barclays’ Municipal Index (by market value) contains 26% and 6% of ‘A’ and ‘BAA’ rated issues, respectively.  By contrast, the Barclays’ Corporate Index contains 39% and 53% of ‘A’ and ‘BAA’ rated issues. To put the market value of the ‘A’ rated municipal bonds into perspective, it is slightly less than the market value of Exxon Mobil common stock.

To summarize, constructing diversified municipal bond portfolios with a down-in-credit, yield-oriented focus involves investing in a small corner of an illiquid municipal bond market. The constraints of the investable municipal universe preclude any ability to scale across a large asset base.

A Scalable Alternative

Taxable insurance companies seek to optimize after-tax yield and total return opportunities across the yield curve within the duration, quality and other constraints of their policy statement.  As outlined in Exhibit 3 below, the relative attractiveness of tax exempt municipal bond yields (relative to comparable maturity Treasury issues) varies greatly across the yield curve. Using seven year weekly averages, the yield spread advantage (pre-tax equivalent yield for insurance companies) of ten year municipal bonds is 86 basis points greater than in three year bonds. In addition, the range of yield spreads is far greater in the ten year area.

At AAM, we track spread relationships and Z scores on a daily basis. A trading strategy that involves purchasing ten year tax exempt municipal bonds when spreads (versus Treasury notes) are at a Z score of +2.0 and selling at -2.0 produced five round-trip opportunities for purchase and sale over the past seven years. Because both the average yield change and duration are much greater for the ten year municipal bond in comparison with the three year issue, the total return opportunity from the trading strategy is greater in the ten year part of the yield curve and produces a return advantage of 18.99% over the seven year period (2.51% on an annualized basis). Please see Exhibit 3 and the footnotes below for details.

Muni Paper Exhibit 3

One additional comment should be made about three year municipal bond yields. With an average spread over a three year Treasury bond of only 33 BP (based on seven years of data), there are much higher yielding opportunities in the taxable bond market. Thus, short municipal bonds should be viewed as a source of funds for yield enhancement opportunities in other taxable bond sectors.

A high quality approach leads to a stable credit profile

As of July 15, 2016 per Thomson Reuters, the average yield spread between ‘A’ and ‘AA’ rated tax exempt ten year municipal bonds is 29 basis points (114 basis points over the yield of a ten year U.S. Treasury bond). This yield differential is at the very narrow end of the range over the past 7 years and was as much as 106 basis points in July 2009.  A comparison of the 29 basis point yield advantage of ‘A’ rated issues (which will more likely be part of a buy and hold strategy due to the illiquidity of ‘A’ rated bonds) with the annualized total return from the trading strategy of 2.51% annually highlights why an opportunistic trading strategy is superior.

At AAM, we believe it is critically important to analyze relative value at each and every point along the yield curve.

An opportunistic trading strategy requires investing in liquid bonds, which generally leads to high quality credits.  Maintaining liquidity in municipal portfolios also requires a focus on coupon to avoid the negative tax consequences from a municipal bond trading at a discount price.  Lastly, liquidity and tradability are enhanced by avoiding certain call structures.

To be clear, there are select ‘A’ rated issuers that offer value.  But in our view, the opportunistic trading strategy that we have outlined is a better and more sustainable investment framework for managing taxable insurance company portfolios.

An important  consideration is that the ability to trade fixed income securities is challenged in today’s market.  This is especially  the case for tax exempt municipal bonds.  Investors looking to employ an opportunistic trading strategy must be large enough to fully participate in the primary market.  Conversely, investors must be small enough to meaningfully execute purchase and sale programs within the narrow time windows when these opportunities are available.  Due to these constraints, large municipal bond managers will likely have difficulty employing an opportunistic strategy.

We’ve discussed relative trading opportunities in tax exempt municipals, but it is important to point out that


Characteristics of An Opportunistic Trading Strategy

1. Focus on liquidity:  Liquidity allows for the portfolio to be repositioned without significant transaction costs.

2. Focus on 10 year durations: The ten year part of the yield curve provides the better total return opportunity.

3. Focus on high quality credits:  An opportunistic trading strategy requires investing in liquid bonds, generally leading to high quality credits.

insurance companies have other reasons to sell tax exempt bonds. With all credits, avoiding downgrades and impairment are critical factors for successful investing.

A high quality approach leads to a stable credit profile. This is very important in the municipal market as the availability of financial information is generally on an annual basis with a lag. In addition, the ability to fully benefit from the tax exemption of municipal income depends on underwriting profitability, which is subject to change based on each company’s underwriting experience. Maintaining a highly liquid municipal portfolio enables a company to reposition its portfolio without significant transaction costs (bid-offer spreads) when its tax situation changes.


Footnotes
The calculations are based on weekly yields from Thomson Reuters and Bloomberg over the seven year period ending July 15, 2016 using a 1.4577 tax adjustment factor on municipal yields to reflect the pre-tax equivalent yield of municipal bonds for insurance companies. This pre-tax equivalent yield on a ten year municipal bond is compared to comparable maturity Treasury yields to determine the yield spread. The standard deviation and range are also calculated from this relationship.
The Z score is calculated on a one year trailing basis using the pre-tax equivalent yield spread relationships outlined in (1) above.
The number of ‘round trips of going from -2.0 to +2.0 Z scores over this period and vice versa. This captures the number of round trip trading opportunities at extreme valuations.
The pre-tax return advantage from relative bond price movements versus comparable maturity Treasury notes over a seven year period is calculated by taking the nominal yield movements from purchases and sales when the municipal bond yield Z score is +2.0 and -2.0, respectively and calculating a price move based on the duration of three and ten year municipal bonds. The cumulative seven year number is annualized.

Written by:

GregoryABell
Gregory Bell, CFA
Director of Municipal Bonds, Principal

Joseph Borgmann
John Schaefer, CFA
President, Principal

Additional Contributor:
Daniel Nagode

Disclaimer: Asset Allocation & Management Company, LLC (AAM) is an investment adviser registered with the Securities and Exchange Commission, specializing in fixed-income asset management services for insurance companies. This information was developed using publicly available information, internally developed data and outside sources believed to be reliable. While all reasonable care has been taken to ensure that the facts stated and the opinions given are accurate, complete and reasonable, liability is expressly disclaimed by AAM and any affiliates (collectively known as “AAM”), and their representative officers and employees. This report has been prepared for informational purposes only and does not purport to represent a complete analysis of any security, company or industry discussed. Any opinions and/or recommendations expressed are subject to change without notice and should be considered only as part of a diversified portfolio. A complete list of investment recommendations made during the past year is available upon request. Past performance is not an indication of future returns.
This information is distributed to recipients including AAM, any of which may have acted on the basis of the information, or may have an ownership interest in securities to which the information relates. It may also be distributed to clients of AAM, as well as to other recipients with whom no such client relationship exists. Providing this information does not, in and of itself, constitute a recommendation by AAM, nor does it imply that the purchase or sale of any security is suitable for the recipient. Investing in the bond market is subject to certain risks including market, interest-rate, issuer, credit, inflation, liquidity, valuation, volatility, prepayment and extension. No part of this material may be reproduced in any form, or referred to in any other publication, without express written permission

May 2, 2016 by

Relative value performance for tax-exempts were volatile during the first quarter of 2016. Tax-adjusted yield spreads to Treasuries for 10-year maturities dropped as low as 40 basis points (bps) during the first week of the year, before widening to a 91 basis points (bps) spread by the first week of March. Most of this volatility in relative performance was a direct result of the rapidly shifting supply/demand imbalances within the sector, combined with a substantial flight-to-quality rally for Treasuries. Although both sectors benefited from the “risk-off” demand, Treasury rates during the quarter fell by 50 basis points (bps), while municipal yields fell by only 22 basis points (bps).

During January, in addition to the flight-to-quality trading that developed, tax-exempt performance also benefited from very strong seasonal technicals that typically occurs during the first two months of the year. A combination of robust reinvestment flows and a dearth of new issuance supply helped push tax-adjusted spread levels to Treasuries to a near ten year low on January 7 of 40 basis points (bps). Spreads remained at these overbought levels for most of January before crossover investors started selling aggressively. In addition to the selling pressure, tax-exempt new issue supply started to see a considerable rebound from levels exhibited over the prior five months. After new issuance averaged only $27 billion per month from September 2015 to January 2016, average supply for February and March increased by 30%.

February issuance came in relatively heavy at $31 billion. That was an increase of 22% relative to the 10 year average for February supply. Supply in March was also heavy at $39.3 billion, with refinancing activity leading the way at $16 billion. During February and March, refinancings averaged $14.45 billion, resulting in an increase of 76% versus the monthly average over the prior 5 month period. During the fourth quarter of 2015, municipalities scaled back their refunding activity in an attempt to avoid any potential market volatility surrounding the timing of the Federal Reserve’s first expected move towards normalizing rates. With that event now past and the market demand for tax-exempts exceptionally strong, issuers have started to take advantage of the low absolute rate environment during the quarter.

Weaker supply Technicals are expected to remain in place for the next 2.5 months. As of April 11, 2016 10 year municipal rates were at 1.59%, which remains at a very compelling level for issuers to continue targeting debt service savings through refinancings. Additionally, infrastructure-related financings have been on the rise this year. On a year-to-date basis, new issuance classified as “new money” is up 27% versus 2015. The combination of these two components are expected to help the market produce a total of $80 billion in issuance in May and June, and potentially provide for very compelling entry points for a sector rotation move into the tax-exempt sector. At the moment, tax-adjusted spread levels for 10 year maturities stands at 50 basis points (bps), which we view as expensive heading into the expected supply surge. We are currently positioning accounts to an underweight exposure to the sector until compelling opportunities present themselves that warrant a move to a neutral or overweight bias.

Written by:

GregoryABell

Gregory A. Bell, CFA, CPA
Principal and Director of Municipal Products

Disclaimer: Asset Allocation & Management Company, LLC (AAM) is an investment adviser registered with the Securities and Exchange Commission, specializing in fixed-income asset management services for insurance companies. This information was developed using publicly available information, internally developed data and outside sources believed to be reliable. While all reasonable care has been taken to ensure that the facts stated and the opinions given are accurate, complete and reasonable, liability is expressly disclaimed by AAM and any affiliates (collectively known as “AAM”), and their representative officers and employees. This report has been prepared for informational purposes only and does not purport to represent a complete analysis of any security, company or industry discussed. Any opinions and/or recommendations expressed are subject to change without notice and should be considered only as part of a diversified portfolio. A complete list of investment recommendations made during the past year is available upon request. Past performance is not an indication of future returns.

This information is distributed to recipients including AAM, any of which may have acted on the basis of the information, or may have an ownership interest in securities to which the information relates. It may also be distributed to clients of AAM, as well as to other recipients with whom no such client relationship exists. Providing this information does not, in and of itself, constitute a recommendation by AAM, nor does it imply that the purchase or sale of any security is suitable for the recipient. Investing in the bond market is subject to certain risks including market, interest-rate, issuer, credit, inflation, liquidity, valuation, volatility, prepayment and extension. No part of this material may be reproduced in any form, or referred to in any other publication, without express written permission.


October 23, 2015 by

Tax-Exempts Performed Well in the Midst of Market Volatility

The municipal market remained resilient as it navigated through a number of issues during the quarter, including anticipation of potential Federal Reserve action on interest rates and volatility in global financial markets.  Additionally, the municipal sector continued to avoid any contagion risks due to the negative credit developments in Puerto Rico.  During the quarter, as expected, the Commonwealth did indeed default on its appropriation-backed debt payments due for the Puerto Rico Public Finance Corp. Further defaults are expected as the Commonwealth faces a liquidity crisis as its cash balances continues to dwindle during the fourth quarter.

In the face of these developments, municipals performed well, with 10-year yields during the quarter collapsing by 25 basis points (bps).  The sector was largely supported by very strong seasonal technicals.  On the demand side, the market was buoyed by heavy reinvestment flows of coupons/calls/maturities, which are at their highest levels of the year during the summer months. Supply technicals during the quarter were also beneficial to market performance.  Although new issuance in July and August increased by 26% versus the same period in 2014 to a total of $66.1 billion, September issuance plunged to $18.3 billion, a drop of 27.3% relative to the same period in 2014.  That was the lowest monthly total reported over the last 19 months.  The dramatic drop off in issuance was likely driven by a reluctance of issuers to come to market during expectations for both a lift-off in short term rates by the FOMC (Federal Open Market Committee) and a thinning of market participation due to vacations and holidays during the month.

Underlying credit fundamentals also provided support for the sector.  As reported by the U.S. Census Bureau, state and local government revenues exhibited a strong showing in the second quarter with a growth rate of 6.9% versus second quarter 2014 levels.  That compares favorably to revenue growth over the prior three quarters that averaged 4.2%.  Additionally, outside of the ongoing fiscal struggles of Puerto Rico, Illinois and New Jersey, and a budget stalemate in Pennsylvania, headline risk has remained muted and the sector has continued to exhibit slow, but steady improvement in fundamentals.  The improving credit profile, combined with the FOMC’s postponement in raising rates, has already resulted in solid improvement in mutual fund flows over the last month.  After funds reporting on a weekly basis reported average outflows of $359 million per week from August 26 through September 16, fund flows have turned positive, with a weekly average of $300 million in inflows over the last four weeks.  Additionally, these flows have largely targeted longer duration assets.  Funds that were classified as “long-term” recorded a four-week average of $459 million of inflows.

Looking forward, with the rally in rates during the quarter, the current level of yields could provide headwinds for relative market performance during the fourth quarter.  As of this writing, 10-year yields are at 2.03%, which has historically been very conducive to a heavy refinancing/refunding cycle.  During the first four months of this year, “AAA” 10-year rates averaged 1.96% and during that period, deals that were classified as straight refinancings/refundings, averaged approximately $17 billion per month.  Since that time, as rates moved higher during the year, the average over the last five months plunged by 41% to $10 billion per month.  If rates remain near current levels or move lower from here, we could see some upside surprise in new issuance levels.

However, we remain constructive on the sector.  As of the end of the third quarter, total refinancings are up over 56% versus the same time period in 2014 and have made up over 64% of total new issuance for the year.  We believe that the called bond proceeds generated from this spike in year-to-date refinancings will provide solid sponsorship for the expected overall increase in issuance during the fourth quarter, and make supply technicals appear manageable.  Additionally, although we could experience some near-term volatility in relative valuation levels on heightened supply concerns, strong seasonal technicals return in December, as supply begins to wane into the new year and heavy reinvestment flows enter the market starting on December 1.  If the sector experiences any deterioration in relative valuation levels, we would view this as an opportunity to further increase our overweight position to the sector.

Gregory A. Bell, CFA, CPA
Principal and Director of Municipal Products

Disclaimer: Asset Allocation & Management Company, LLC (AAM) is an investment adviser registered with the Securities and Exchange Commission, specializing in fixed-income asset management services for insurance companies. This information was developed using publicly available information, internally developed data and outside sources believed to be reliable. While all reasonable care has been taken to ensure that the facts stated and the opinions given are accurate, complete and reasonable, liability is expressly disclaimed by AAM and any affiliates (collectively known as “AAM”), and their representative officers and employees. This report has been prepared for informational purposes only and does not purport to represent a complete analysis of any security, company or industry discussed. Any opinions and/or recommendations expressed are subject to change without notice and should be considered only as part of a diversified portfolio. A complete list of investment recommendations made during the past year is available upon request. Past performance is not an indication of future returns.

This information is distributed to recipients including AAM, any of which may have acted on the basis of the information, or may have an ownership interest in securities to which the information relates. It may also be distributed to clients of AAM, as well as to other recipients with whom no such client relationship exists. Providing this information does not, in and of itself, constitute a recommendation by AAM, nor does it imply that the purchase or sale of any security is suitable for the recipient. Investing in the bond market is subject to certain risks including market, interest-rate, issuer, credit, inflation, liquidity, valuation, volatility, prepayment and extension. No part of this material may be reproduced in any form, or referred to in any other publication, without express written permission.

  • « Go to Previous Page
  • Page 1
  • Page 2
  • Page 3
  • Page 4
  • Page 5
  • Page 6
  • Go to Next Page »

Get updates in your inbox.

  • Investment Strategies
    • Investment Grade Fixed Income
    • Specialty Asset Classes
  • Our Clients
    • Client Experience
    • Sample RFP Download
  • Insights
    • Video
    • Webinar
    • News
    • Podcasts
  • About
    • Our Team
    • Contact
    • Client Login

Disclaimer: Asset Allocation & Management Company, LLC (AAM) is an investment adviser registered with the Securities and Exchange Commission, specializing in fixed-income asset management services for insurance companies. Registration does not imply a certain level of skill or training. This information was developed using publicly available information, internally developed data and outside sources believed to be reliable. While all reasonable care has been taken to ensure that the facts stated and the opinions given are accurate, complete and reasonable, liability is expressly disclaimed by AAM and any affiliates (collectively known as “AAM”), and their representative officers and employees. This report has been prepared for informational purposes only and does not purport to represent a complete analysis of any security, company or industry discussed. Any opinions and/or recommendations expressed are subject to change without notice and should be considered only as part of a diversified portfolio. A complete list of investment recommendations made during the past year is available upon request. Past performance is not an indication of future returns. This information is distributed to recipients including AAM, any of which may have acted on the basis of the information, or may have an ownership interest in securities to which the information relates. It may also be distributed to clients of AAM, as well as to other recipients with whom no such client relationship exists. Providing this information does not, in and of itself, constitute a recommendation by AAM, nor does it imply that the purchase or sale of any security is suitable for the recipient. Investing in the bond market is subject to certain risks including market, interest-rate, issuer, credit, inflation, liquidity, valuation, volatility, prepayment and extension. No part of this material may be reproduced in any form, or referred to in any other publication, without express written permission. *All figures shown are approximate and subject to change from quarter to quarter. **The accolades and awards highlighted herein are not statements of any advisory client and do not describe any experience with or endorsement of AAM as an investment adviser by any such client.

Copyright © 2024 AAM | Privacy and Disclosures

  • LinkedIn
  • YouTube