• Skip to primary navigation
  • Skip to main content
  • Skip to footer
AAM CompanyTransparent Logo

AAM Company

AAM Company Website

  • Investment Strategies
    • Investment Grade Fixed Income
    • Specialty Asset Classes
  • Clients
    • Our Clients
    • Client Experience
    • Download Sample RFP
  • Insights
    • Video
    • Webinars
    • Podcasts
    • News
  • About
    • Our Team
    • Events
  • Login
  • Contact Us
Contact

Sector Commentary

April 21, 2021 by

FIRST QUARTER CORPORATE CREDIT UPDATE

Market Summary and Outlook

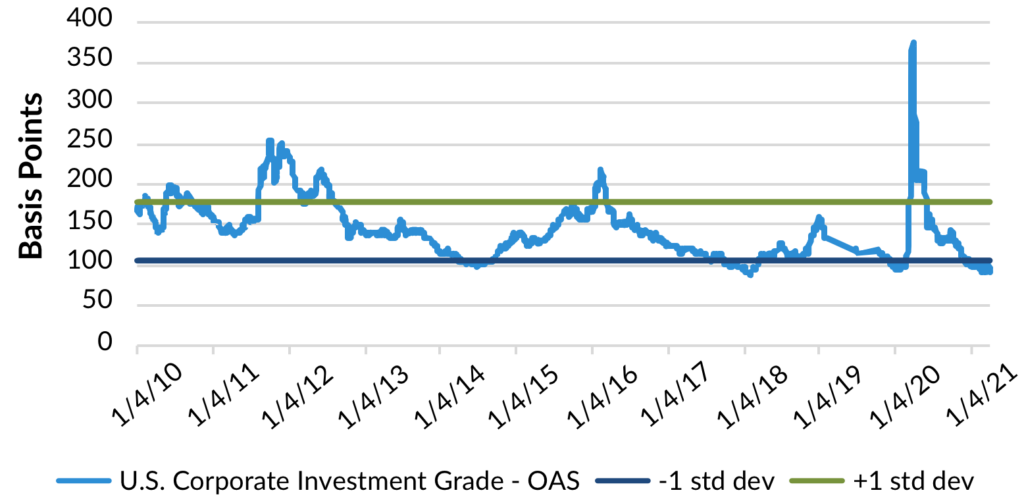
The Investment Grade (IG) Corporate bond market (per Bloomberg Barclays Index) generated modest returns in the first quarter of 2021, with an excess return versus a duration neutral Treasury of 1.0%. On a total return basis, the IG market had one of its worst quarters due to rising Treasury yields, generating a return of -4.7%. Hence, Corporate bonds underperformed the S&P Index, which returned 6.2% and the High Yield market (per Bloomberg Barclays) at 0.9%. The option adjusted spread (OAS) of the market tightened 5 bps in the first quarter, with virtualy all the outperformance coming from the long end, and BBBs outperformed higher quality. Spreads tightened despite heavier than expected new issuance in the first quarter and increased rate volatility. 

Exhibit 1: Corporate IG OAS is Statistically Rich
Source: Bloomberg Barclays Index, AAM

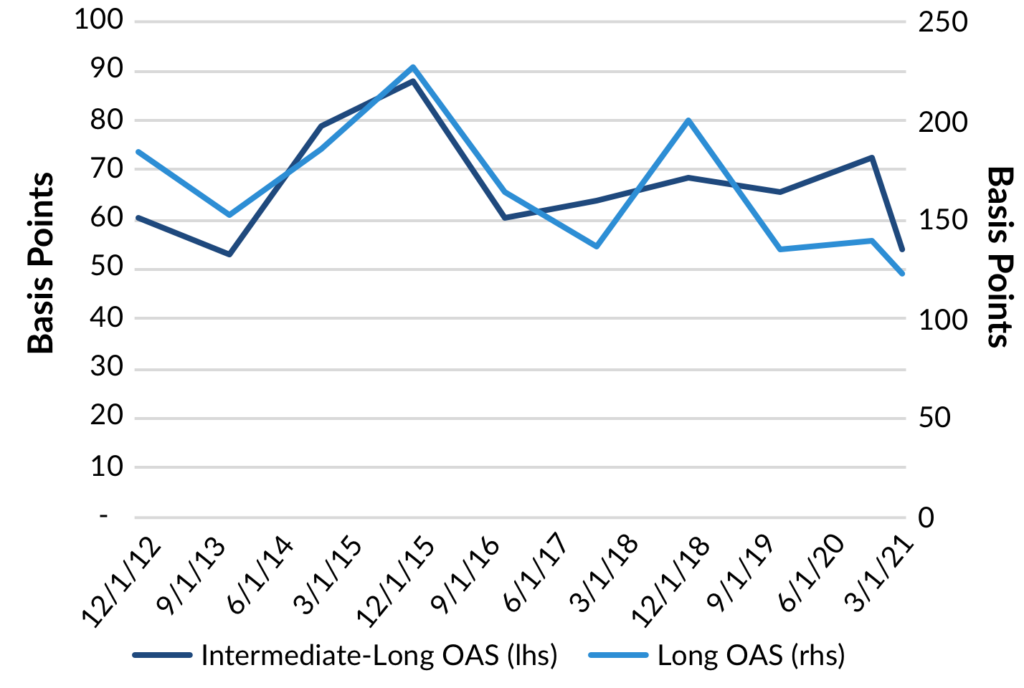
The outperformance in the long end and BBBs is likely being driven by yield oriented investors, who are awash in liquidity, facing a lackluster opportunity set with low global yields and falling default risk. The credit curve has flattened to a cyclical low (Exhibit 2), with short end spreads widening and long end spreads tightening this year. Until we see higher yields away from Corporate Bonds or the Fed signals it will begin tapering asset purchases, we expect this trend to continue, albeit at much slower pace. Despite rising inflation expectations, the Federal Reserve is expected to remain accommodative at least through 2021. 

Exhibit 2: The Credit Curve Flattens as Credit Risk Premiums Fall
Source: Bloomberg Barclays Index, AAM

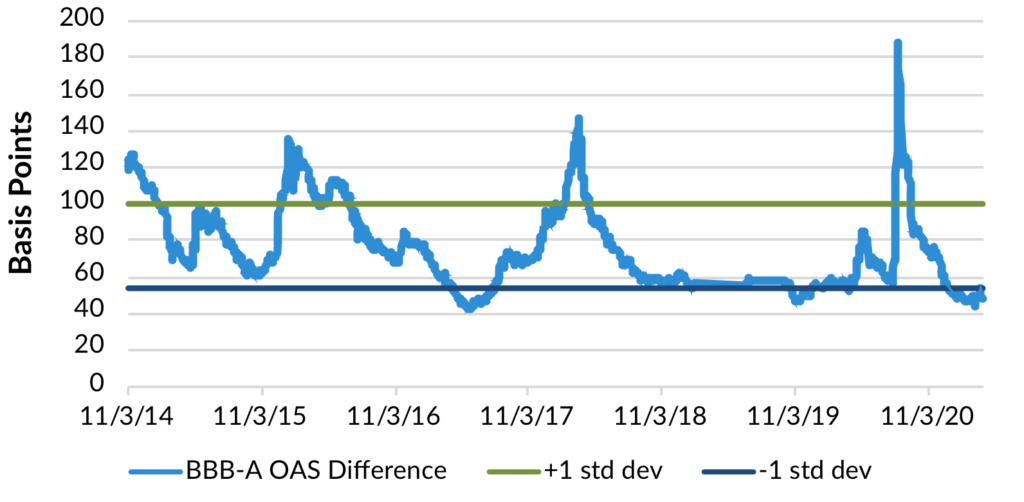
The spread premium investors receive from buying ‘BBB’ rated corporate bonds vs. ‘A’ rated has compressed to a cycle tight. As you can see in Exhibit 3, this basis can remain quite low for some time until there is a fundamental threat to the market. ‘BBB’s widen more than ‘A’ rated credits because of the increased risk of falling to high yield, which adds both increased default and technical risks to the bonds. Since we are early in the economic recovery with unprecedented simultaneous monetary and fiscal support, we view the risk of a fundamental threat as very low. Therefore, until we are later in the cycle or see an emerging threat, we will continue to advocate an overweight BBB position.

Exhibit 3: The Credit Risk Premium Has Fallen as the Economic Outlook Improves
Source: Bloomberg Barclays Index, AAM

What are the risks to spreads?

As we had expected, OAS volatility has been minimal this year, with a range of 12 basis points (bps). We expect this to continue in the second quarter, although tax reform related volatility or continued inflation and/or economic data surprises could be the next catalyst for increased spread volatility. 

Tax reform

After tax reform was passed at the end of 2017, the OAS moved to its 5-year tights, to 84 bps as investors became more optimistic about growth and the increased incentive for corporations to reduce debt (Bloomberg Barclays Corporate Index). Depending on the magnitude of the change, spreads could soften if growth prospects dim. During the period of 2018-2019, average debt leverage remained flat, as debt increased in line with EBITDA. It was in 2016 when debt leverage fell as companies waited for more information related to taxes and policy. There are many differences today vs. 2017 that will influence the capital allocation decisions of management and Boards. While we would expect companies to generally deleverage this year, management teams are being asked to invest in their businesses at a time of attractive capital and potential investment opportunities and growth. We would view rising tax rates as a headwind for spreads generally. The one caveat is if the plan is viewed as benefiting those sectors and companies (i.e., small businesses) from a top line perspective that will be hurt disproportionately. 

Taper tantrum

While we would expect spreads to eventually tighten after a period of volatility induced widening by the Fed as we saw in May of 2013, the long end performance in Corporates is more questionable. The “taper tantrum” sent spreads widening by about 20-25 bps, but after yields became more attractive, buyers stepped in especially on the long end. This caused the Corporate 10s-30s curve to flatten to approximately where it is today (~50bps) (Bloomberg Barclays Corporate Index). As Treasury volatility continued in 2013, long end spreads remained relatively flat while intermediate maturities outperformed. With spreads so tight today and credit curves generally flat, there is little room for this type of volatility without impacting performance. The basis is also vulnerable if these moves cause rising hedging costs or materially higher Treasury yields given the potential softening of market technicals. 

Where do we see value in the market?

As spreads have tightened, we have been selling bonds with unattractive spreads versus peers and buying those that provide attractive compensation for liquidity and/or industry risk premiums that we calculate in the near to intermediate term. Specifically, we sold bonds in the first quarter that have limited spread tightening potential most often due to the high-quality nature of the credit and/or industry outperformance. Examples of those include: Aerospace/Defense, Chemicals, Infrastructure, Pharmaceuticals, Retail, and Universities. Conversely, we added to sectors that we believe offer attractive risk adjusted income opportunities, such as: BBB rated REITs, Technology, Packaging, and Advertising. 

We are being selective in the high-quality rating opportunity set, buying credits we believe have upward momentum fundamentally, as spreads are very tight with low break-evens. We are adding to sectors we believe offer more value today vs. historical levels with positive fundamental outlooks, such as Asset Managers, Communications and possibly Airline Lessors. We continue to see more value in sectors that will benefit from the recovering economy. Lastly, market liquidity continues to be cheaply priced given the absolute level of spreads, so we are taking advantage of those premiums when possible in sectors like Community Banks and Private Placements. 
April 21, 2021 by

FIRST QUARTER MUNICIPAL BONDS UPDATE

Recap

During the first quarter of the year, Treasury rates moved aggressively higher amid improving economic growth and higher inflations expectations. Based on data from Bloomberg, 10 and 30yr rates moved higher by 83 and 77 basis points (bps), respectively, with the overall yield curve from 2 to 30yrs steepening by 73bps. Tax-exempt yields reported by Refinitiv Municipal Market Data (MMD) also moved higher by 29bps, but relative valuations to taxables improved dramatically. Very favorable demand technicals from heavy seasonal reinvestment flows, combined with a very manageable new issue calendar, provided the impetus for substantial outperformance. Ratios of municipal-to-Treasury yields in 10yrs reached a record low of 53.95% in Mid-February, before ending the quarter at a still very expensive 64.3%.

Taxable municipals also performed well during the quarter. In reviewing data compiled by AAM, ‘AAA’ muni spreads to Treasuries moved tighter by 5 to 14bps, with the 30yr part of the curve exhibiting the strongest performance. Improving supply technicals, along with persistent demand, were likely the primary catalysts for the spread tightening. New issuance has been down significantly from the peak of issuance that occurred during the June-to-October 2020 period. Based on data from the Bond Buyer, issuance of municipal-only cusips during that period averaged $16.6 billion per month as issuers rushed to execute deals before the November general elections. Since that time, taxable muni issuance has only averaged $7.8 billion per month. The overall higher rate environment has likely reduced the present value savings of taxable refinancings, which we expect was the primary driver of taxable municipal supply. Additionally, with the Democrats in control of both the executive and legislative branches, there is strong speculation that tax reform will be implemented this year, which is expected to include a restoration of tax-exempt advance refundings. As reported by the Bond Buyer, a bipartisan bill called Investing in Our Communities Act has already been introduced by Reps. Steve Stivers, R-Ohio, and Dutch Ruppersberger, D-Md., and the bill has 21 Democrat and Republican cosponsors. Ruppersberger and Stivers are co-chairs of the House Municipal Finance Caucus. With tax-exempt relative valuations near record levels, we believe the cost savings for executing tax-exempt advance refundings is substantial enough that issuers are expected to wait until this technique is restored to the tax-exempt market before resuming large scale refinancings. 

Credit Tailwinds from Fiscal Stimulus

Policy initiatives are generally expected to be constructive for the municipal market. The first major initiative enacted by the Biden administration was the passing of the $1.9 trillion America Rescue Plan Act (ARP). The legislation provided $350 billion in direct aid to state and local governments. The stimulus was designed to help replace COVID-induced lost revenue, stabilize budgets and restore liquidity. The aid has been viewed as a major credit positive, with Standard and Poor’s subsequently revising their outlooks on the state and local government sectors to stable from negative. Moody’s also revised their outlook to stable from negative, citing the strong fiscal support and stronger-than-expected tax collections. 

Outlook: Heavier Supply Expected During the Second Half of the Year

The next major agenda item for the Biden administration will be the American Jobs Plan, which was introduced at the end of the first quarter. The $2.2 trillion infrastructure package, along with tax-reform within the Made in America Tax Plan, are expected to contain provisions that will affect municipal supply technicals over the balance of the year. Although details are still forthcoming as to the financing structure of the infrastructure plan, news sources reported that the Chairman of the House Ways and Means Committee, Richard Neal, indicated that federally subsidized Build America Bonds will be part of the legislation. The direct-pay bonds, which were used as part of the infrastructure spending initiative under the Obama/Biden administration, were introduced with a federal subsidy of 35%. It is unclear at this time what the overall size of this program will be under Biden’s plan, but the original issuance totaled ~$182 billion of taxable municipal debt over two years, before the program expired in 2010. 

The source of funding for the infrastructure is expected to come from tax-reform measures incorporated within the Made in America Tax Plan. The plan is expected to incorporate an increase in the corporate tax rate to 28% from 21%. The Biden administration estimates that the provisions within the legislation will generate a total of $2 trillion in tax revenue over 15yrs. 

As mentioned earlier in this writing, this tax-reform legislation is also likely to include the restoration of tax-exempt refinancings. Unless we see a substantial weakening in relative valuations for tax-exempts before this legislation can be passed, we expect to see much higher issuance of tax-exempt debt during the second half of the year. 

Another potential tax-reform measure that could be included in the legislation is the repeal of the $10,000 cap on state and local tax deductions (SALT). The cap has been largely felt in high-tax states and many of the representatives from these jurisdictions are making their support of the infrastructure package contingent on the inclusion of the SALT repeal in the infrastructure plan. With thin majorities in both the House and Senate, the Biden administration will have to strongly consider the repeal, even though the reported costs of its inclusion is estimated to be more than $600 billion, based on data from the Tax Policy Center. If the cap is removed, that would reduce the tax burden on wealthier investors and soften the retail demand for tax-exempts at a time when supply could dramatically accelerate due to the potential restoration of tax-exempt advance refundings. 

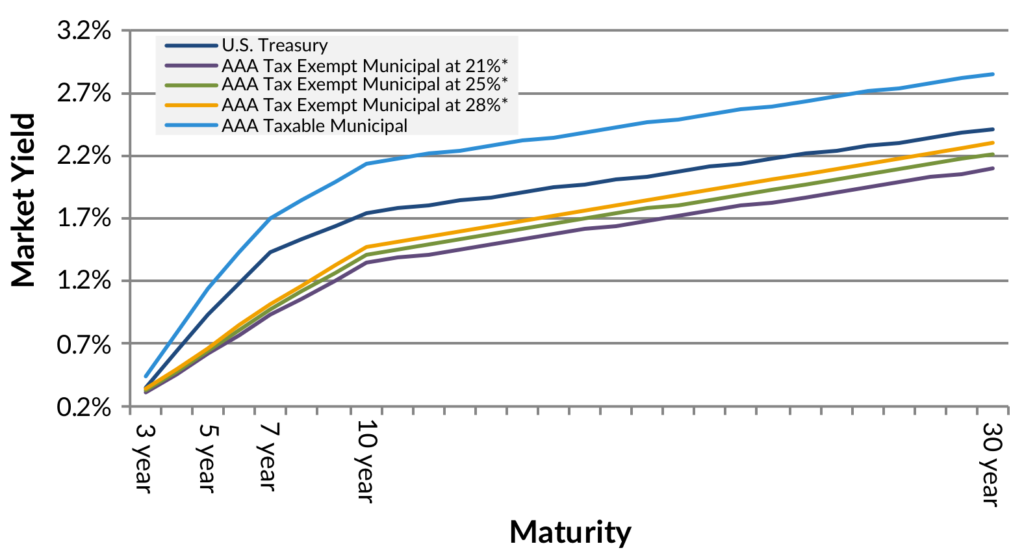
In terms of demand from institutional investors like insurance companies, the effects of the increase in corporate rates is not expected to materially increase their demand for tax-exempts, in our opinion. In the graph below (Exhibit 1), we highlight the yield curves between taxable municipals, Treasuries and tax-exempts, with yields tax-adjusted using corporate rates of 21% and 28%. We also included the tax-exempt yields tax-adjusted at a 25% corporate rate. At least one senator, Joe Manchin of West Virginia, has expressed a desire to cap the corporate tax increase to a rate of 25%. Under either event in the current yield environment, the additional yield carry of 10yr taxable munis to same-tenor tax-exempts stands at a very compelling 67 and 73bps at a 25% and 28% corporate rate, respectively. Consequently, we expect demand for taxable munis from institutional investors should remain firmly entrenched. 

Exhibit 1: Market Yields as of 3/31/2021

Source: Refinitiv Municipal Market Data, Bloomberg, AAM. *21% Corp Rate Tax-Adjusted at a Factor of 1.1994. *25% Corp Rate Tax-Adjusted at a Factor of 1.2633. *28% Corp Rate Tax-Adjusted at a Factor of 1.316.

While we expect taxable muni supply to move higher over the second half of the year, we continue to expect global and domestic demand for taxable munis will remain intact throughout the year. We also view current valuations for taxable municipals to be at fair value relative to historical spread relationships to the corporate market. Given the substantial yield advantage of taxable munis to tax-exempts, along with the potential for sizable technical imbalances to develop in the tax-exempt market, we continue to advocate a significant underweight to the tax-exempt sector in favor of taxable alternatives across the yield curve.

February 2, 2021 by

Economic Outlook – Marco Bravo, CFA | Senior Portfolio Manager

Market Outlook – Reed Nuttall, CFA | Chief Investment Officer

Corporate Credit – Elizabeth Henderson, CFA | Director of Corporate Credit

Structured Products – Scott Edwards, CFA | Director of Structured Products

Municipal Market – Gregory Bell, CFA, CPA | Director of Municipal Bonds

High Yield – Scott Skowronski, CFA | Senior Portfolio Manager

Convertibles – Tim Senechalle, CFA | Senior Portfolio Manager

Economic Outlook

With 2020 now in the rearview mirror, we look forward to a resurgence in economic growth for 2021. After falling an estimated 2.5% on a Q4/Q4 basis in 2020, U.S. real GDP is projected to increase by 3.8% in 2021 (Bloomberg survey consensus estimates). As shown on exhibit 1, consumer spending and private investment are expected to lead the way this year. Consumers are starting the year with a large degree of savings, improving employment prospects, and the potential for additional COVID-related aid out of Washington, all of which will be supportive for consumer spending. On the private investment side, low mortgage rates should continue to support a strong housing market, and a rebound in corporate earnings should lead to increased investment. Downside risks are largely centered around COVID and a slower than anticipated rollout of vaccines. At AAM, we view the risks to GDP growth as skewed to the upside for 2021 and expect the U.S. economy to outperform consensus estimates.

Exhibit 1: Contribution to GDP Growth

Source: Bureaus of Economic Analysis, Bloomberg. Data excludes residual component

Market implied inflation expectations have moved higher recently, likely the result of the potential for increased fiscal stimulus from the Biden administration, as well as weakness in the US dollar. Since the end of Q3 2020, the 10yr breakeven TIPs rate has increased by 46 basis points to a current rate of 2.09% (US Treasury, Bloomberg). Given excess global supply and slack in the economies, we don’t expect actual inflation to move above 2% this year. 

The Federal Reserve last year introduced its new Flexible Average Inflation Target (FAIT) framework for monetary policy. Under this new framework, the Federal Reserve will be more focused on achieving full employment versus price stability. We believe this means that the Fed will no longer preemptively raise rates in order to stave off inflation. In fact, the Fed has made it clear that they will tolerate inflation moving above their 2% target for a period of time. With inflation expected to remain relatively benign, and the unemployment rate projected to remain above 5% this year, we expect monetary policy to remain accommodative. We think the earliest that the Fed will begin tapering their purchases of Treasury and MBS securities is 2022, and expect no change in the Fed Funds rate at least through the next two years.

Treasury yields, according to consensus forecasts, are expected to move modestly higher from current levels with a steeper yield curve. With Fed policy on hold, it’s expected for short-term Treasury rates to remain anchored to the Fed Funds rate. The benchmark 10-year Treasury yield is forecasted to end 2021 at 1.3% based on the median forecast among economists surveyed by Bloomberg. Increased federal spending and rising inflation expectations present upside risks to forecast. These risks can be offset by the continued low level of sovereign bond yields in Europe and Japan. Any significant widening in the yield differential between U.S. and non-U.S. sovereign debt will likely attract demand from foreign investors, limiting the rise in U.S. rates. Perceived weakness in the US dollar does have the potential to hamper demand from foreign investors. We are calling for the 10-year Treasury yield to end the year in a range of 1.25% to 1.5%.

Market Outlook

Exhibit 2: Asset Class Returns

2020

As we began 2020, markets had performed well in the previous year, spreads were tight and valuations stretched. But, the Federal Reserve had cut rates to accommodative levels, and it looked like it would be an okay year for risk assets. Our 2020 recommendation was that with limited upside left in the market, the focus should be on moving up in quality across our portfolios.

As the number of known Covid-19 cases began to rise in late February, investors began to panic and across the country companies were putting together work from home plans for all employees. By mid-March, our office buildings were empty, and most sadly the death toll began to rise so quickly that in a panic we effectively locked down the entire country. Highways and grocery store shelves were empty (How could the store be out of toilet paper?), restaurants closed, and the capital markets were in free fall. On March 16, the Federal Reserve cut the Funds rate to zero and promised to do whatever it takes to keep liquidity in the system. On March 23, Congress passed a $2 trillion aid package, known as the CARES Act. These efforts were designed to keep businesses open and provide individuals with enough money to weather the storm of rising unemployment and shuttered businesses.

These efforts gave confidence to the markets. Accordingly, the low in the stock market occurred on March 23rd and quickly rose to finish the year up 18% (Bloomberg). We had unanswered questions about when these lockdowns could end, but it was clear that keeping the economy going was a clear priority. 

The government was also working to address the health crisis at hand. It partnered with a number of pharmaceutical companies to prefund vaccine purchases and help cover the cost of research and manufacturing dubbed “Operation Warp Speed.” By mid-November, announcements were made about the success of the vaccines and the markets were off to the races, reaching record highs.

2021

Just like last year, we begin this year with a very accommodative Fed, strong markets and tight credit spreads. There is uncertainty related to when we might get back to work and how many office buildings or stores or hotels we’ll need after this is all over. The markets seem to be once again reflecting the best-case scenario with little upside from spread tightening and some downside should the vaccine rollout be less than smooth. We’ll repeat our mantra from last year. Although we have a benign credit outlook, with spreads at these tight levels we believe there is limited upside in taking an aggressive position by adding the riskiest of credits. We still see some pockets of value within the corporate market and believe the positive technicals will provide a backstop to volatility.

The continued buying by the Fed in Agency MBS has created a dislocation in that sector. Our models suggest that on an option adjusted basis, this sector’s expected return is below Treasuries. We have reduced our exposure and plan to continue to underweight this sector.

Our fixed income portfolios are built to maximize income while reducing downside risk. We consistently overweight spread sectors but we strive to be flexible in our allocations. We use long Treasuries and Taxable municipals to reduce price volatility. We have seen that since 2014 the benchmark Corporate bond sector has underperformed duration matched Treasuries three of the last seven years while agency MBS four of seven and CMBS two of seven (Bloomberg Barclays). On the other hand, the ABS sector has outperformed Treasuries every year during this period (Bloomberg Barclays). 

We use short high quality ABS to add stability and positive convexity versus Treasury and Agency MBS positions. We have reduced volatility by adding longer Taxable munis and Treasuries to our portfolios and limit call risk by underweighting the MBS sector. The ability to be nimble in corporates and construct yield enhanced portfolios with the use of taxable municipals and ABS has enabled the AAM managed portfolios to be consistent top quartile performers.

Since we expect a stable economy and strong technical factors, this should be a good year for the equity markets. However, after the significant run-up in valuations, we are working with our clients to ensure that portfolios have been rebalanced in accordance with strategic targets. 

Corporate Credit

2020 was the quintessential roller coaster year for investment grade (IG) corporate bond spreads. The Corporate market OAS using the Bloomberg Barclays Corporate Index ended the year at the virtually the same level it started after widening over 300 bps in March. 

Exhibit 3: Corporate OAS

Source: Bloomberg Barclays Index, AAM as of 12/31/2020 (OAS=Option Adjusted Spread; Std dev = standard deviation)

As companies faced a high level of uncertainty in the spring, they issued a record amount of debt to raise cash. This additional debt coupled with EBITDA pressure resulted in debt leverage spiking, and close to 30 issuers or 3% of the Corporate Index experienced rating downgrades to high yield (Barclays Corporate Index). After a year of fundamental weakness due to the virus and related lockdowns, AAM expects credit fundamentals to rebound solidly in 2021 alongside the global economy. We expect debt leverage to improve due to falling debt levels and EBITDA growth (10-15% expected). Consequently, rating actions are expected to be more favorable this year as companies execute on deleveraging plans. Capital spending growth is expected to resume to an aggregate level that is essentially unchanged versus 2019 (“pre-COVID”). Fiscal stimulus and low interest rates are expected to fuel the economic recovery expected in 2021, as herd immunity is reached, placing us in the “recovery” phase of the cycle. Companies will have engines for growth other than financial engineering in 2021, which should be constructive for the IG market. 

In addition to a favorable fundamental outlook, we expect market technicals to support spreads, with gross and net debt issuance expected to be lower in 2021 vs. years past. The liquidity in the market, low yields outside the U.S. and expectation for rates to remain low in the U.S. are supportive for IG Corporate bond demand.

Exhibit 4: Composition of Gross Investment Grade Debt Supply

Source: AAM, Morgan Stanley, Dealogic, Bloomberg

Unfortunately, spreads are very tight, and while our OAS target for year-end is 95bps, our Bull case is for the OAS to move to the 10-year minimum level of 85 reached in 2018, which we deem more likely than a Bear case in which it widens to 140 (10-year average). We expect spread curves to flatten and the premium in spread for BBB rated issuers to compress further versus higher rated issuers. Risks to our forecast includes: (1) issuers’ unwillingness to reduce debt, using liquidity for more shareholder friendly activity, (2) pace of vaccination rollout materially underwhelms expectations (3) Fed changes its accommodative stance and (4) the Biden Administration’s policy objectives threaten near term growth expectations. 

2021 is likely a year in which performance is driven by how much risk is in the portfolio versus being driven by idiosyncratic risk. That said, when the cycle moves into its next phase, it will be important to have protected the portfolio from issuers with negative fundamental outlooks because that risk will start to materialize. To help with that process, the following was compiled by our experienced analyst team, recognizing that opportunities exist in all sectors and strong credit research is an important part of that process.

Exhibit 5

Structured Products

Structured products experienced mixed returns in 2020 as both CMBS and ABS outperformed their Treasury benchmarks by 51bp and 106bp respectively while agency RMBS underperformed Treasuries by 17bp (Bloomberg index returns). We’d consider that performance pretty pedestrian based upon historical averages however when accounting for the sharp downturn in risk assets earlier in the year due to the growing pandemic, we believe the overall performance was actually quite good. Looking to 2021, we start the year with spreads that are at or below levels where we began 2020 and quite low on a historical basis as well. This certainly limits the extent to which structured products can outperform Treasuries this year. Despite these tight levels however, we do expect some incremental spread compression in both ABS and CMBS generating reasonable excess returns but once again expect agency RMBS excess returns to disappoint.

It was quite a roller coaster ride for agency RMBS in 2020. We began the year expecting a flood of mortgage issuance as the Federal Reserve unwound their latest quantitative easing program only to have to reverse course and expand their balance sheet once again. Initial expectations were for the Fed to shrink their RMBS holdings by $220B in 2020 but instead they were increased by over $850B (BankAmerica for the 850B, JPM), a multiple of the net new issuance for the market for the entire year. This steady and consistent buying drove down mortgage rates, causing homeowners to rush to prepay their loans, eroding the entire incremental yield of the RMBS securities over and above Treasuries. Although rates have risen a bit in January, roughly 60-70% of all outstanding mortgage loans carry interest rates that are higher than current borrowing rates (Case Shiller, BofA, Citi, JPM). We expect prepayments to remain elevated over the course of 2021, reducing expected return for RMBS securities below that of Treasuries. 

Non-Agency RMBS looks much more compelling to us as we believe the higher yields offered by non-government guaranteed securities more than offsets the risk of higher prepayments afflicting agency guaranteed securities. Credit risk seems quite manageable as one surprising consequence of the pandemic has been an increase in demand for larger suburban housing, the type backing many non-agency securitizations. Homeowners looking to escape urban settings and the need to create home office space have driven the demand for housing well above supply in many parts of the country. Home prices nationwide rose by nearly 6% in 2020 and are expected to increase another 3-4% in 2021 (JPM, BofA). Continued fiscal support from Congress in the form of additional stimulus payments, supplemental unemployment insurance and a recovering employment market along with home price appreciation should contribute to solid credit fundamentals for non-agency securitizations over the coming year.

There remain many questions concerning the long-term impact of the coronavirus on commercial property markets. In particular the acceleration of online shopping replacing brick and mortar retail outlets and the need for expensive downtown office properties as employers embrace more work from home strategies. The pressure brought by these fundamental changes to key parts of the commercial property market are going to place significant downward pressure on valuations and operating metrics for marginal B and C properties in a wide variety of subsectors. Well placed, Class A properties, we believe will continue to thrive however. The old adage about location, location, location holds today more so than ever. We believe that by carefully stress testing properties underlying securitizations, we can identify those securities that will exhibit the best overall credit performance. We believe Senior, Aaa rated bonds remain the best value as high levels of credit enhancement should provide ample protection against the volatility in credit fundamentals we expect in the coming year. While we expect spreads to compress to Treasuries, it will be somewhat dependent on the performance of single A corporate bonds. CMBS tracks corporate bonds spreads closely and without a similar tightening in corporate spreads, CMBS will likely have difficulty following through on their own. 

Exhibit 6: CPPI Growth is Decelerating

Source: Real Capital Analytics, Bloomberg

ABS have always been one of the most consistent performers within the structured products universe. They provide high credit quality and stable cash flows making them a staple in our portfolios for shorter maturity needs in lieu of Treasuries. While we expect ABS to outperform other asset classes at the short end of the yield curve, valuations are strained for the larger, more generic sectors of the market. Spreads to Treasuries are as low as 10-15bp for large auto and credit card issuers making them fairly unappealing compared to Agency CMBS and Taxable Municipals. The demand for very short-term assets based on market expectations for higher yields and a steeper yield curve have driven short term spreads to extremely low levels. We do see value in more esoteric sectors, such as railcar, container and equipment securitizations, where spreads north of 100bp have the ability to generate returns well in excess of Treasuries particularly those yielding only 15-20bp.

Municipal Market

After a tumultuous year in which the pandemic-induced recession generated record low interest rates, massive volatility in relative valuations for the taxable and tax-exempt municipal sectors and a record surge in municipal new issue supply, our outlook for the municipal sector in 2021 is very similar to our outlook going into 2020. For tax-exempt municipals, we are maintaining a negative bias for the sector based in large part on the very expensive relative valuation profile of the sector versus taxable alternatives. Based on data from Thomson Municipal Market Data, ‘AAA’ rated municipal nominal yield levels as a percentage of Treasury yields during January fell to a 29-year low of 68%. 

The overvalued condition for tax-exempts has primarily been driven by positive technical and credit factors over the last few months. From a technical perspective, tax-exempt new issue supply during the year has largely been manageable. In a year in which the Bond Buyer reported overall municipal supply reached a new record of $474 billion, 2020 tax-exempt supply actually saw a decline of 4% from 2019 levels to $319 billion. The demand profile, however, has been building in momentum since the implementation of fiscal stimulus that helped the sector weather the largest liquidity and economic concerns related to the pandemic. Although questions remain as to the extent that state and local governments will see additional stimulus, the general election and senate run-off races that produced Democratic control across both houses of congress and the White House has provided a more constructive view of municipal credit. The Biden/Harris administration has already targeted $350 billion in direct aid to state and local governments within a new $1.9 trillion stimulus package. If the measure passes, this aid should help address revenue shortfalls at the state level that Standard and Poor’s estimates will reach a cumulative total of $467 billion over the fiscal years 2020 to 2022. The potential for these positive credit developments, combined with the very favorable year-end reinvestment flows of coupons/calls/maturities, has produced one of the most relatively expensive environments for the tax-exempt market on record. Consequently, we are maintaining a negative bias for the sector and advocating a significant underweight position. 

The taxable municipal market has also exhibited a similar build in performance momentum over the last few months. The same themes outlined in the tax-exempt space from a credit perspective benefitted the taxable sector; however, one area of significant difference is in the new issue supply performance. The Bond Buyer reported record taxable muni issuance of $185 billion, which incorporated $145 billion of municipal cusips and an additional $40 billion issued under corporate cusips by municipalities. Most of this issuance was tied to refinancing supply executed as advance refundings, which came in at ~$140 billion. The majority of this issuance was shoved into the market during the six-month period from May to October to avoid any potential market dislocations related to the presidential election in November. Post-election, new issuance has been muted, while demand has been incredibly strong across both retail and institutional investors. Consequently, in looking at data compiled by AAM, ‘AAA’ taxable muni spread levels during 2020 have compressed by 10 to 21 basis points (bps) across the yield curve, with the 10yr area providing the strongest performance. Going into 2021, these spreads represent the tightest relationship to Treasuries in the last 15 years. However, when comparing the sector’s yields to other spread sectors like corporates, spread levels remain modestly attractive relative to historical average relationships to ‘A’ rated industrial corporate bonds. Although we believe the taxable muni sector exhibits very limited potential toward further tightening in spread levels, we view the taxable municipal sector as fairly valued. 

In looking forward to supply technicals during 2021, coming into the year, broker/dealer expectations for new issue supply ranged from $470 to $525 billion, with taxable supply incorporating ~$175 billion of this amount (Barclays, Citigroup, JP Morgan, Bank of America). Of the taxable issuance, $125 billion were expected to be refinancings executed as advance refundings (Barclays, Citigroup, JP Morgan, Bank of America). However, most of these estimates were derived before the Georgia senate run-off elections that resulted in Democrats taking majority control of the chamber. Under this new development, there could be substantial changes in the makeup of issuance during the year between the tax-exempt and taxable markets, especially as it relates to any potential Biden/Harris administration initiatives tied to infrastructure and tax reform. 

Under tax reform, the market expects that tax-exempt advance refundings, which were abolished under the Tax Cut and Jobs Act of 2017 (TCJA), will likely be reinstated to the tax-exempt sector. The market also expects that an infrastructure plan will be introduced that will be funded in part within the taxable muni market through the use of direct-pay bonds. This approach would emulate the Build America Bond program that was utilized during the Obama/Biden administration in 2009 and 2010 to fund capital spending. If tax reform and infrastructure are addressed later in the year, we would expect that supply expectations going into 2021 would remain in place. However, if these measures are addressed early this year, the risk is that we could see much higher issuance levels this year, with tax-exempt issuance surprising to the upside. Taxable muni supply would not be expected to change dramatically, as any reduction in advance refunding issuance is expected to be supplanted by direct-pay issuance from infrastructure-related supply. 

Exhibit 7: Tax-Exempt Relative Valuation Levels Remain Unattractive for Insurers

Source: Thomson Reuters Municipal Market Data, Bloomberg

Exhibit 8: Taxable Munis: Compelling Alternative to Tax-Exempts

Source: Thomson Reuters Municipal Market Data, Bloomberg, AAM

High Yield

Exhibit 9: US Below Investment Grade Valuations

Source: Bloomberg and Credit Suisse Leverage Loan Index (CSLLI). Data as of December 31, 2020. ICE BofA ML US Cash Pay High Yield Constrained Index (JUC4)

After a challenging start in the first quarter of last year, US High Yield ended 2020 with strong positive returns as the sector benefited from swift Fed and Monetary policy response to the pandemic, as well as investor demand for higher income alternatives. At the height of the market dislocation, broad market credit spreads widened to a peak +1082 in late March, but then subsequently tightened almost 700 basis points to end the year at +390 as liquidity and sentiment improved (ICE BofA High Yield Index H0A0 Spread to Worst). Total returns were 6.21% for US High Yield, with the higher quality BB-B rated segment performing slightly better at 6.32%, while the lowest quality CCC and lower rated issuers fared the worst at only 2.78% (ICE BofA US Cash Pay High Yield Index J0A0, ICE BofA BB-B US Cash Pay High Yield Constrained Index, ICE BofA CCC & Lower US Cash Pay High Yield Index). Syndicated Loan returns were 2.78% which lagged High Yield given their shorter duration, floating rate profile which fell out of favor as the Fed took short term rates to zero (Credit Suisse Leveraged Loan Index).

Leverage for high yield issuers moved higher during 2020 and finish the year at 5x Debt/EBITDA which compares with pre-COVID multiples near 4x (Muzinich & Co.). Liquidity improved significantly, however, as corporations rushed to raise cash in the new issue market as a precaution for a prolonged downturn. Cash to debt levels improved to almost 20% by year end which is almost double the same measure pre-COVID (Muzinich & Co.). Given the weakness experienced early in the year, the annualized default rate rose to 6.5% (Muzinich & Co.) but appears to have stabilized as there were no defaults in November and only one to report in December. In addition, credit rating upgrades now outnumber downgrades by a ratio of 1.2:1 as further evidence of improving fundamentals (Muzinich & Co.). Assuming the recovery from COVID continues, the default rate is expected to drop precipitously to an annualized rate of 2-3% by year end 2021 (Muzinich & Co.). 

We expect technicals to be favorable in the coming year as demand for higher yielding instruments should persist while new issue supply is expected to be lower than 2020. While valuations appear tight with credit spreads recently falling below the long-term averages, spreads remain 50 basis points wide of the most recent lows in 2018. Opportunities in the market still exist, but we believe it’s critical to evaluate the appropriate levels of risk and reward in portfolios with an actively managed approach and disciplined underwriting process to avoid defaults. 

Income has consistently been the largest component of total return for High Yield over time as the additional carry helps to offset any short term price moves. As prices have improved materially, we expect coupon to be the largest driver of returns in 2021. Given a backdrop of improving fundaments and lower defaults, we expect High Yield bonds to provide returns in the range of 4-5%. Loans have the potential for higher returns of 5-7% as the average price of Loans remains at a discount and a pull to par in prices could supplement the income return. Loans could also benefit from a recent resurgence in CLO issuance which has accounted for as much as 50% of the investor base in recent years (Muzinich & Co.). Additionally, there has been increased demand from investors seeking floating rate coupons as a hedge against the prospects of higher interest rates. Finally, as you can see in Figure 3, both US High Yield and Loans continue to offer attractive yields that can enhance the income of broad market investment grade strategies. 

Exhibit 10: Fixed Income Yields per Corporate credit and Treasuries sub-segments

Source: Muzinich, Credit Suisse Leveraged Loans Index USD, Western European Lever aged Loans Index non-USD denominated, ICE BAML indices, H0A0, HEC0,EMNF, CF0X, CF00, EN00, EF00, G402, G102, EG14, EG11, as of December 15th, 2020

Convertible Securities

The asymmetric risk/return proposition offered by balanced convertibles demonstrated its worth in 2020 as Covid-19 related volatility shook financial markets. With equities tumbling 35-40% into late March, balanced convertibles experienced less than half of the decline, this including market illiquidity and gapping credit spreads that led to Fed intervention. Capital preservation at the March lows provided a strong investment base for the confluence of events that followed: 1) consistent and heavy new issuance, 2) a dramatic rally across equity markets, and 3) collapsing credit spreads. These factors helped to produce the strongest run for convertible investors in decades with Barclays Index data pegging the broad convertible market return at +89% from March 23rd through year-end (Barclays Capital convertible research)

Exhibit 11: U.S. Equities and Convertibles – Cumulative 2020 Total Return

Source: Bloomberg Barclays Index Data, Bloomberg L.P.

While volatility may have been the biggest story of 2020, new issue supply in U.S. convertible markets is noteworthy for the likely sustained impact it will have on the sector’s ability to deliver compelling absolute and risk-adjusted returns into the future. For the full year, 194 deals priced in the U.S. market with proceeds of nearly $115 billion (Barclays Capital convertible research) – higher than 2018 and 2019 combined. Sustained deal flow and market gains, as indicated in Exhibit 2 below, contributed to a convertible market that has increased in size by approximately 50%. While technology and healthcare sector issuers continue to lead in deal volumes, the market also provided access to capital for issuers across a wide variety of market sectors looking to raise funds or build liquidity to endure Covid-related uncertainty. Breadth of issuance and an expanded balanced opportunity set affords investors the ability to diversify risks across industries, an important factor given how far technology shares have come in recent quarters. 

Exhibit 12: U.S. Convertible Market Size and Structure ($Min)

Source: BofA Global Research, ICE Data Indices, LLC

Broad measures of credit health within the convertible market are stable and improving, which is likely to provide stability to balanced sector convertibles should equity markets surprise to the downside. New deal flow is expected to continue at above average levels, yielding another year of organic growth in market size. Critically important in this market, we observe a high level of concentration risk and equity sensitivity in the market which can expose high delta investors and passive index ETF shares to significantly greater levels of volatility relative to actively managed balanced strategies. Our partners at Zazove Associates have been actively rebalancing portfolios through this rally with current portfolios well positioned with proper diversification and equity risk control.

AAM’s outlook for strong economic growth and favorable monetary and fiscal policy in 2021 bodes well for convertible returns in absolute and relative terms. Should our forecast prove accurate, corporate earnings growth will likely yield a favorable environment for equity investors, particularly in cyclically sensitive and financial segments and small/mid cap issuers. While it is difficult to imagine a repeat performance of 2020, we believe mid-to-high single digit returns in equities are achievable. In such an environment, balanced convertible models indicate returns which capture the majority of stock market gains. 

January 27, 2021 by

This paper was originally published in the latest issue of Inside Medical Liability Magazine and is republished with credit to and with the consent of Medical Professional Liability Association (MPL).  AAM is a proud Advantage Level Affiliate Partner of the MPL Association.

Before the COVID-19 pandemic, medical professional liability (MPL) insurers faced rising payouts because of increasing jury awards and falling premium volumes due to a consolidating customer base. The pandemic created fresh concerns and uncertainty for MPL insurers with the potential for increased future claims due to COVID-related issues as well as the thousands, if not millions, of elective healthcare procedures put on hold. 

Today, these concerns, along with the potential for increased earnings volatility, mean that MPL insurers must closely monitor and manage surplus volatility arising from their investment portfolio.

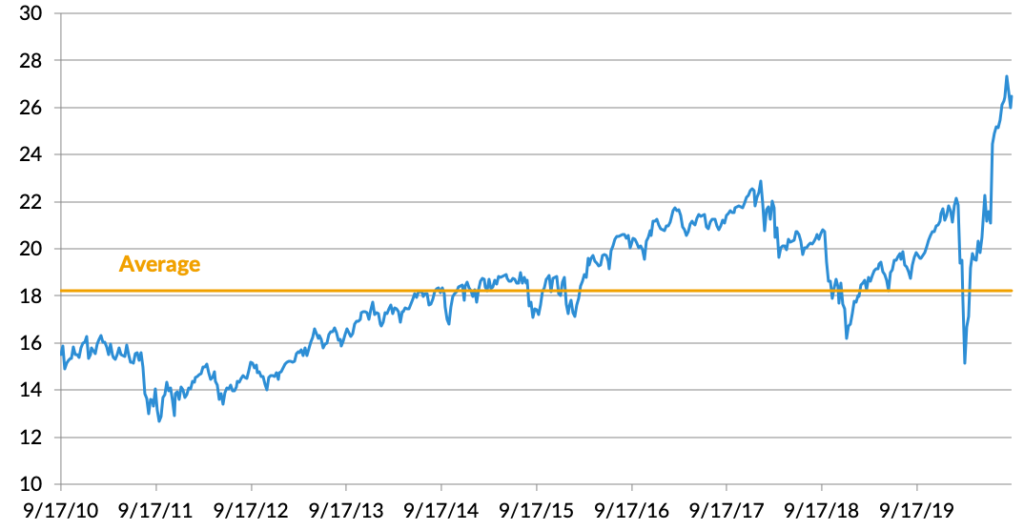
Rising MPL payouts stem, in part, from a phenomenon known as “social inflation,” which refers to a cluster of factors resulting from increased litigation, plaintiff-friendly legal decisions, and larger jury awards. Due to social inflation, MPL loss ratios for the first three quarters of 2019 reached their highest level since 2005.1 To hedge against social inflation, MPL insurers have historically held a portion of their investment portfolios in equities. According to S&P Global Market Intelligence, MPL insurers, on average, held 17.5% of their total cash and invested assets (33.5% of surplus) in equity securities as of year end 2019.2 As of early October 2020, equity markets were trading near all-time highs at the same time that equity valuations appeared stretched from a price/earnings perspective. Consequently, insurers with exposure to equities should consider the potential impact that increased equity volatility and potential for market corrections may have on their earnings and surplus. Figure 1 illustrates that, as of Sept. 15, 2020, the P/E ratio of the S&P 500 was 46% above its 10-year average.

Figure 1: S&P 500 Price/Earnings Ratio

Source: Bloomberg

Within the fixed-income markets, investment yields are low and likely to remain that way for an extended period of time. The Federal Reserve seems poised to keep rates near zero well through 2023.3 The average yield for an investment-grade corporate bond with a five-to-10-year maturity is currently only 1.8%.4 Equity market volatility may very well increase as we head into the later parts of this year due to the COVID-19 pandemic and the results of the U.S. elections. An investment strategy that provides equity market exposure with a focus on downside protection may offer solutions for insurers seeking additional yield and capital appreciation.

The ABCs of convertible bonds and markets

Convertible bonds are corporate bonds that pay interest and offer the potential to convert to shares of the company’s stock. While convertible bonds typically pay more in interest than corporate dividends, they usually provide a lower yield than a traditional corporate bond. The conversion feature of a corporate bond creates more potential for capital appreciation than traditional bonds. Convertible securities come in a myriad of structures but in their simplest and most common form can be converted into common stock at the option of the holder. This feature offers the upside potential of equities along with the yield and safety attributes of corporate bonds.

The convertible securities market is an often-overlooked niche of the investment world. At approximately $330 billion in size domestically, the market is often too small to attract large institutions yet too specialized and complex for smaller investors.5 Those characteristics offer attractive opportunities for investors with the focus and expertise to exploit inefficiencies inherent in this market.

These securities trade in dealer markets like traditional corporate bonds and the convertible price will reflect the value of the embedded- equity option as well as fixed-income attributes, which include credit, duration, and other attributes. Therefore, convertibles can trade at prices well below par as well as at multiples of par and their sensitivity to stock prices can vary dramatically. Active management is an important part of mitigating these risks in order to optimize a portfolio in the investor’s favor.

Benefits of convertible bonds

Convertible bonds provide investors exposure to equity markets while simultaneously reducing downside participation and risk. For MPL insurers, convertible bonds have additional benefits when considering statutory accounting principles and regulatory capital requirements. Since convertibles are treated as bonds and carried on Schedule D Part I, a significant portion of equity-market volatility is muted and has no impact on statutory capital.

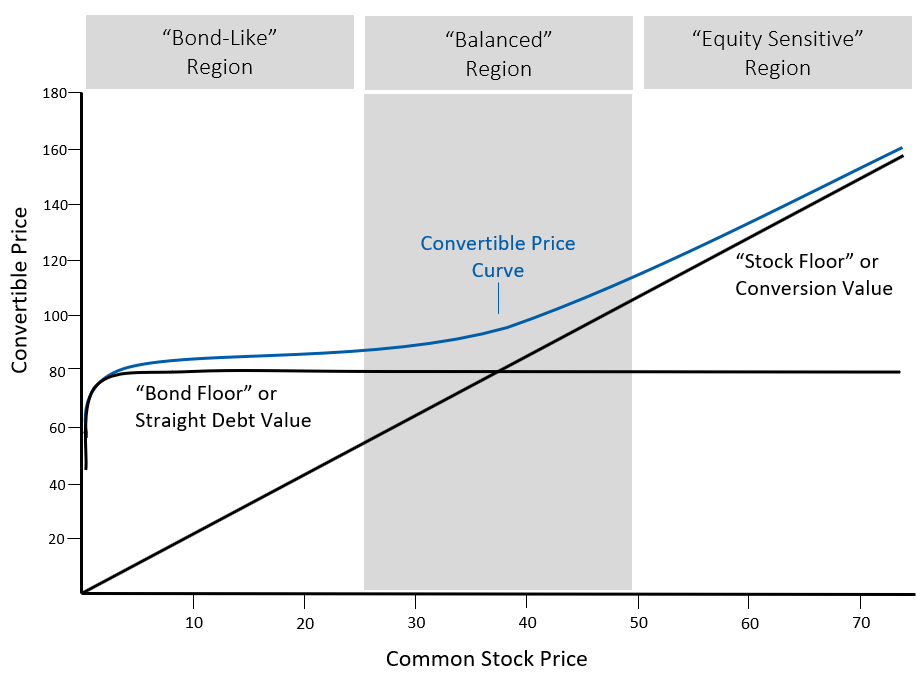
In the course of a market cycle, exposure to equity markets through a balanced convertible strategy is positioned to outperform fixed income and produce capital gains while the interim price volatility is muted by the bond-like statutory treatment. Further, required capital within regulatory and rating agency capital models is substantially lower for convertibles when compared to equities. As illustrated in Figure 2, balanced convertibles can provide investors with equity upside participation along with downside protection.

Figure 2: The Convertible Price Curve

Strategies for managing convertible bonds

A goal of a convertibles strategy should be to achieve long-term returns similar to equities with substantially lower risk. Firms specializing in the management of convertibles achieve this by constructing high-quality, diversified portfolios of convertible securities with favorable risk/return characteristics. These portfolios will typically capture most- 65-75%- of significant upward movements in the stock market while participating in less than half of market declines. Through a typical stock market cycle this can result in favorable outcomes, including:

  • Securing most of the market’s upside
  • Limiting downside risk
  • Capturing higher yields

This strategy is attractive to investors because it can offer a low-risk alternative to equities and a high-return diversification component to an overall fixed-income strategy.

Current market opportunities

The COVID-19 crisis has set the stage for a dramatic surge in convertible issuance. Since March 31, more than 130 companies have issued approximately $76 billion in convertibles.6 In comparison, there was a total of $60 billion in issuance for all of 2019, a 10-year high.7

A very diversified mix of companies have tapped the convertible market as a means to manage the economic implications of COVID-19. Many of these convertibles offer very attractive terms to investors.

The growth and improvement in the size, diversity, quality, and valuation of the convertible universe provides a unique opportunity for investors to consider an asset class they may have previously over-looked.

We believe the opportunity set and trading environment for convertibles is as strong as it has been in years. As MPL insurers face uncertainties from both an operating and capital markets perspective, companies should examine the risk/reward profile of convertibles as an attractive use of their risk budget. A balanced convertible strategy can benefit MPL insurers from reduced potential volatility of capital and improved regulatory capital requirements relative to equity investments.

References

  1. Tim Zawacki,“Signs of social inflation evident in highest-in-14-years med mal loss ratio” S&P Global Market Intelligence, Dec. 3, 2019: https://www.spglobal.com/market intelligence/en/news-insights/trending/k1_2svgbjbmiliptqnvxsq
  2. Based on Dec. 31, 2019, data of 108 P&C insurers writing at least 50% MPL business in 2019.
  3. Jeff Cox,“Fed sees interest rates staying near zero through 2022, GDP bouncing to 5% next year,” CNBC, June 10, 2020: https://www.cnbc.com/2020/06/10/fed-meeting- decision-interest-rates.html.
  4. Bloomberg Barclays Corporate Bond index: https://www.bloomberg.com/markets/ rates-bonds/bloomberg-barclays-indices. Accessed Sept. 24 2020.
  5. Barclays Capital,“Convertible Market Summary Statistics”: https://indices.barclays/ IM/12/en/indices/welcome.app.
  6. Ibid.
  7. Ibid.

February 12, 2020 by

Overview

Environmental, social, and governance (ESG) advancement has been a prominent topic from energy management teams over the past six months. This is particularly true as it relates to environmental concerns. Politicians, scientists, and investors are shaping the future of the energy industry through increased regulation, cleaner innovation, and more expensive financing – all of which are determining capital allocation decisions by management teams in the energy industry. Recognizing this, AAM is highlighting its environmental risk analysis for energy companies. Below we identify why environmental concerns – particularly greenhouse gases (GHG) – now have the interest of energy companies and provide a framework for how we incorporate GHG emissions in our evaluation of issuers. We also provide a brief background on the key contributors to GHGs.

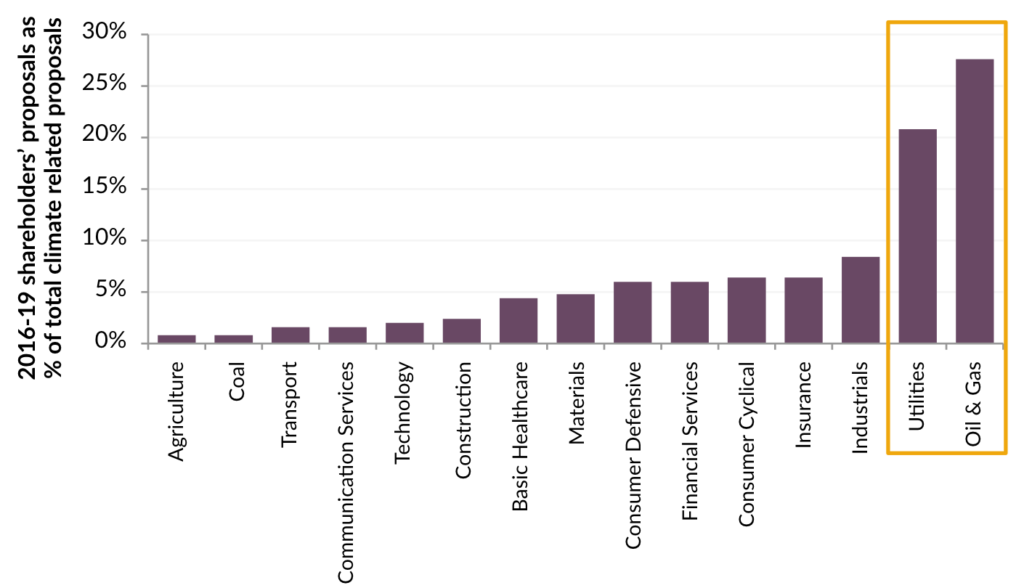
Presently, ESG efforts are affecting companies in the energy sector primarily via shareholder proposals. According to ProxyInsight and Goldman Sachs, the number of climate-related shareholder proposals has almost doubled since 2011, and the percentage of investors voting in favor has tripled over the same time period. Critically, investor pressure has been concentrated on the energy sector. Exhibit 1 shows 50% of all shareholder proposals target the energy producers (oil & gas, utilities, coal). These proposals include items such as linking executive pay to GHG emission reduction goals (Royal Dutch Shell, 2018).

Additionally, we believe conventional asset managers are increasingly under pressure to adhere to sustainable investing, which will put pressure on energy companies to improve their ways or risk losing large shareholders. We believe some of the largest asset managers will be inclined to vote against management and board directors when companies are not making sufficient progress on carbon emission disclosures.

Exhibit 1: Split of climate-related shareholder proposals, 2016-2019 average, by industry

Source: ProxyInsight, Goldman Sachs Global Investment Research

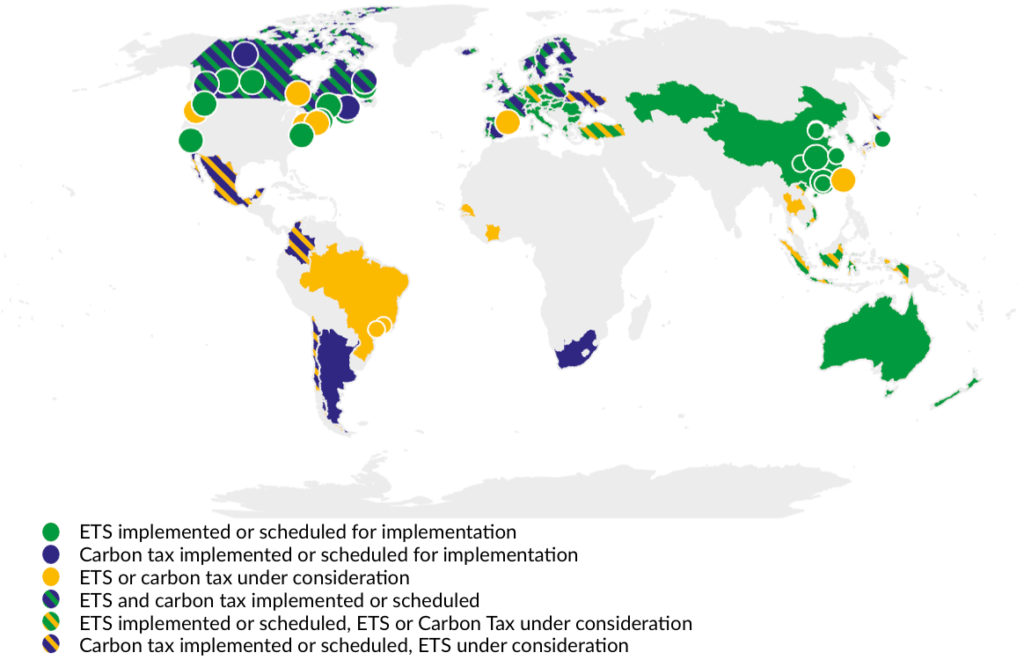
We are also mindful that environmental concerns could negatively affect cash flow in the intermediate term. According to the World Bank, carbon prices have already been implemented in 40 countries (see Exhibit 2 below). Provided that several candidates running for the U.S. Presidency are open to a carbon tax or carbon pricing via an electronic trading system (ETS), we believe that at some point in the intermediate term, energy companies in the U.S. will be subject to carbon costs too. 

Exhibit 2: Summary map of regional, national, and subnational pricing initiatives

Source: World Bank

Energy analysis: focusing on the E in ESG

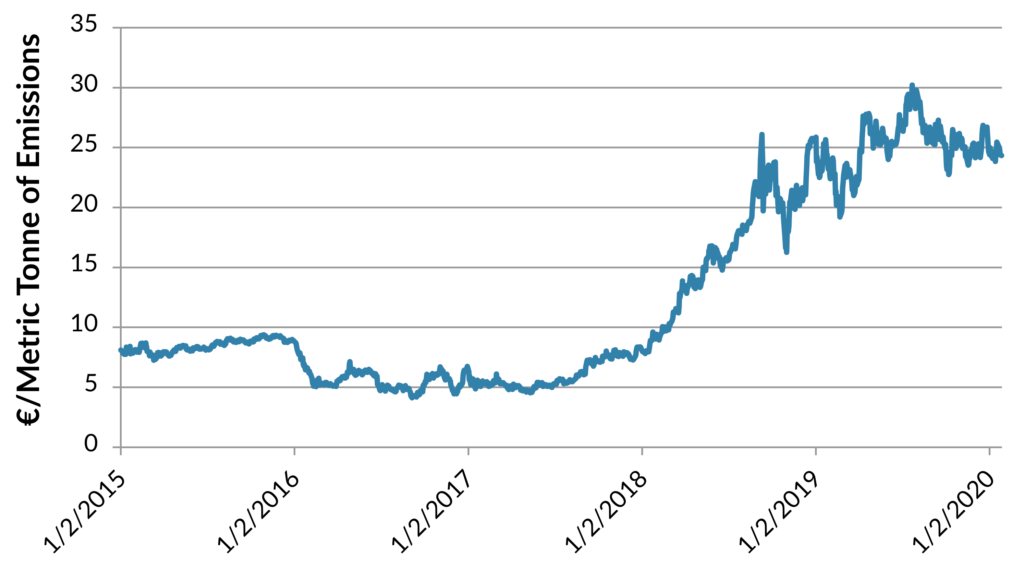
AAM has incorporated many aspects of sustainable investing for years. One item that has evolved in the past decade is the analysis of carbon emissions in the energy sector. To quantify how carbon restrictions might effect energy companies in the investment grade index, we assume a mechanism will be employed in the U.S. similar to that used in Europe where emitters can trade emission units to meet their emission targets. To comply with their emission targets at the lowest cost, entities can either implement internal reduction measures or acquire emission units in the carbon market, depending on the relative costs of these options. By creating supply and demand for emissions units, an electronic trading system establishes a market price for GHG emissions as is done presently in Europe. (Exhibit 3). We acknowledge that there is disagreement over whether such a policy will be implemented in the U.S., and, if so, how it will be implemented (trading system or explicit tax). However, we attempt to quantify the risk each issuer has to carbon costs and evaluate energy companies potential exposure to a change in U.S. legislation.

Exhibit 3: ICE EU active carbon emissions

Source: AAM and Bloomberg

GHG analysis in AAM’s risk assessment

We use two primary sources to determine GHG emissions: company sustainability reports and the U.S. Environmental Protection Agency (EPA) Greenhouse Gas Reporting Program. The integrated companies, Canadian issuers, and independent companies with international exposure generally post GHG emissions in their sustainability reports. The other primarily domestic energy companies are required to report GHG from sources that in general emit 25,000 metric tons or more of carbon dioxide equivalent per year in the United States. 

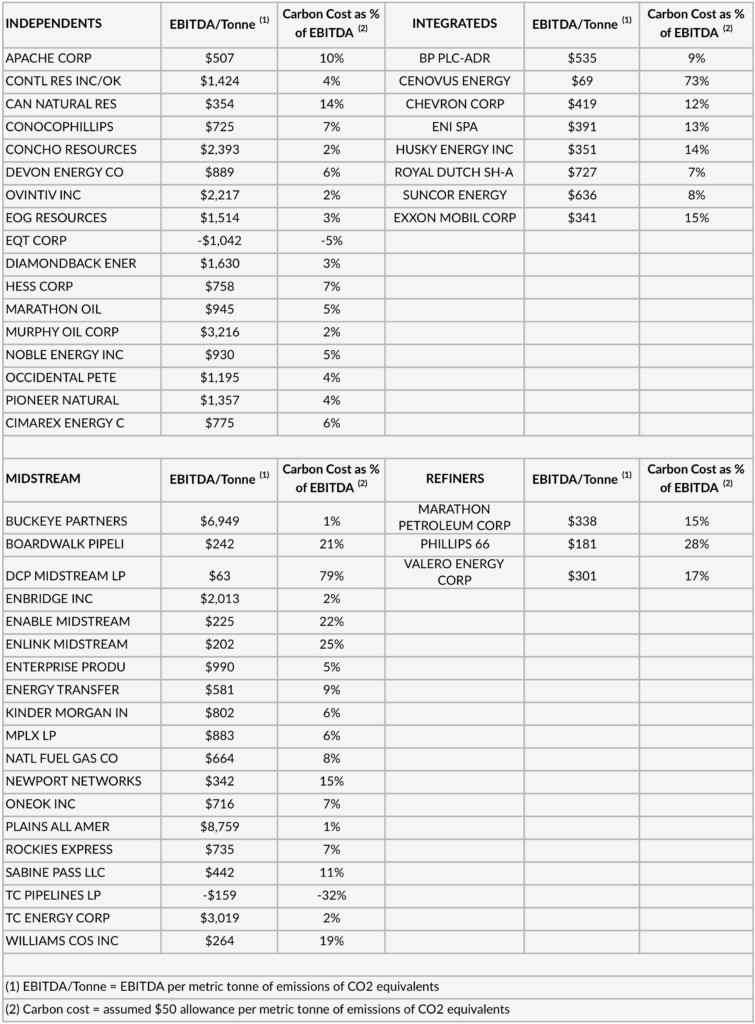
In addition to the traditional factors we already use in assessing the risk of an energy issuer, we include two environmentally-related items: a.) EBITDA per metric tonne of GHG emissions, which indicates how much cash flow the issuer generates for every tonne of emissions and b.) implied carbon costs as a % of EBITDA, which measures the percentage of cash flow a theoretical carbon tax of $50 per tonne would be. All other factors being equal, an issuer with high EBITDA per metric tonne of GHG emissions and low carbon costs as a % of EBITDA has a better internal risk rating. Exhibit 4 includes these AAM risk measures for the energy issuers included in the Bloomberg Barclays Index.

Exhibit 4: Cash flows in relation to carbon costs

Source: AAM, EPA, company reports, Bloomberg

The challenges to measuring environmental impacts

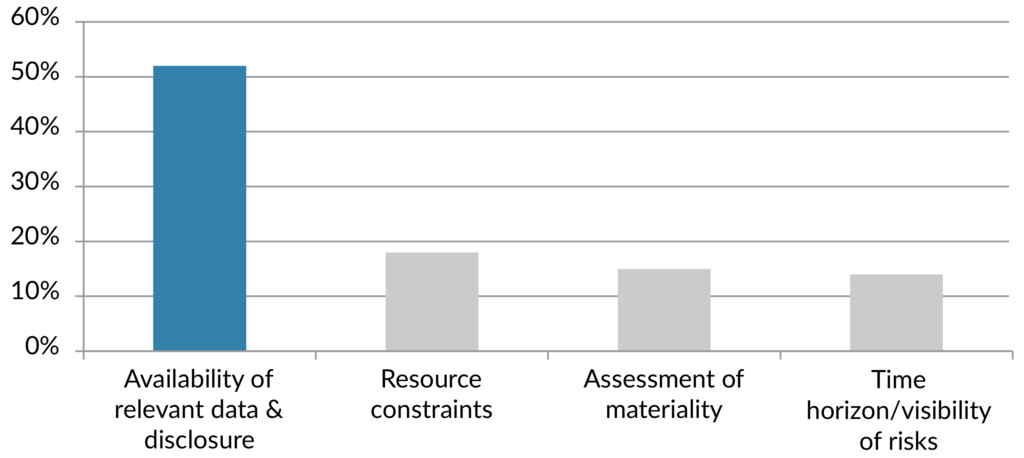
Unfortunately, we observe two challenges when evaluating the environmental impact of energy companies. First, there is no consistency on whether the issuers actually report an environmental impact statement. Moreover, if there is an impact statement there is no standard on how the information is reported or what the benchmark is. (The one item that has been standardized and is widely identified is GHG emissions, which is why we are focusing on this data rather than on other environmental impact items such as energy consumption, pipeline spills, water consumption or methane flaring ). The second challenge is that the figures included in the environmental impact statement and/or included in the EPA database are submitted by the emitter and do not require third party verification. In a recent poll taken by Moody’s, this lack of data integrity was the overwhelming challenge to integrating ESG considerations into credit risk (see Exhibit 5). 

Exhibit 5: Greatest challenge to integrating ESG considerations into credit risk

Source: Moody’s Investor Services

The key GHGs and the human activities behind them

What makes reducing GHG so difficult is that many of the activities we take for granted and are very reluctant to give up – like driving or using air conditioning – contribute to increased GHG emissions. Gases that trap heat in the atmosphere are called GHGs. The main GHGs are carbon dioxide, methane, and nitrous oxide. The international standard practice is to express GHGs in carbon dioxide equivalents. Emissions of gases other than carbon dioxide are translated into carbon dioxide equivalents using global warming potential. 

Carbon dioxide is by far the largest GHG emitted by human activities at about 82% of the total. The EPA states that the main human activity that emits carbon dioxide is the combustion of fossil fuels (coal, natural gas, and oil) for energy and transportation. Although, certain industrial processes and land-use changes also emit the gas. 

The next largest GHG is methane at about 10% of the total. However, methane is more efficient at trapping radiation than carbon dioxide. According to the EPA, the comparative impact of methane is more than 25 times greater than carbon dioxide over a 100-year period and explains why reducing methane leakage is so critical to GHG reduction. Natural gas and petroleum systems are the largest source of methane emissions in the United States. 

Nitrous oxide is the other major GHG. It is responsible for about 6% of GHG emissions from human activities. The application of nitrogen fertilizers accounts for the majority of nitrous oxide emissions in the United States.

Implications of ESG on the energy sector

GHG reduction efforts are contributing to more labor and capital devoted to non-natural resource extraction activities by the energy sector. We expect this flow of resources to accelerate in the near term, reducing the amount of capital available for traditional expenditures like exploration, acquistions, and/or development. This, combined with a lack of free cash flow and challenging macroeconomic conditions in recent years, has contributed to tight financial conditions and a relatively high cost of capital for the energy sector. We expect the supply of hydrocarbons like crude oil and natural gas to be negatively affected by increased decarbonization efforts in the intermediate term.

Additionally, the GHG reduction focus has been on the emitters who control hydrocarbon supply, as opposed to the industries or activities that consume hydrocarbons. Unless there are similar efforts to reduce fossil fuel consumption (less transportation, reduced electricity consumption, etc.), demand will continue to rise. We believe this combination of lower supply and steady demand growth to eventually eat through the excess inventory available and lead to higher crude oil and natural gas prices. 

Until that time though, we expect energy companies to face familiar challenges – volatile commodity prices, displeased shareholders and, expensive access to capital. Adhering to comparatively high environmental demands along with these other items justifies the sector trading at a discount to similar rated non-energy industrials. 

December 12, 2019 by

National Lampoon’s holiday sales summary

The holiday season continues to be a critical time of the year for retailers as some can earn up to 40% of their annual revenues during this period. Based on adjusted figures from the U.S. Census Bureau, retail sales (excluding auto and gas) for holiday 2018 were up 2.3%. This was the lowest growth rate since the 2008/2009 recession. In 2008, holiday sales were down 4.1% while 2009 improved to positive 0.1%.

The holiday disappointment in 2018 was caused by the government shutdown and significant stock market weakness related to volatility surrounding trade/tariff headlines. Our prediction of around 4% for 2019 is significantly better. The following report explores some of the key components of our analysis.

The consumer is stronger than the abominable snowman

We believe the most important driver of retail sales directly ties to consumer confidence. The table in Exhibit 1 summarizes our analysis of nine factors that contribute to that level of confidence measured year over year.

Exhibit 1

Source: Bloomberg, AAM

In 2018 statistics were good, and this year’s look slightly better. Based on the year-over-year analysis, it appears that several of these factors are close to peak levels. Even though we have not seen substantial improvement versus last year, we still consider the numbers to reflect a very healthy consumer. This part of the analysis should help support a strong holiday spending season.

Professor Hinkle is back in school – but is he on the nice list?

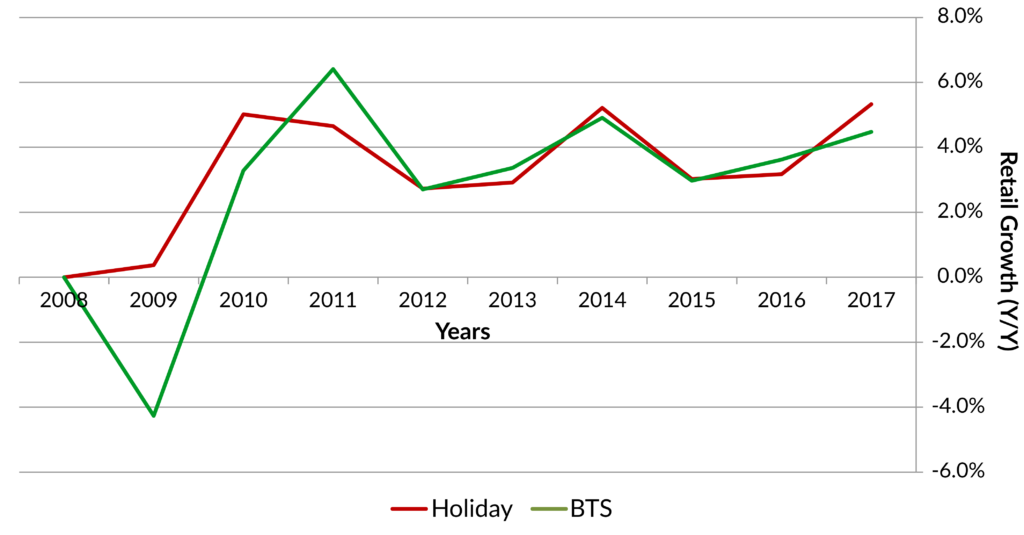
A review of data from the last twenty years (see Exhibit 2) reveals a significant correlation (77%) between “Back to School” retail sales (as measured in August and September) and holiday sales (as measured in November and December.) To model the trend, we use the U.S. Census Bureau’s adjusted monthly retail trade data which includes a variety of retail businesses (excluding motor vehicle and parts dealers and gasoline stations; sales in those segments have been more heavily impacted by factors outside the control of consumers).

Exhibit 2

Source: U.S. Census Bureau

Our regression model predicts adjusted holiday sales of 4.3% when using the 4.6% actual for “Back to School” sales in 2019. This is above the 20 year average of 3.7%. Comparatively, 2018 “Back to School” sales of 4.1% led to actual holiday sales of 2.3%. Clearly the model did not accurately predict holiday sales last year. However, it should be noted that most of the weakness last year came in December when the markets experienced heightened volatility related to the talk of trade wars, the government shutdown, and a severe equity market selloff.

Santa needs more elves for his workshop

Overall, holiday related hiring is projected to be mixed this year. In many cases a lower rate of hiring in brick and mortar is offset by a greater need for employees to support e-commerce sales. It’s difficult to draw major conclusions from these numbers given the struggle to hire part time workers due to current low unemployment and efforts to pay existing employees a higher wage. Some retailers, including Walmart, will give current employees the opportunity to work holidays instead of hiring seasonal workers.

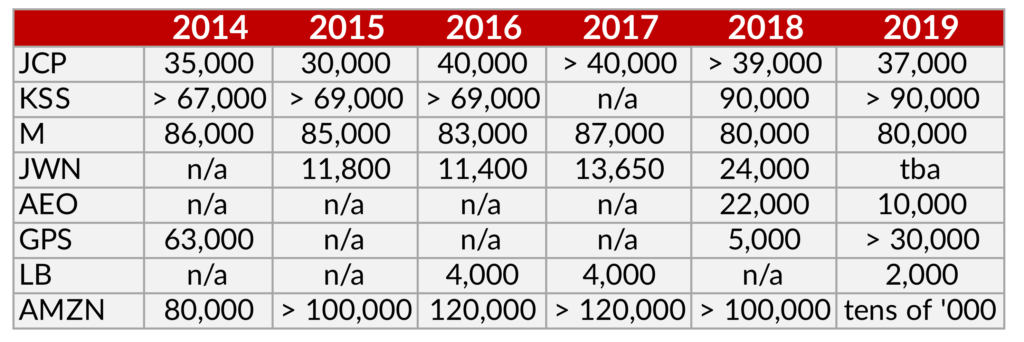
According to the National Retail Federation (NRF), temporary hiring will range between 530,000-590,000 which is comparable to last year’s 554,000. As shown in Exhibit 3, Kohl’s is the only retailer who plans to add more seasonal jobs this holiday season.

Exhibit 3

Source: Company press releases, Morgan Stanley Research

Deck the halls with tariffs for all

The second wave of tariffs is expected to begin on December 15th. This is in addition to new tariffs that began on September 1st , which included traditional holiday items such as TVs and apparel. We would expect the direct impact on consumer spending to be limited as we believe price increases during the holiday will be very limited. Nonetheless, 79% of consumers surveyed for NRF in September were concerned that tariffs will cause prices to rise, potentially affecting their approach to shopping. Shoppers expect a good deal and know when and where to make the best value purchase. For the most part, this is expected to be a “company” problem not a “consumer” problem. That could change in 2020 if tariffs remain in place and/or become more onerous.

There could be a secondary impact on spending from ongoing trade talks and tariffs. Large retailers have been diversifying their supply chains. It’s possible we will see disruption on that front which could cause less product to make it to the shelves, diminishing demand. In addition, negative headlines related to trade could create market volatility, leading to uncertainty and lower holiday spending.

Kris Kringle or Cyber Santa?

Online sales continue to grow at a double digit rate, which help retailers maintain overall business as foot traffic to brick and mortar locations continues to decline. Another positive is that weather has become less of a factor for retail results as online sales become easier and more popular across demographics. According to the U.S. Census Bureau, e-commerce now accounts for 12.5% of total retail sales year-to-date. We believe that figure is above 20% if one excludes segments that are not currently at significant risk of an internet presence such as auto sales, restaurant/bar sales, and gas station sales. Through October growth for the online category was 12.7%. That’s almost four times the 3.2% growth of total retail sales year-to-date.

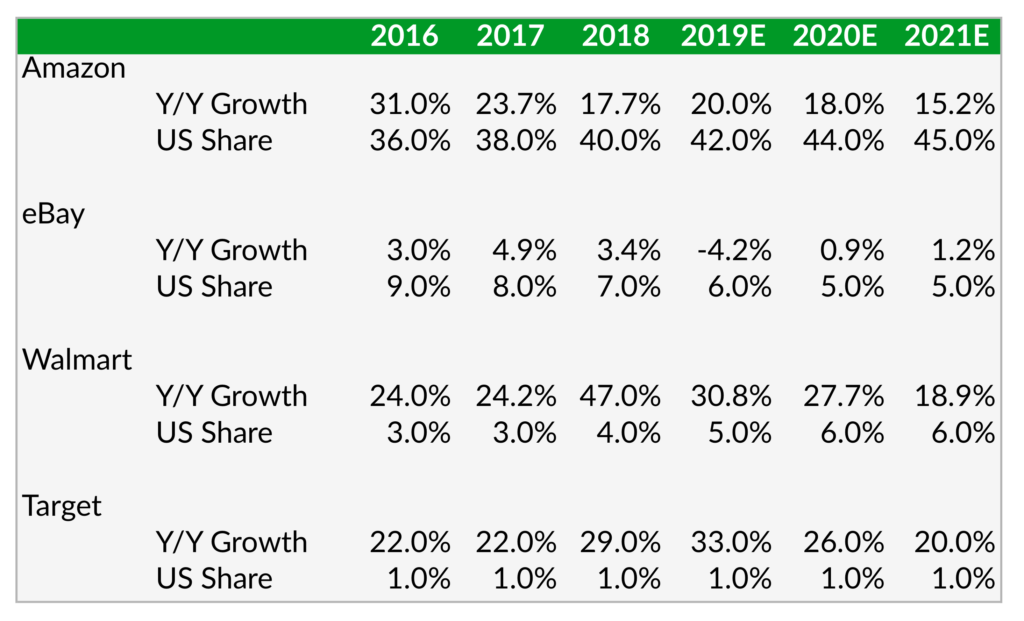
Exhibit 4 illustrates the power of just one of the many trends developing in e-commerce. The graph below shows the opportunity to grow online sales in the discounted space led by Walmart and Target. Both of these companies have tremendous resources and initiative to compete in the space. Their growth is ramping up at the expense of Amazon and eBay. The ability to shop online and pick up your item at your local Target or Walmart has become extremely popular. With several thousand stores spread across the U.S. these retailers have a significant advantage.

Exhibit 4

Source: B of A, Merrill Lynch

Several sources have reported successful Thanksgiving and Black Friday shopping results. According to Adobe Analytics, online sales (desktop & mobile) of $11.6 billion were up 17% over last year. That compares to 25% growth for 2018. Sales completed on smartphones continue to be the largest driver of e-commerce with smartphone sales accounting for 41% of online sales versus 31% last year. According to ShopperTrak, visits to stores over the two day period fell 3% with a 6% drop on Black Friday. Black Friday results were slightly weaker given heavy promotion in the beginning of Thanksgiving week and an earlier start to holiday shopping given lower than usual available shopping days until Christmas.

Dasher, Dancer, and Prancer agree that Santa will be busy

We have included a summary of three trade groups that publish their views on upcoming holiday sales. While each of them use a different data set to support their expectations, it is still important to note the growth year-over-year. In addition, we thought it would be interesting to look at how accurate each group has been over the past four years. Based on this data, we would not favor any one of these trade group’s prediction over the other. Also, it’s clear they all were too optimistic last year as was the majority of the Wall Street analyst community.

Exhibit 5

Source: AAM

According to a survey released by the National Retail Federation (NRF), shoppers will spend an average of $1,048 in 2019 for a total of approximately $728 billion. Shoppers plan to spend most of their time online and in department stores. For the 13th year in a row, the most popular present is expected to be gift cards. The most important factor when shopping at a particular retailer remains sales and discounts.

Walking in a not-so-wintery wonderland

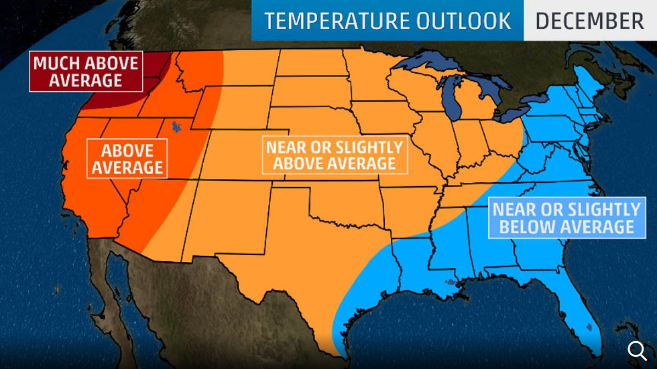
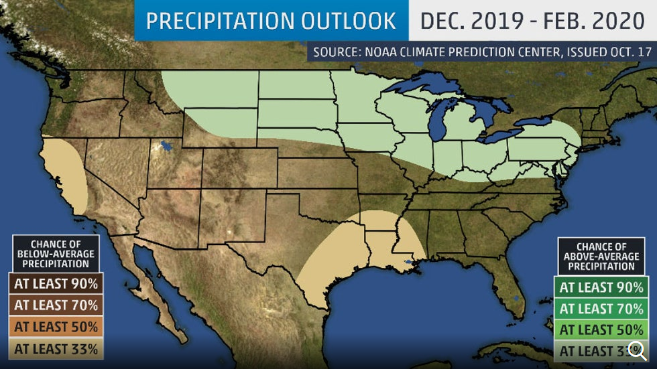
Weather and the shifting calendar are always important factors for holiday spending. According to Weather Trends International (WTI), December is expected to be slightly cooler with temps averaging 37.4F. Average precipitation for December is expected to be down 26%. The ideal weather for traveling holiday shoppers is cold and dry. Retailers want shoppers to buy winter products but not be turned away by heavy snow.

Exhibit 6

Source: Weather Trends International

Exhibit 7

Source: Weather Trends International

A key statistic tied to the strength of holiday retail sales is the number of days between Thanksgiving and Christmas. The maximum number of days possible is 32 and the minimum is 26. Obviously, for retailers the more shopping days between Thanksgiving and Christmas the better. This year, the total shopping days is 26, the minimum, versus the maximum 32 from last year. In addition, there are eight total weekend days to shop which is the minimum, versus the 10 weekend days we had last year.

Tie it up with a bow

We are optimistic about 2019 holiday spending. Consumer confidence is high and consumers are ready to spend this holiday season. The key predictor of back-to-school sales was better than last year, and the retail sector continues to expand with the ease and efficiency of online shopping. While tariffs and trade talk continues to create volatility in the financial markets, consumers seem to dismiss the potential downside. Of course, this is easier to do with the stock market up 246% year-to-date and with limited price increases expected during the holiday season.

  • Page 1
  • Page 2
  • Page 3
  • Interim pages omitted …
  • Page 9
  • Go to Next Page »

Get updates in your inbox.

  • Investment Strategies
    • Investment Grade Fixed Income
    • Specialty Asset Classes
  • Our Clients
    • Client Experience
    • Sample RFP Download
  • Insights
    • Video
    • Webinar
    • News
    • Podcasts
  • About
    • Our Team
    • Contact
    • Client Login

Disclaimer: Asset Allocation & Management Company, LLC (AAM) is an investment adviser registered with the Securities and Exchange Commission, specializing in fixed-income asset management services for insurance companies. Registration does not imply a certain level of skill or training. This information was developed using publicly available information, internally developed data and outside sources believed to be reliable. While all reasonable care has been taken to ensure that the facts stated and the opinions given are accurate, complete and reasonable, liability is expressly disclaimed by AAM and any affiliates (collectively known as “AAM”), and their representative officers and employees. This report has been prepared for informational purposes only and does not purport to represent a complete analysis of any security, company or industry discussed. Any opinions and/or recommendations expressed are subject to change without notice and should be considered only as part of a diversified portfolio. A complete list of investment recommendations made during the past year is available upon request. Past performance is not an indication of future returns. This information is distributed to recipients including AAM, any of which may have acted on the basis of the information, or may have an ownership interest in securities to which the information relates. It may also be distributed to clients of AAM, as well as to other recipients with whom no such client relationship exists. Providing this information does not, in and of itself, constitute a recommendation by AAM, nor does it imply that the purchase or sale of any security is suitable for the recipient. Investing in the bond market is subject to certain risks including market, interest-rate, issuer, credit, inflation, liquidity, valuation, volatility, prepayment and extension. No part of this material may be reproduced in any form, or referred to in any other publication, without express written permission. *All figures shown are approximate and subject to change from quarter to quarter. **The accolades and awards highlighted herein are not statements of any advisory client and do not describe any experience with or endorsement of AAM as an investment adviser by any such client.

Copyright © 2024 AAM | Privacy and Disclosures

  • LinkedIn
  • YouTube