Frosty the Snowman’s Summary
The holiday season continues to be a critical time of year for retailers as they earn up to 40% of their annual revenues during this time period. Based on adjusted figures from the U.S. Census Bureau, retail sales (excluding auto and gas) for the 2017 holiday season were up 6.1% which was the best growth in over ten years. That number will be difficult to beat this year. Despite the high hurdle, we think holiday sales will be up around 6.0% on an adjusted basis. Our bias is constrained given the tough comparison to last year and limited extraordinary spending trends. The following report explores some of the key components of our analysis.
Rudolph’s nose may be red, but the consumer is a “beast”
We believe the most important driver of retail sales is consumer confidence. The following table summarizes our analysis of nine factors that contribute to that level of confidence measured year over year.
Exhibit 1
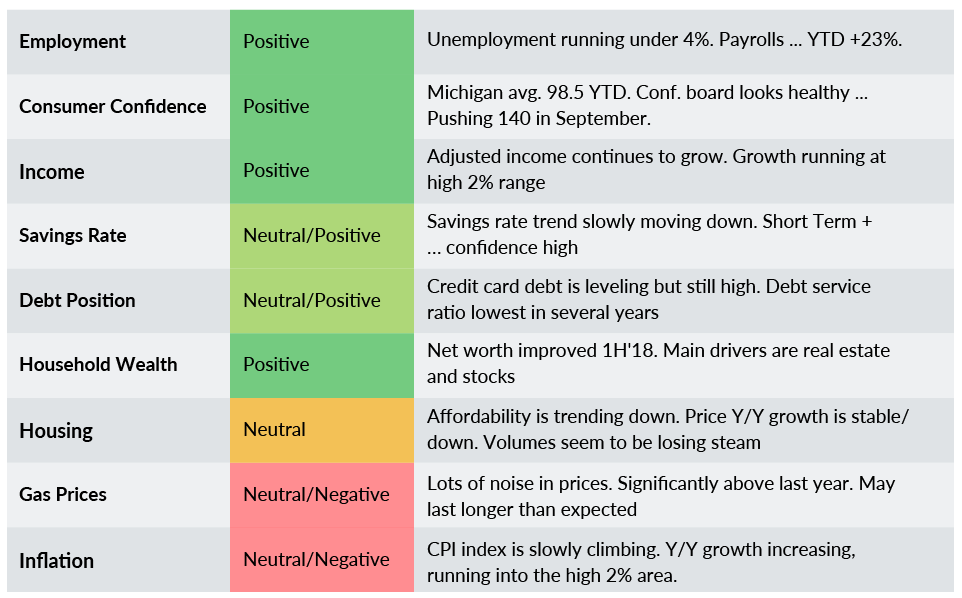
We have been tracking these factors since 2011, and they have never been this strong. Last year was good and this year looks moderately better year over year. Wages, confidence, and unemployment are all showing strong trends going into the end of the year. High gas prices are less of a factor now given the ease of online shopping, and inflation seems to be under control for now.
Ralphie Parker hates ‘back to school’ bullies, but what about his Christmas list?
A review of data from the last twenty years as displayed in Exhibit 2 reveals a significant correlation (78%) between “Back to School” retail sales – as measured in August and September – and holiday sales – as measured in November and December. To model the trend, we used the U.S. Census Bureau’s adjusted monthly retail trade data which includes a variety of retail businesses (excluding motor vehicle sales and parts dealers and gasoline stations; sales in those segments have been more heavily impacted by factors outside the control of consumers).
Exhibit 2
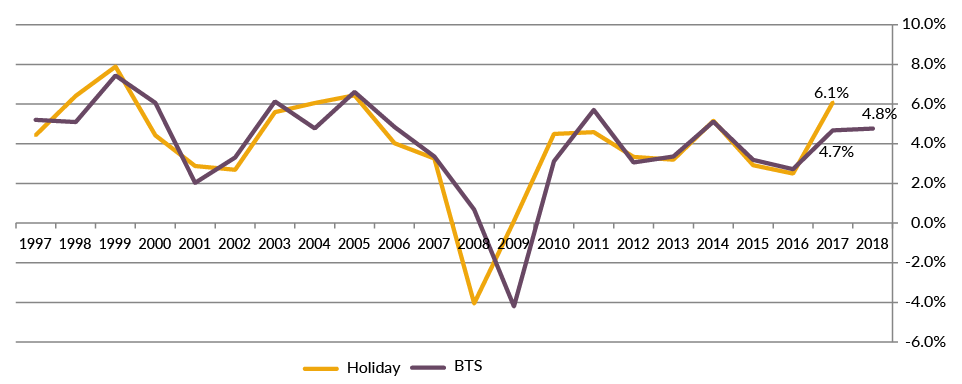
Our regression model predicts adjusted holiday sales of 3.8% when using the 4.8% actual for “Back to School” sales in 2018. This is just above the 20 year average of 3.9%. Comparatively, 2017 “Back to School” sales of 4.7% led to actual holiday sales of 6.1%. Clearly, the model did not do a good job last year in predicting holiday sales.
Same number of elves in the workshop this year
Overall, holiday related hiring is projected to be up this year versus last year. In many cases lower hiring in brick and mortar establishments is being offset by a greater need to support e-commerce sales. One thing for sure, costs to hire new employees is going up especially in those areas involved directly with product distribution.
The following is a graph from the National Retail Federation (NRF) which shows the change in holiday hiring over the past 15 years. The NRF predicts hiring will be up 585,000-650,000 positions compared to last years 582,500.
Exhibit 3
Buddy the Elf loves Gimbels, but consumers love e-commerce
Online retail sales continue to gather momentum and help fuel total retail sales even as store traffic continues to decline. Most industry experts are expecting mid-to-high teen increases this year from e-commerce sales. According to the U.S. Census Bureau, e-commerce now accounts for 11.2% of total retail sales year-to-date. We believe that figure actually is closer to 19% if you take excluded segments that are not currently at significant risk of an internet presence such as auto, restaurant/bar, and gas station sales. Thru October growth for the online category was 10.3% which is almost twice the 5.3% growth of total retail sales year to date.
Mobile shopping continues to be the largest driver of e-commerce. According to Salesforce data for Black Friday, mobile accounted for 67% of online traffic and 49% of actual order share. Salesforce data also showed that mobile traffic from social channels was up 94% on Thanksgiving Day with the vast majority of that originating from Facebook and Instagram.
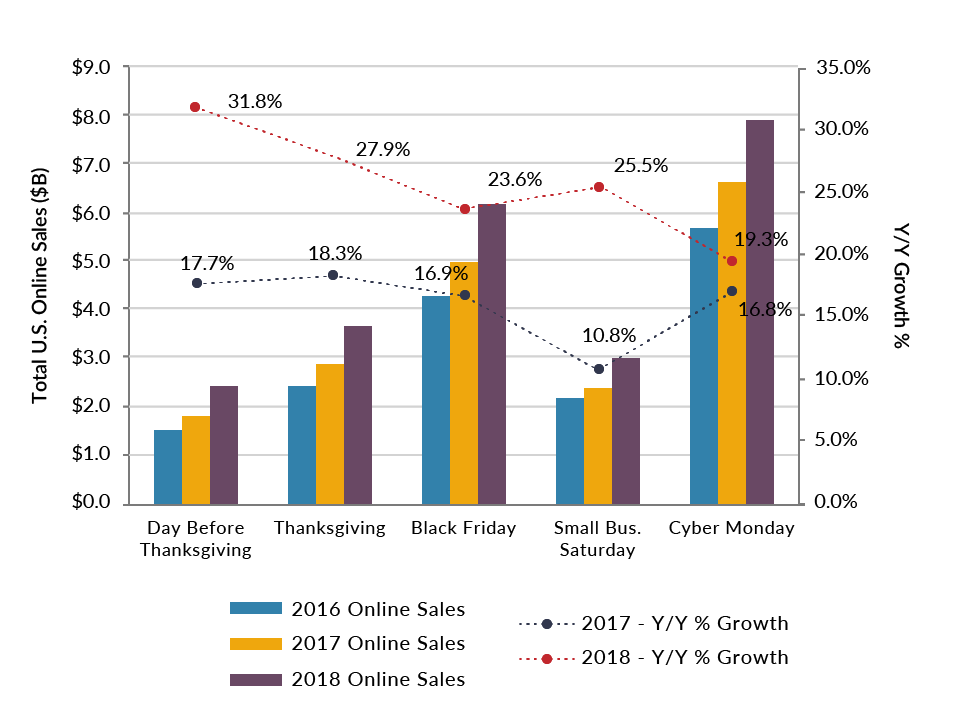
Several third party sources have posted positive results for the 5 day holiday sales weekend starting with the day before Thanksgiving. Adobe seems to provide the most comprehensive results for online sales indicating that online sales were up 24% this year. The following graph details each day of the holiday sales period with comparisons to previous years.
Exhibit 4
What are all of the Whos in Whoville saying?
According to a survey released by the National Retail Federation (NRF), shoppers will spend an average of $1,007 in 2018 for a total of approximately $717 billion and they plan to spend most of their time online and in department stores. For the 12th year in a row, the most popular present is expected to be gift cards, while sales and discounts remain the most important factors motivating sales at individual retailers. We thought it would be interesting to look at how accurate different retail trade groups have been with their holiday predictions over the past three years and we have included a summary in Exhibit 5. While each of them uses a different data set to support their expectations, it is still interesting to note the predicted growth year over year. Based on this data, we would not favor any one of these trade group’s prediction over the other because while all three expect sales to grow about the same as last year all three were considerably conservative in their expectations for 2017.
Exhibit 5

Wind chills and a white Christmas?
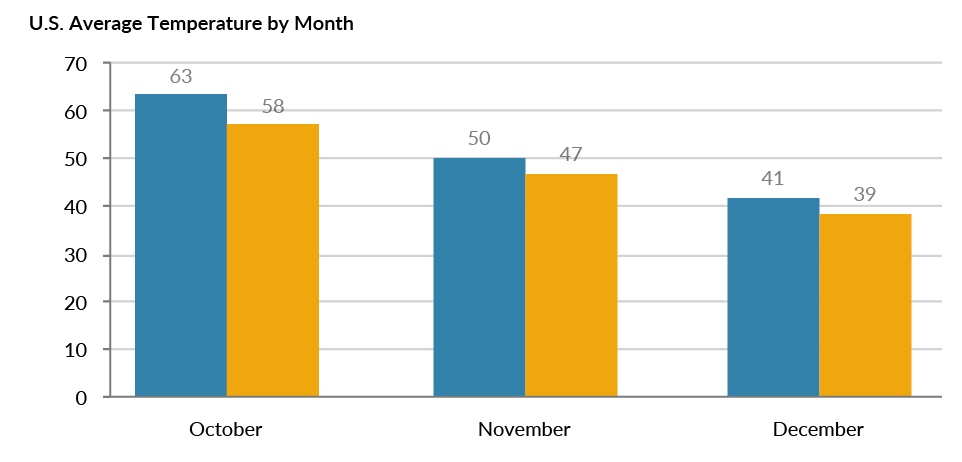
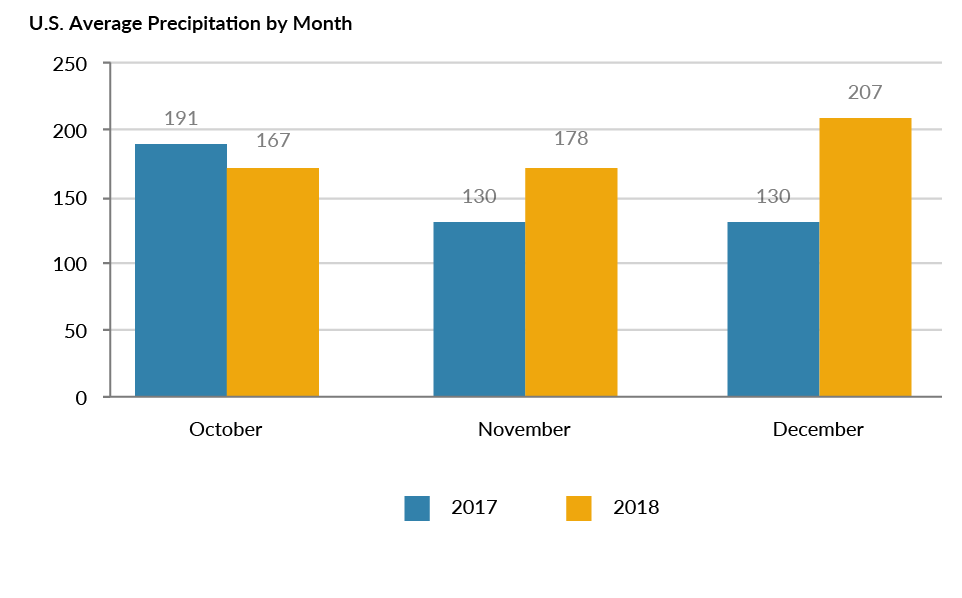
Weather and the shifting calendar are always important factors for holiday spending. According to Weather Trends International (WTI), this holiday season is expected to be somewhat more favorable with cooler temperatures offsetting the expectation of increased precipitation. The ideal weather for holiday shoppers is cold and dry. Retailers want shoppers to buy winter products but not be turned away by heavy snow.
Exhibit 6
The days between Thanksgiving and Christmas are key shopping days. This year, those days total 32 (26 is the minimum, 32 is the maximum) versus 31 last year. In addition, there are ten total weekend days to shop (maximum) which is the same as last year.
The way the cookie crumbles
Despite the previously noted favorable developments, there are some issues that could negatively impact sales this holiday season. These include inventory stock outs potentially arising from lower orders from China due to higher tariffs along with difficulty in seasonal hiring given the current low unemployment levels. Also, volatility in the stock market could have a “wealth effect” and could slow spending if investors feel like their net worth has been negatively impacted. Finally, strain on the transportation sector may impact availability of product for the holiday season and may slow holiday deliveries. At the end of the day, some of these potential “issues” probably are more of a concern for profitability versus top line sales for retailers.
So what do we expect under the tree this year?
Overall, we are optimistic about 2018 holiday spending. The typical consumer is in a stronger economic position this year versus last year and advancements in online and mobile retail makes it that much more pleasant to shop. However, beating last year’s impressive growth will be difficult given the lack of significantly positive ancillary factors this year.
