Director of Municipal Bonds
Surge in Tax-Exempt Performance Driven by Strong Technicals and Indifference to Tax-Reform Risks
The tax-exempt sector experienced very strong performance due to a continued build in positive technicals however; the market did absorb some rate volatility to close the quarter. Hawkish commentary from the European and British Central Banks pressured 10 year Treasury yields higher by 17 basis points (bps) over the last three trading days of the quarter. Muni yields in 10 years followed suit, with a selloff of 14 bps yet even with this backslide, the sector saw substantial gains for the quarter.
Very strong demand flows combined with a manageable new issue calendar provided the basis for the firm tone in the market. Municipal yields in 10 years finished the quarter by contracting by 26 bps, while 10 year Treasuries yields fell by a total of only 8 bps. The outperformance by the muni sector drove relative valuations to very expensive levels with 10 year municipal-to-Treasury yield ratios finishing the quarter at 86%.
In reviewing the primary catalysts for the strong muni performance, a very manageable calendar continues to play an important role. Overall issuance this year is down from last year by 14% driven in large part by a sharp contraction in refinancings. This segment of the new issue calendar produced a record last year and with rates surging at the end of 2016 the market expected to see a reduction in this issuance during 2017. Year-to-date the flow of deals classified as straight or pure refinancing saw a drop of 46% compared to 2016. However, we could be in the midst of a dramatic turnaround in this trend. Since the beginning of the year, tax-exempt yields in 10 and 20-year bonds have dropped by 32 and 25 bps respectively. As a result, the interest cost savings available from refinancings have become more compelling and are in line with the savings levels that were available over the last two record-producing years. The market is already showing signs of taking advantage of the new savings opportunities, with the monthly average of straight refinancings over the last two months increasing by 54% versus the monthly average over the first four months of 2017. We expect that this issuance trend will continue to build over the balance of the year if rates fall or remain range-bound around current levels.
Even with a substantial increase in supply, the market is poised to maintain its expensive relative valuation profile versus Treasuries in the near term. The market is currently enjoying record reinvestment flows of coupons/calls/maturities that should be in place through the end of August. Additionally, investors have seemingly become indifferent to any risks related to potential tax reform. As of this writing, muni relative valuations to taxables have richened to the point that they now exceed the levels that existed before the presidential elections. It appears that the market consensus has “priced-out” the risks for tax reform in 2017 driven in part by the protracted execution of the repeal and replacement of the Affordable Care Act. Although recent efforts have failed, congress and the President could remain preoccupied with this agenda item and hinder their efforts toward advancing other priorities. Consequently, it appears that expectations for tax-reform have been pushed into 2018 or beyond and as a result muni investors have become more emboldened to take more duration risk. That’s evident by a sharp 30 bps flattening in the muni yield curve from two to 30 years during the second quarter. As long as the execution of the President’s political agenda on healthcare and tax-reform continues to be protracted, investors will likely remain indifferent and demand flows should remain unabated.
In looking forward to our outlook for the third quarter and the balance of the year, we believe that the market is at overbought levels. Positive technicals should support the market over the next two to three months, but the market could see these supply/demand imbalance factors weaken going into the fourth quarter. The current yield environment increases the likelihood that a building supply cycle could develop on the heels of compelling refinancing metrics, which could pressure relative valuations to weaker levels. Additionally, we believe that the risk related to tax-reform, especially a reduction in corporate tax rates, is still an important event that bears close watching. Should there be any positive developments toward this agenda item as the Republican Party becomes more driven to produce reform and cuts before the 2018 mid-term elections, we could see a substantial amount of rate volatility and weaker relative valuation levels. Given these risks and the sector’s expensive relative valuation profile, we have moved to an underweight bias for the sector.
Disclaimer: Asset Allocation & Management Company, LLC (AAM) is an investment adviser registered with the Securities and Exchange Commission, specializing in fixed-income asset management services for insurance companies. Registration does not imply a certain level of skill or training. This information was developed using publicly available information, internally developed data and outside sources believed to be reliable. While all reasonable care has been taken to ensure that the facts stated and the opinions given are accurate, complete and reasonable, liability is expressly disclaimed by AAM and any affiliates (collectively known as “AAM”), and their representative officers and employees. This report has been prepared for informational purposes only and does not purport to represent a complete analysis of any security, company or industry discussed. Any opinions and/or recommendations expressed are subject to change without notice and should be considered only as part of a diversified portfolio. A complete list of investment recommendations made during the past year is available upon request. Past performance is not an indication of future returns. This information is distributed to recipients including AAM, any of which may have acted on the basis of the information, or may have an ownership interest in securities to which the information relates. It may also be distributed to clients of AAM, as well as to other recipients with whom no such client relationship exists. Providing this information does not, in and of itself, constitute a recommendation by AAM, nor does it imply that the purchase or sale of any security is suitable for the recipient. Investing in the bond market is subject to certain risks including market, interest-rate, issuer, credit, inflation, liquidity, valuation, volatility, prepayment and extension. No part of this material may be reproduced in any form, or referred to in any other publication, without express written permission.


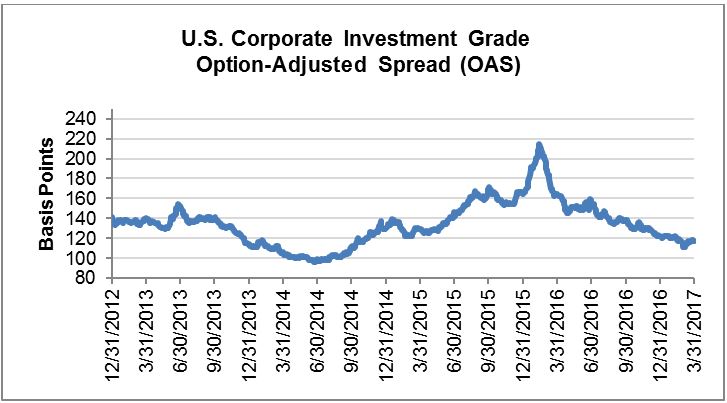 Source: Bloomberg Barclays, AAM
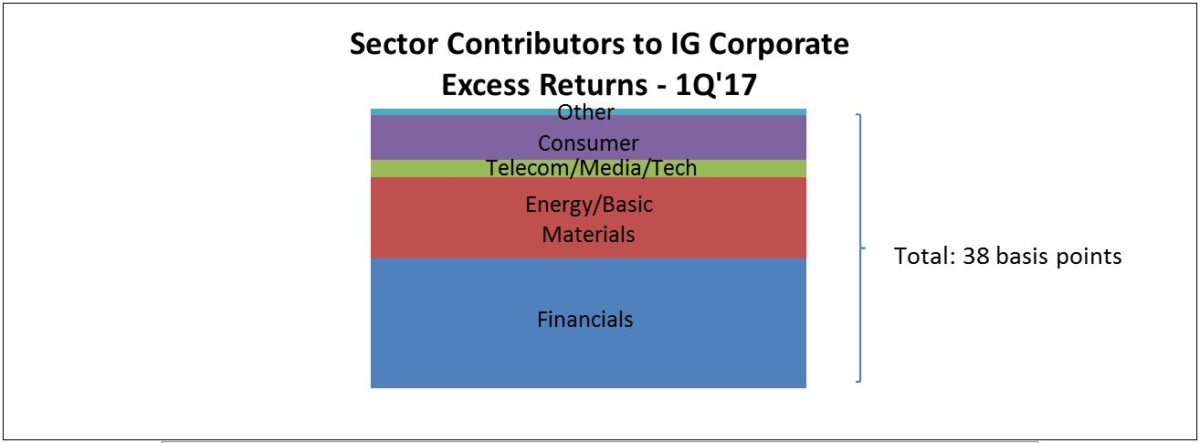
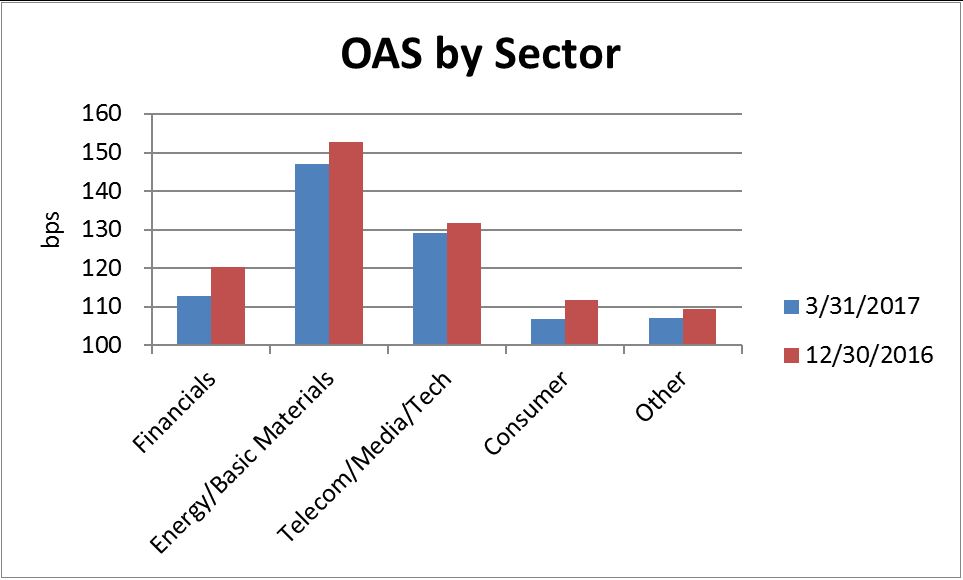 Source: Bloomberg Barclays Index (as of 3/31/2017), AAM
 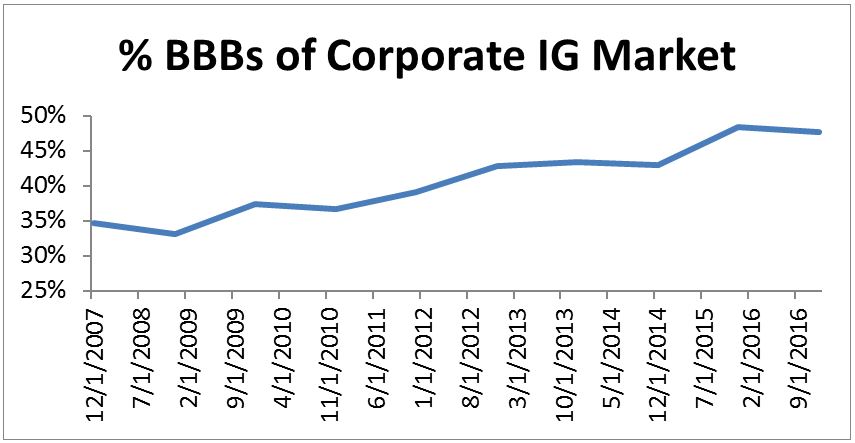 Source: Bloomberg Barclays (based on market values); AAM