• Skip to primary navigation
  • Skip to main content
  • Skip to footer
AAM CompanyTransparent Logo

AAM Company

AAM Company Website

  • Investment Strategies
    • Investment Grade Fixed Income
    • Specialty Asset Classes
  • Clients
    • Our Clients
    • Client Experience
    • Download Sample RFP
  • Insights
    • Video
    • Webinars
    • Podcasts
    • News
  • About
    • Our Team
    • Events
  • Login
  • Contact Us
Contact

Sector Commentary

November 17, 2016 by

The Election is Over – but will consumers spend?

By Mike Ashley
Senior Analyst, Corporate Credit

[toc]

This November has been full of surprises. The Cubs won the World Series and Trump won the White House. As we head into the holiday season, I can’t say that either will be a major driver of retail sales, but I can say that there will be Cub’s jerseys under the tree for our kids this year.

This is always a critical time of year for retailers because they realize up to 40% of their annual revenues during the holiday season. Based on adjusted figures from the U.S. Census Bureau, retail sales (excluding auto and gas) for holiday 2015 were up 3.0%. We believe that sales for this year will be stronger, up 3.25% to 3 .75%. The following report explores some of the key drivers of our analysis.

The Consumer Is Solid

The most important driver of retail sales is the strength of consumer’s confidence to spend money.  The following table summarizes our analysis of nine factors that contribute to that level of confidence measured year over year.

Exhibit 1: Factors Affecting Consumer Confidence

Factors Position Explanation
Employment Neutral/Negative 5% or below for the last 12 months. Payrolls bounced from May, YTD down 18%.
Consumer Confidence Neutral Michigan and Conf. board look healthy. Conf. above 100 last 2/3 months. MI may be weakening.
Income Neutral Adjusted income continues to grow. Less growth so far this year (YTD AVG 2.7% vs 2015=3.6%).
Savings Rate Neutral/Positive Savings rate trend slowly moving down vs moving up last year. Below 6.0% for the last 5 months.
Debt Position Neutral/Negative Credit card debt is climbing. Grew 6.2% in Aug (5yr high). Debt service ratio stabilized.
Household Wealth Neutral Net worth improved 2Q’16. Y/Y growth loosing steam. Real estate continues to be the main driver.
Housing Positive Affordability is trending up last 3 months. Price Y/Y growth is up YTD. Volumes are up especially new.
Gas Prices Neutral Moving off the lows of FEB. Around the same price this time last year.
Inflation Neutral CPI index is slowly climbing. Y/Y growth has averaged around 1% YTD.

The overall picture resembles last year’s as housing prices and sales continue to improve. Home-related retailers Home Depot and Lowe’s experienced strong and consistent same store sales, reflecting home owners’ comfort with their equity position as well as the transition from “rent” to “buy”. While the savings rate has trended down, credit card debt continues to grow steadily, reflecting improved consumer confidence. This seems to be a fairly healthy trend, however we believe it warrants continued monitoring due to the potential for poor credit card performance which could signal a delay in spending.

Employment trends may be the most important determining factor for consumer health. We continue to see a steady to improving unemployment number while maintaining sensitivity to payroll numbers given earlier published data as well as the general trend versus last year.

The Election Is Over but will Consumers Spend?

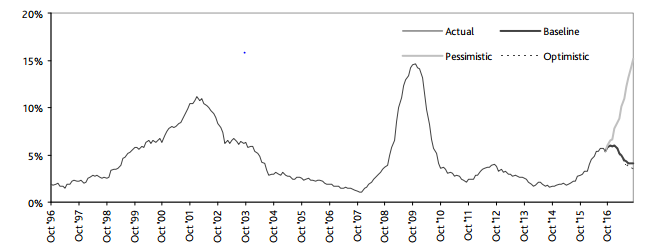
This presidential race has been one of the most interesting and contentious in recent history.  Prior to November 8, various sources reported consumers were putting off spending because of the uncertainty associated with the election.   In a poll conducted by the National Retail Federation in mid-October, more than a quarter of consumers said the election will impact their spending plans for the holidays.  43% said they will be more cautious with their spending due to the uncertainty of the election cycle.   The University of Michigan Consumer Sentiment Index experienced a significant move lower in October of this year.  As shown below, October was the weakest reading we have seen since September of last year.  We believe this has to do, in part, with the election.

Exhibit 2: Consumer Sentiment Index

graph-1-holiday


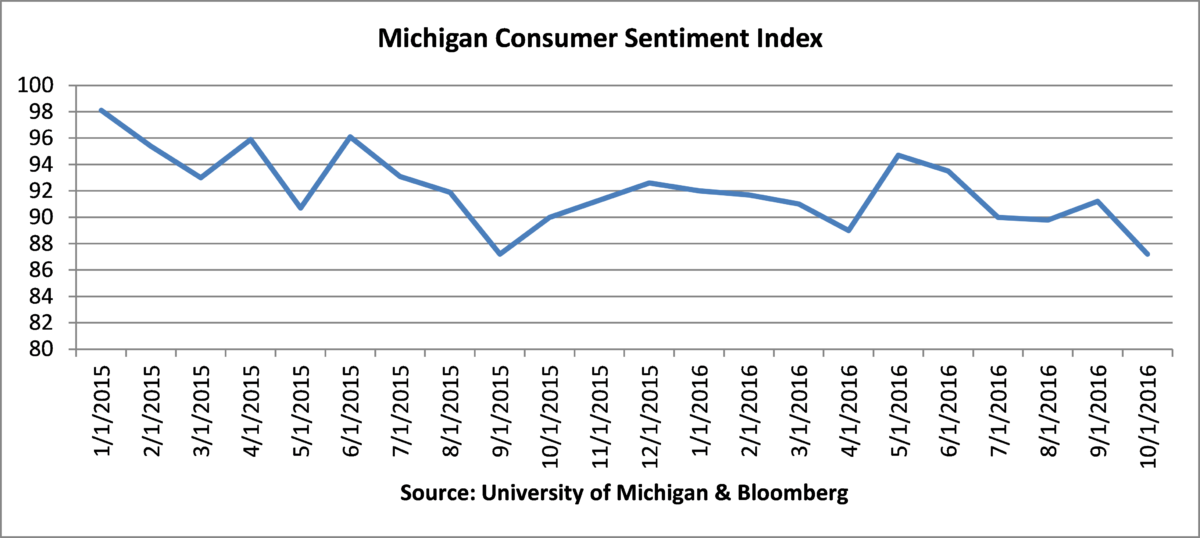
Questions  remain even now that our 45th President has been elected.  Some degree of personal tax cuts coupled with an attempt to stem escalating healthcare costs will benefit a large percentage of consumers.  And, the expectation of a thicker wallet in coming years may boost consumers confidence this holiday season.

Auto Sales Will Not Slow Spending

A significant amount of consumer spending this year has been on big ticket items, including new cars and home appliances.  The fear is that spending on these items could negatively impact holiday season shopping for various discretionary purchases.   According to the Advance Monthly Trade Retail Report issued by the U.S. Census Bureau, motor vehicle spending accounts for about 20% of total retail spending.   Year to date through September, spending on this category was up 2.8%.  According to Wards Automotive Group, auto sales of 14.4 million cars for 2016 (through October) are about unchanged versus last year.  Several sector analysts feel that auto sales are close to peak levels.

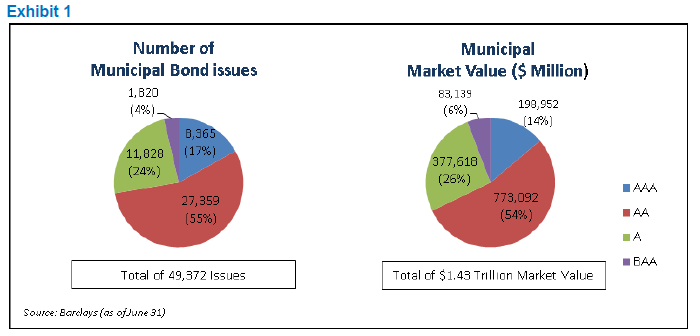
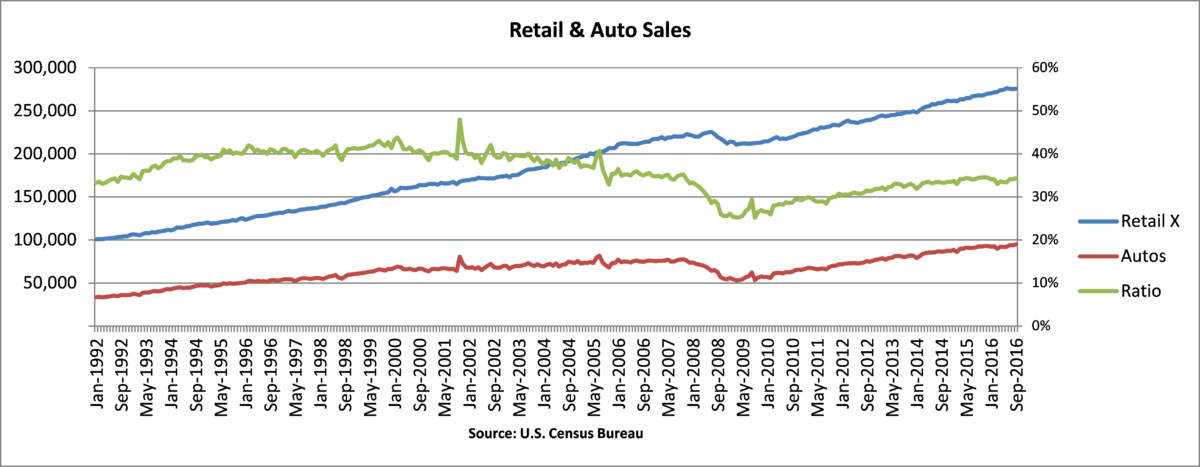
We took a closer look at the history of auto sales and what impact they might have on overall consumer spending. To do this we used data from the monthly retail trade data completed by the U.S. Census Bureau and compared the Motor Vehicle & Parts Dealers portion of spending to retail spending.   The result is graphed below.   What we observed is that retail spending (not including auto) is growing faster than auto spending.     The ratio of auto spending to retail spending  has ranged between 33%-35% for the last 31 months. Based on this information it appears there is still opportunity for auto sales to grow without impacting retail spending and motor vehicle spending may even go down if we have in fact reached peak auto sales.

Exhibit 3: Retail vs. Auto Sales

graph-2-holiday


Statistical Analysis – Model Predicts Brighter Holiday

A review of data from the last twenty three years reveals a significant correlation (81%) between “Back to School” retail sales measured in August and September and “Holiday” sales as measured in November and December. To model the 2016 trend we used the U.S. Census Bureau’s monthly retail trade data which includes a variety of retail businesses (excluding motor vehicle and parts dealers and gasoline stations; sales in those segments have been more heavily impacted by factors outside the control of consumers).

Our regression model predicts “Holiday” sales of 3.11% when using the 2.89% actual for “Back to School” sales in 2016. Comparatively, 2015 “Back to School” sales of 3.37% led to actual “Holiday” sales of 3.00%. If the model is correct, “Holiday” sales of 3.11% in 2016 would be below the 23 year average of 4.2%.

Seasonal Hiring Looks Similar to Last Year

The National Retail Federation predicts that between 640,000 and 690,000 seasonal workers will be hired during this holiday season (NRF Website).To give context, this is compared to 675,300 hired last year and 697,500 hired in 2014 (NRF website).   Companies, including Macy’s, Kohl’s, and Target seem to be adding holiday staff in a somewhat conservative manner as compared to last year.  Meanwhile, e-commerce leader Amazon is hiring 120,000 seasonal employees, up 20% from last year.   Shipping giants FedEx and UPS are predicting a similar holiday season to 2015. UPS expects to complete 700 million deliveries worldwide, only 100 million more than last year, between Thanksgiving and New Years (3Q Earnings Transcript).  Based on this data, we believe retailers are expecting a similar holiday season vs. last year.

Online Shopping Remains Strong – No Slowdown in Sight

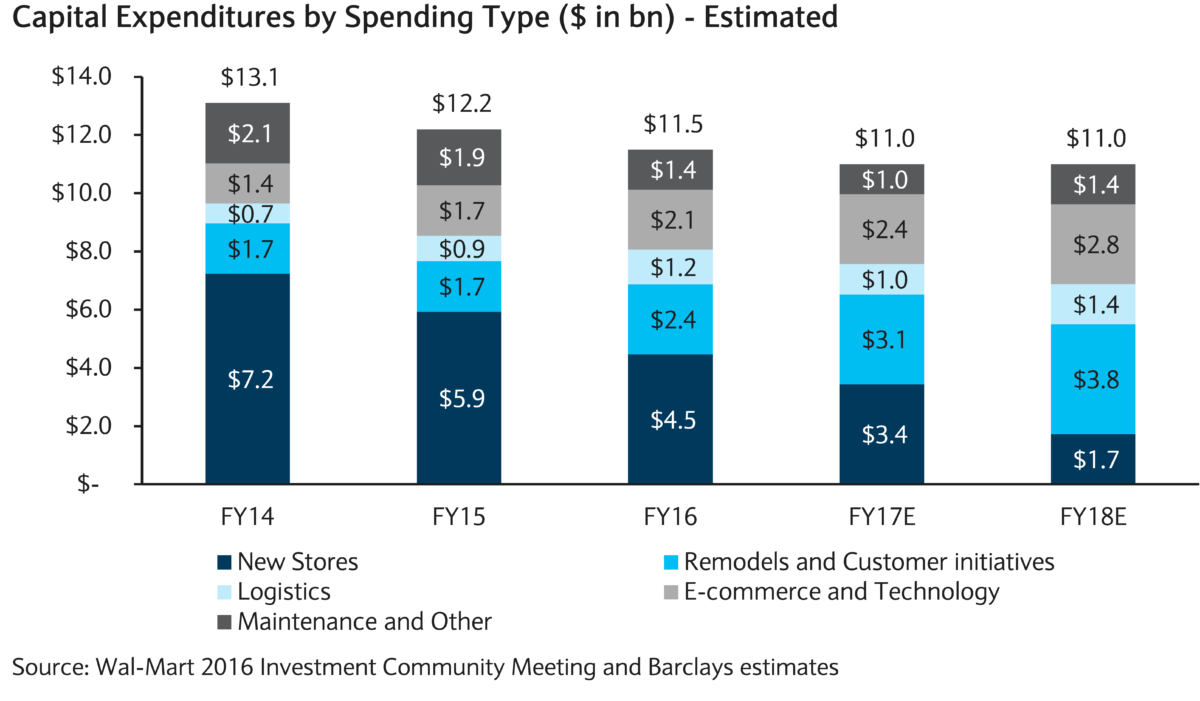
Online retail sales continue to gather momentum, but even with the incredible advancements in this area, most shoppers still want to visit an actual store.  Some items simply need to be touched or tried on before being purchased.  In addition, holiday shopping can be a very sentimental experience, something that the internet can’t mimic with the click of a button as compared to physical stores.   Having said that, most of the major department stores are significantly investing  in their e-commerce strategy.   Below is a graph that segments an estimate of spending by Wal-Mart through 2018. There has been a clear trend to spend less on new stores and more on e-commerce and remodels.

Exhibit 4: Capital Expenditures by Spending Type

graph-3-holiday

According to the U.S. Census Bureau, E-commerce now accounts for 10.1% of total retail sales.  We believe that figure is closer to 17% if you take into account the segments that are not currently at risk of an internet presence such as auto sales, restaurant/bar sales, and gas station sales.  YTD growth for the online category was 10.8% through September easily beating the next best category, Personal Care which was up 7.1%.  According to the National Retail Federation (NRF), the average shopper said that 56.5% of their shopping will be completed online, up from under 50% last year.  In addition, mobile devices are now much easier to use and are playing a bigger role in the consumer shopping experience.

E-commerce has made everything about shopping easier and more convenient, including researching a product, finding the best price, and determining the best way to take delivery.   Retailers are expanding their online assortments and offering an increasingly more efficient and inexpensive (free) delivery system.  In addition, retailers are becoming more creative about how to use their online platform.   For example, Foot Locker launched a new app that allows users to sign up for newly released shoes through a lottery system.   The customer avoids long lines and frustration while staying in touch with the latest product offerings.  We expect that this kind of positive experience goes a long way in keeping  customers interested and more likely to follow through on the purchase.

Trade Group Surveys  Expect Higher Growth in 2016

We have included a summary of three trade groups which publish their views on upcoming holiday sales. While each of them uses a different data set to support  their expectations, the more important aspect is the change in growth year over year.   In addition, we thought it would be interesting to look at how accurate each group has been over the past three years.   Based on this data, we wouldn’t favor any one of these trade group’s prediction over the other.

Exhibit 5: Holiday Sales Predictions

  Forecast Actual Forecast Actual Forecast Actual Forecast
2016 2015 2015 2014 2014 2013 2013
Deloitte 3.6 – 4.0 3.6 3.75 5.2 4.25 2.8 4.25
National Retail Federation 3.6 3.2 3.7 4.1 4.1 3.1 3.9
Intl. Council of Shopping Center 3.3 2.2 3.3 3.6 4.0 3.4 3.4

According to National Retail Federation (NRF), shoppers will spend an average of $935.58 in 2016. When compared to the last 12 years, 2016 will be the second highest, the peak remaining  $952.58 in 2015. About 63% of the total will go towards gifts with the balance to be spent on holiday related items including food and decorations.  Shoppers plan to spend most of their time in department stores, online, and in discount stores. The most popular present is expected to be gift cards followed by clothing.

Weather & Calendar Give the Edge

Weather and the changing calendar are always important factors for holiday spending. According to Weather Trends International (WTI), this holiday season is expected to be much colder while precipitation is predicted to be less than last year but still above normal. The ideal weather for department stores is cold and dry. Retailers want shoppers to buy winter products but not be turned away by heavy snow.

The days between Thanksgiving and Christmas are key shopping days. This year, those days total 30 (26 is the minimum, 32 is the maximum) versus 28 last year. In addition, there are nine total weekend days to shop, one more than last year and Christmas and New Years both fall on a Sunday. This makes a strong “eve” shopping day more likely and the day after a legitimate shopping day given that most business offices are closed the Monday following the holiday.

Conclusion

We are optimistic about 2016 holiday spending because just about every variable is lining up for a better year than 2015.

  • The consumer continues to be in good shape as unemployment inches lower and wages grow.
  • We are not concerned that big ticket purchases, including autos, will alter overall behavior.
  • Online purchases continue to provide a headwind for overall sales.
  • Seasonal hiring patterns appear neutral while weather/calendar may create a slight edge to final results.
  • This holiday season post-election consumer sentiment is the biggest wildcard.

On Macy’s 3Q earnings call on 11/10/16, an analyst asked CFO Karen Hoguet what her thoughts were now that the election is over. Her response:

“I have no clue. I have no clue. We’ll all watch together.”


Written by:
Mike Ashley

Michael J. Ashley is a Principal and Corporate Credit Senior Analyst at AAM with 19 years of investment experience. Prior to joining AAM, Mike worked at Northern Trust Global Investments with responsibility for following investment grade industrials including credits in the basics, energy, consumer products, media, and retail sectors. Mike earned a BA from the University of Iowa in Management Information Systems and an MBA from DePaul University in Finance.


For more information about AAM or any of the information in the Retail Outlook, please contact:

Colin T. Dowdall, CFA, Director of Marketing and Business Development
colin.dowdall@aamcompany.com

John J. Olvany, Vice President of Business Development
john.olvany@aamcompany.com

Neelm Hameer, Vice President of Business Development
neelm.hameer@aamcompany.com

logo


Disclaimer: Asset Allocation & Management Company, LLC (AAM) is an investment adviser registered with the Securities and Exchange Commission, specializing in fixed-income asset management services for insurance companies. This information was developed using publicly available information, internally developed data and outside sources believed to be reliable. While all reasonable care has been taken to ensure that the facts stated and the opinions given are accurate, complete and reasonable, liability is expressly disclaimed by AAM and any affiliates (collectively known as “AAM”), and their representative officers and employees. This report has been prepared for informational purposes only and does not purport to represent a complete analysis of any security, company or industry discussed. Any opinions and/or recommendations expressed are subject to change without notice and should be considered only as part of a diversified portfolio. A complete list of investment recommendations made during the past year is available upon request. Past performance is not an indication of future returns.This information is distributed to recipients including AAM, any of which may have acted on the basis of the information, or may have an ownership interest in securities to which the information relates. It may also be distributed to clients of AAM, as well as to other recipients with whom no such client relationship exists. Providing this information does not, in and of itself, constitute a recommendation by AAM, nor does it imply that the purchase or sale of any security is suitable for the recipient. Investing in the bond market is subject to certain risks including market, interest-rate, issuer, credit, inflation, liquidity, valuation, volatility, prepayment and extension. No part of this material may be reproduced in any form, or referred to in any other publication, without express written permission.

October 25, 2016 by

Given our outlook and the currently attractive relative valuation levels, we are moving to an overweight bias for the municipal sector.

Supply technicals were expected to drive volatility in relative valuations this year, and so far, that’s played out in the second half of the year. With 10-yr Treasury rates plunging at the beginning of the 3rd quarter to 1.36% following Britain’s decision to leave the European Union, munis followed suit, with rates moving to a record low of 1.29%. These low nominal yields have induced state and local governments to execute refinancings to levels that are running in tandem with 2015’s record level of issuance. The surge in refinancings during the quarter helped produce record levels of issuance in August and September, resulting in yields rising across the yield curve. Tax-exempt yields in 10-yrs moved higher by 16 basis points (bps) versus a 12 bps move in Treasuries. The long-end of the municipal curve exhibited the worst performance, with yields in 20 and 30-yrs increasing by 27 and 29 bps, respectively. Treasury rates in 30-yrs were higher by only 3 bps.

The front end of the muni yield curve also faced poor performance as the market adjusted to the new regulations surrounding money market reform. New standards that went into effect on October 14th now require that money market funds sold to institutions move to a floating valuation and adopt restrictions that limit investor withdrawal access if the fund’s liquidity falls below certain levels. These reform measures have resulted in year-to-date municipal money market fund outflows of $126 billion as of October 19th.

Consequently, relative valuations of bonds with maturities from 1 to 3-yrs have moved to some of the most attractive levels the market has experienced in over three years. Since August 29th, tax-adjusted spreads for these maturities moved wider by 39, 49 and 44 bps in 1, 2, and 3-yrs, respectively. These adjustments in spread levels have moved our relative valuation bias to a neutral position for this area of the curve from a negative bias that was in place during the first 9 months of the year.

Similarly, the balance of the yield curve is also facing significantly weaker relative valuation levels resulting from weaker technicals. Mutual fund flows, which were experiencing very strong weekly inflows through September with an average of ~$700 million per week, have now moved to outflows of $136 million as of October 19th.

Additionally, seasonal reinvestment flows for coupons/calls/maturities are also near lows for the year during October and November. The drop in demand flows, combined with the recent surge in new issuance, has produced substantial curve steepening pressure. The slope of the yield curve from 5 to 20-yrs has steepened by 13 bps since August 29th and tax-adjusted spreads in 15 and 20-yrs have widened by 43 and 41 bps, respectively, providing that area of the curve with a very compelling entry point for investment.

In looking at the supply outlook for the year, the market is expecting the sector to produce a new record of $445 billion. Both August and September have already reached record levels for their months, with issuance of $45 billion and $35.6 billion, respectively. The market also expects that October and November could approach record levels of over $50 billion per month. Consequently, key relative valuation metrics of municipal/Treasury ratios and tax-adjusted yield spreads to Treasuries have adjusted to near 6-month highs as of this writing.

Looking forward, we expect to see a dramatic slowdown in issuance going into December. In a comparable fashion to the issuance cycle that developed during the latter portion of 2015, it’s expected that state and local governments will curtail issuance, especially rate-sensitive refinancings, to avoid any potential market volatility surrounding the Federal Reserve’s next rate increase. Going into potential Federal Reserve rate hikes in September and December last year, new issuance supply plunged 24% during the last 6 months of the year. Similarly, with the market consensus of at least one rate hike for the balance of this year, the market projects issuance in December this year to decline by 33% relative to the average expected monthly issuance of $41 billion from August to November. This dramatic drop in issuance, combined with the anticipated improvement in demand technicals from robust reinvestment flows of coupon/calls/maturities in December and January, should produce solid muni relative performance going into the new year. Given our outlook and the currently attractive relative valuation levels, we are moving to an overweight bias for the municipal sector. Our objective will be to gradually build up our sector exposure level into the projected supply surge and to further extend our overweight exposure if further dislocations in relative valuations develop.

Written by:
GregoryABell
Greg Bell, CFA
Director of Municipal Products

Disclaimer: Asset Allocation & Management Company, LLC (AAM) is an investment adviser registered with the Securities and Exchange Commission, specializing in fixed-income asset management services for insurance companies. This information was developed using publicly available information, internally developed data and outside sources believed to be reliable. While all reasonable care has been taken to ensure that the facts stated and the opinions given are accurate, complete and reasonable, liability is expressly disclaimed by AAM and any affiliates (collectively known as “AAM”), and their representative officers and employees. This report has been prepared for informational purposes only and does not purport to represent a complete analysis of any security, company or industry discussed. Any opinions and/or recommendations expressed are subject to change without notice and should be considered only as part of a diversified portfolio. A complete list of investment recommendations made during the past year is available upon request. Past performance is not an indication of future returns.

This information is distributed to recipients including AAM, any of which may have acted on the basis of the information, or may have an ownership interest in securities to which the information relates. It may also be distributed to clients of AAM, as well as to other recipients with whom no such client relationship exists. Providing this information does not, in and of itself, constitute a recommendation by AAM, nor does it imply that the purchase or sale of any security is suitable for the recipient. Investing in the bond market is subject to certain risks including market, interest-rate, issuer, credit, inflation, liquidity, valuation, volatility, prepayment and extension. No part of this material may be reproduced in any form, or referred to in any other publication, without express written permission.

October 17, 2016 by

Remain Disciplined

By Elizabeth Henderson, CFA
Director of Corporate Credit

Elizabeth Henderson

We are in the late stage of the credit cycle and anticipate an increase in credit rating downgrades to put pressure on spreads for investment grade issuers. These negative fundamentals are partially offset by strong market technicals. We advocate remaining defensive and selective while maintaining the flexibility to take advantage of opportunities that we expect will arise over the near-to-intermediate term.

[toc]

The Investment Grade Corporate bond market delivered a 1% total return in the third quarter, tightening 18 basis points (bps), as defined by the Bloomberg Barclays index.  Risk assets outperformed, as the S&P Index increased close to 4% in the third quarter, and high yield returned approximately 5%.   Investors largely shrugged off oil price volatility, heavy new debt issuance, weaker than expected economic data, and a lackluster earnings season.  China’s stimulus, dovish monetary policy and resilient economic growth have likely supported risk assets and commodity prices.  Energy and Basic Materials have been significant outperformers this year due to higher commodity prices.

Exhibit 1: U.S. Corporate Investment Grade Option-Adjusted Spread (OAS)

OAS

 Source: Bloomberg Barclays, AAM

For spreads to tighten meaningfully next year, fundamentals need to improve and market volatility needs to remain low.  The cost of equity continues to surpass the cost of debt, incentivizing companies to reduce their equity base to drive growth.  We expect this to continue until the cost of debt reprices, which will not likely come unless the probability of a recession increases and the market grows more concerned about future growth prospects.  We recognize that in general, favorable market technicals, not broad credit fundamentals, have been the primary driver of  tighter spreads.  Thus, we remain disciplined as we build corporate bond portfolios.

Performance Summary Year-to-Date

Performance has been fairly widespread among the non-financial corporate bond sectors year-to-date. Energy and Basic Materials rebounded strongly and would have driven returns even higher if $33 billion of debt had not been downgraded to high yield in January and February of this year.  Longer maturity corporate bonds have outperformed year-to-date given overall spread tightening and the demand from yield focused accounts, especially in Asia.  Financials have lagged because of the prospect of lower rates for longer and the rally in commodity based sectors.  Lastly, shorter maturity corporate bonds have underperformed in recent months in part due to money market reform in the US.  The imposition of a floating NAV for institutional Prime Money Market Funds (MMF) has resulted in an outflow from these funds.  As a result, issuers that had previously relied on CP issuance to Prime MMFs to fund working capital needs have instead tapped the corporate bond market in the 2-3 year space, thus pressuring this part of the corporate curve.

Exhibit 2: U.S. Contributors to IG Corporate Excess Returns YTD 2016

graph-new

Source: Bloomberg Barclays Index (as of 9/30/2016), AAM 

Credit Fundamentals Remain Lackluster

Credit metrics did not improve in the second quarter. Revenue growth (for non financials, excluding commodity related firms) was flat while EBITDA grew a modest 2%. This is not expected to change much in the third quarter, as reflected by analyst estimates. Debt growth at 7% continued to outpace EBITDA growth, as share buybacks accelerated. Shareholders continue to reward firms for using their balance sheets to buyback shares. Other credit metrics deteriorated as well, including cash interest coverage and cash as a percentage of debt.

Option-Adjusted Spread (OAS) per unit of debt leverage is nearing a historically low point. To approach the median (77), OAS needs to widen 55 bps which is about 60% of a one standard deviation move. Otherwise, fundamentals would need to meaningfully improve. This theme is consistent in U.S. high yield as well as European credit. Unless the cost of debt rises (or the cost of equity falls), we do not expect companies to change their behavior radically as it is in the best interest of shareholders to continue to de-equitize unless growth prospects improve.

Exhibit 3: Median OAS/Debt Leverage

OAS/Debt

Source: Bloomberg Barclays, CapIQ using median figures for IG non-Financials as of 6/30/2016, AAM

Regarding growth prospects, economists are not expecting global growth to accelerate much next year, with global GDP expected to increase from 2.9% in 2016 to 3.1% per Bloomberg estimates.

GDP Estimates 2016 (%) 2017 (%)
United States 1.5 2.2
European Union 1.8 1.4
China 6.6 6.3
Japan 0.6 0.8
Latin America -1.7 1.7
United Kingdom 1.8 0.7

Source: Bloomberg (Economist estimates) as of 10/12/2016

M&A Still Preferred Over Capital Investment

Companies continue to use debt and cash to fund acquisitions versus increasing capital expenditures despite increased resistance from regulators and the U.S. Treasury.  Reduced investment spending as a percentage of GDP has been driving productivity lower.

Exhibit 4: (1) North America M&A Volume and (2) Business Investment

BI

Source: St Louis Fed, Bloomberg, AAM 

When analyzing 2017 capital spending estimates for the universe of investment grade companies, we expect spending next year to be approximately flat vs. 2016 on the aggregate with less than ten industries growing at a rate faster than (1) they did in 2016 and (2) the economy overall (2% assumed).  While acquisitions have slowed since the peak in 2015, share repurchases have only accelerated.  Given the relative performance of companies that have pursued this strategy, per Bank of America’s study, we would expect this behavior to continue.

Exhibit 5: Cumulative Stock Performance of Companies Repurchasing Shares Relative to the Market

graph5

Market Supply and Demand Technicals Remain Supportive

Unlike fundamentals, it is difficult to predict a change in technical related behavior.  We note that while valuations look expensive relative to fundamentals, we believe it will take a major shock to increase credit spreads meaningfully in an environment where central banks are buying fixed income securities, reducing available supply.  Demand continues to come from yield hungry foreign investors.

Exhibit 6: Foreign Ownership of USD Corporate Bonds

graph6

Investing in the Late Stage of the Credit Cycle

Defaults have increased this year largely due to commodity related issuers.  We continue to monitor the contagion effects of weak economic growth and tighter credit standards.  We expect the default cycle will be longer and recoveries lower than they have been historically given the (1) amount of debt outstanding is relatively high, (2) low level of interest rates, making it more difficult to lower the cost of debt via monetary policy, and (3) structural changes in the market post financial crisis affecting liquidity (and the ability to access the market for refinancing).  That said, defaults are expected to decline over the near term with the improvement in commodity prices.  Moody’s expects the U.S. default rate to be 5.9%, declining to 4.1% by third quarter 2017.  But as its forecast indicates, the pessimistic rate rivals the rate in 2009.

Exhibit 7: Moody’s US Speculative-Grade Default Rates (Actual and Forecast)

graph7

Source: Moody’s “September Default Report” 10/10/2016

We are in the late stage of the credit cycle and anticipate an increase in credit rating downgrades to put pressure on spreads for investment grade issuers. These negative fundamentals are partially offset by strong market technicals. We advocate remaining defensive and selective with opportunities in intermediate maturity domestic banks, high quality short insurance and autos, electric utilities, M&A related new issuance (e.g., pharma), and select telecom/tower and energy credits.  We want the flexibility to take advantage of opportunities that we expect will arise over the near-to-intermediate term, while investing in credits with more predictable cash flows that offer a yield advantage.  We recognize the importance of earning sufficient income to not only satisfy the needs of our clients but to cushion the spread volatility that is likely to increase from a very low level over the last six months.


Written by:
Elizabeth Henderson, CFA

Elizabeth Henderson is a Principal and the Director of Corporate Credit at AAM with 19 years of investment experience. She joined the firm in 2002. Elizabeth graduated with Honors and Distinction from Indiana University with a BS in Finance and earned an MBA in Finance, Analytical Consulting and Marketing from Northwestern University’s Kellogg School of Management.


For more information about AAM or any of the information in the Corporate Credit View, please contact:

Colin T. Dowdall, CFA, Director of Marketing and Business Development
colin.dowdall@aamcompany.com

John J. Olvany, Vice President of Business Development
john.olvany@aamcompany.com

Neelm Hameer, Vice President of Business Development
neelm.hameer@aamcompany.com

logo


Disclaimer: Asset Allocation & Management Company, LLC (AAM) is an investment adviser registered with the Securities and Exchange Commission, specializing in fixed-income asset management services for insurance companies. This information was developed using publicly available information, internally developed data and outside sources believed to be reliable. While all reasonable care has been taken to ensure that the facts stated and the opinions given are accurate, complete and reasonable, liability is expressly disclaimed by AAM and any affiliates (collectively known as “AAM”), and their representative officers and employees. This report has been prepared for informational purposes only and does not purport to represent a complete analysis of any security, company or industry discussed. Any opinions and/or recommendations expressed are subject to change without notice and should be considered only as part of a diversified portfolio. A complete list of investment recommendations made during the past year is available upon request. Past performance is not an indication of future returns.This information is distributed to recipients including AAM, any of which may have acted on the basis of the information, or may have an ownership interest in securities to which the information relates. It may also be distributed to clients of AAM, as well as to other recipients with whom no such client relationship exists. Providing this information does not, in and of itself, constitute a recommendation by AAM, nor does it imply that the purchase or sale of any security is suitable for the recipient. Investing in the bond market is subject to certain risks including market, interest-rate, issuer, credit, inflation, liquidity, valuation, volatility, prepayment and extension. No part of this material may be reproduced in any form, or referred to in any other publication, without express written permission.

August 25, 2016 by

Municipals performed very well during the quarter, as the sector continued to follow closely behind the strong performance in Treasuries. Treasury yields overall were lower by 30 basis points (bps) during the quarter. Most of the move was attributed to the flight-to-quality rally that followed Britain’s decision to exit the European Union. Municipal performance was even stronger, with 10yr rates falling by 35 bps during the quarter.

The strong demand for municipals remained in place in the face of potential headline risk from the credit events surrounding Puerto Rico. As expected, on July 1st, the Commonwealth defaulted on approximately $800 million in debt service payments on its general obligation debt, preferring instead to make payments due to its employees. The Governor declared a moratorium on the island’s debt a day after the President signed into law the Puerto Rico Oversight, Management, and Economic Stability Act (PROMESA). The legislation creates a federal seven-member control board, which will have broad fiscal management oversight powers and the authority to restructure the debt of the Commonwealth. Passage of this legislation was seen as the first important step towards putting the island on a path toward fiscal recovery; however, there are some market concerns that the law does not provide any economic stimulus initiatives to improve revenues going forward. Market prices were generally up after passage of PROMESA and prices since the default are generally unchanged, as the market fully expected the Governor to declare the moratorium.

The overall muni market also saw very little reaction to the Puerto Rico headlines. The sector has generally been consumed by a build in momentum of technical imbalances heading into the summer months. Collectively, June and July experiences the heaviest reinvestment flows of the year resulting from coupons/calls/maturities, while new issue supply was expected to plunge 25% in July from June’s $44 billion in issuance. With seemingly few challenges to curtail demand in the near term, these improving technicals should provide solid relative performance versus taxable alternatives for the 3rd quarter. Even with yields hovering near record low levels, tax-exempt investors have remained consistently engaged all year. Mutual fund flows through July 6th have experienced 40 consecutive weeks of inflows and a year-to-date weekly average of $1.25 billion. With expectations that the Federal Reserve will likely slow the pace of normalizing rates, these fund flows are expected to continue to support the market over the balance of the year.

Although the trend in demand appears to be very supportive for strong relative performance over the 2nd half of the year, a heavier-than-expected new issuance cycle could pose some potential headwinds. In the near term, supply technicals appear to be favorable. After the market produced $119 billion in supply during the 2nd quarter, the market should see a 20% drop in the 3rd quarter, which would be consistent with long-term historical trends. However, today’s near record low yield environment has created very compelling refinancing opportunities for municipalities. Low absolute yields, combined with the flattening in the slope of the muni yield curve, have now increased the universe of outstanding deals that could be refinanced going forward. At the beginning of the 2nd quarter, the only deals that provided compelling refinancing opportunities were debt structured with call features of 3 years or shorter. With the muni yield curve flattening by 58bps since April 1st and high-grade rates starting the 3rd quarter at 1.35% in 10 years, older deals with calls as long as 5 to 7yrs now provide enough in debt service savings to be considered for refinancing. If rates remain near current levels, we expect to see this potential increase in refinancings enter the market late in the 3rd quarter at a time when demand techincals move to much weaker levels on October 1st and November 1st. Consequently, we are moving to a neutral bias for the sector and awaiting opportunities to build exposure to the sector on any potential market dislocations that develop late in the 3rd quarter.

Written by:

GregoryABell

Gregory Bell, CFA, CPA
Director of Municipal Bonds

Disclaimer: Asset Allocation & Management Company, LLC (AAM) is an investment adviser registered with the Securities and Exchange Commission, specializing in fixed-income asset management services for insurance companies. This information was developed using publicly available information, internally developed data and outside sources believed to be reliable. While all reasonable care has been taken to ensure that the facts stated and the opinions given are accurate, complete and reasonable, liability is expressly disclaimed by AAM and any affiliates (collectively known as “AAM”), and their representative officers and employees. This report has been prepared for informational purposes only and does not purport to represent a complete analysis of any security, company or industry discussed. Any opinions and/or recommendations expressed are subject to change without notice and should be considered only as part of a diversified portfolio. A complete list of investment recommendations made during the past year is available upon request. Past performance is not an indication of future returns.This information is distributed to recipients including AAM, any of which may have acted on the basis of the information, or may have an ownership interest in securities to which the information relates. It may also be distributed to clients of AAM, as well as to other recipients with whom no such client relationship exists. Providing this information does not, in and of itself, constitute a recommendation by AAM, nor does it imply that the purchase or sale of any security is suitable for the recipient. Investing in the bond market is subject to certain risks including market, interest-rate, issuer, credit, inflation, liquidity, valuation, volatility, prepayment and extension. No part of this material may be reproduced in any form, or referred to in any other publication, without express written permission.

August 2, 2016 by

Within the investment grade fixed income market, there are four primary ways to enhance return: credit quality, liquidity, duration, or structure.  All of these strategies introduce additional risk to the insurer’s balance sheet. We believe that there is one more lever for a taxable P&C insurer to pull, the crossover trade between taxable and tax-exempt securities.  This trade does not involve adding incremental risk to the organization, rather it involves closely watching the spread relationship between taxable and tax-exempt securities, to exploit the opportunity as it presents itself.

Why an opportunistic strategy emphasizing average life, structure and liquidity is optimal.

Let’s begin by stating the obvious – the tax exempt municipal bond sector is illiquid and concentrated in high quality issues. From Exhibit 1 below, there are 49,372 issues in the Barclays’ Municipal Bond Index with a market value of $1.43 trillion.Muni Paper Exhibit 1

By comparison, there are 5,735 issues in the Barclays’ Corporate Index with a market value of $4.91 trillion as outlined in Exhibit 2. Thus, the Corporate Index has 11.6% of the number of issues and 3.4 times the market value of the Municipal Index.

Muni Paper Exhibit 2

Also note that the Barclays’ Municipal Index (by market value) contains 26% and 6% of ‘A’ and ‘BAA’ rated issues, respectively.  By contrast, the Barclays’ Corporate Index contains 39% and 53% of ‘A’ and ‘BAA’ rated issues. To put the market value of the ‘A’ rated municipal bonds into perspective, it is slightly less than the market value of Exxon Mobil common stock.

To summarize, constructing diversified municipal bond portfolios with a down-in-credit, yield-oriented focus involves investing in a small corner of an illiquid municipal bond market. The constraints of the investable municipal universe preclude any ability to scale across a large asset base.

A Scalable Alternative

Taxable insurance companies seek to optimize after-tax yield and total return opportunities across the yield curve within the duration, quality and other constraints of their policy statement.  As outlined in Exhibit 3 below, the relative attractiveness of tax exempt municipal bond yields (relative to comparable maturity Treasury issues) varies greatly across the yield curve. Using seven year weekly averages, the yield spread advantage (pre-tax equivalent yield for insurance companies) of ten year municipal bonds is 86 basis points greater than in three year bonds. In addition, the range of yield spreads is far greater in the ten year area.

At AAM, we track spread relationships and Z scores on a daily basis. A trading strategy that involves purchasing ten year tax exempt municipal bonds when spreads (versus Treasury notes) are at a Z score of +2.0 and selling at -2.0 produced five round-trip opportunities for purchase and sale over the past seven years. Because both the average yield change and duration are much greater for the ten year municipal bond in comparison with the three year issue, the total return opportunity from the trading strategy is greater in the ten year part of the yield curve and produces a return advantage of 18.99% over the seven year period (2.51% on an annualized basis). Please see Exhibit 3 and the footnotes below for details.

Muni Paper Exhibit 3

One additional comment should be made about three year municipal bond yields. With an average spread over a three year Treasury bond of only 33 BP (based on seven years of data), there are much higher yielding opportunities in the taxable bond market. Thus, short municipal bonds should be viewed as a source of funds for yield enhancement opportunities in other taxable bond sectors.

A high quality approach leads to a stable credit profile

As of July 15, 2016 per Thomson Reuters, the average yield spread between ‘A’ and ‘AA’ rated tax exempt ten year municipal bonds is 29 basis points (114 basis points over the yield of a ten year U.S. Treasury bond). This yield differential is at the very narrow end of the range over the past 7 years and was as much as 106 basis points in July 2009.  A comparison of the 29 basis point yield advantage of ‘A’ rated issues (which will more likely be part of a buy and hold strategy due to the illiquidity of ‘A’ rated bonds) with the annualized total return from the trading strategy of 2.51% annually highlights why an opportunistic trading strategy is superior.

At AAM, we believe it is critically important to analyze relative value at each and every point along the yield curve.

An opportunistic trading strategy requires investing in liquid bonds, which generally leads to high quality credits.  Maintaining liquidity in municipal portfolios also requires a focus on coupon to avoid the negative tax consequences from a municipal bond trading at a discount price.  Lastly, liquidity and tradability are enhanced by avoiding certain call structures.

To be clear, there are select ‘A’ rated issuers that offer value.  But in our view, the opportunistic trading strategy that we have outlined is a better and more sustainable investment framework for managing taxable insurance company portfolios.

An important  consideration is that the ability to trade fixed income securities is challenged in today’s market.  This is especially  the case for tax exempt municipal bonds.  Investors looking to employ an opportunistic trading strategy must be large enough to fully participate in the primary market.  Conversely, investors must be small enough to meaningfully execute purchase and sale programs within the narrow time windows when these opportunities are available.  Due to these constraints, large municipal bond managers will likely have difficulty employing an opportunistic strategy.

We’ve discussed relative trading opportunities in tax exempt municipals, but it is important to point out that


Characteristics of An Opportunistic Trading Strategy

1. Focus on liquidity:  Liquidity allows for the portfolio to be repositioned without significant transaction costs.

2. Focus on 10 year durations: The ten year part of the yield curve provides the better total return opportunity.

3. Focus on high quality credits:  An opportunistic trading strategy requires investing in liquid bonds, generally leading to high quality credits.

insurance companies have other reasons to sell tax exempt bonds. With all credits, avoiding downgrades and impairment are critical factors for successful investing.

A high quality approach leads to a stable credit profile. This is very important in the municipal market as the availability of financial information is generally on an annual basis with a lag. In addition, the ability to fully benefit from the tax exemption of municipal income depends on underwriting profitability, which is subject to change based on each company’s underwriting experience. Maintaining a highly liquid municipal portfolio enables a company to reposition its portfolio without significant transaction costs (bid-offer spreads) when its tax situation changes.


Footnotes
The calculations are based on weekly yields from Thomson Reuters and Bloomberg over the seven year period ending July 15, 2016 using a 1.4577 tax adjustment factor on municipal yields to reflect the pre-tax equivalent yield of municipal bonds for insurance companies. This pre-tax equivalent yield on a ten year municipal bond is compared to comparable maturity Treasury yields to determine the yield spread. The standard deviation and range are also calculated from this relationship.
The Z score is calculated on a one year trailing basis using the pre-tax equivalent yield spread relationships outlined in (1) above.
The number of ‘round trips of going from -2.0 to +2.0 Z scores over this period and vice versa. This captures the number of round trip trading opportunities at extreme valuations.
The pre-tax return advantage from relative bond price movements versus comparable maturity Treasury notes over a seven year period is calculated by taking the nominal yield movements from purchases and sales when the municipal bond yield Z score is +2.0 and -2.0, respectively and calculating a price move based on the duration of three and ten year municipal bonds. The cumulative seven year number is annualized.

Written by:

GregoryABell
Gregory Bell, CFA
Director of Municipal Bonds, Principal

Joseph Borgmann
John Schaefer, CFA
President, Principal

Additional Contributor:
Daniel Nagode

Disclaimer: Asset Allocation & Management Company, LLC (AAM) is an investment adviser registered with the Securities and Exchange Commission, specializing in fixed-income asset management services for insurance companies. This information was developed using publicly available information, internally developed data and outside sources believed to be reliable. While all reasonable care has been taken to ensure that the facts stated and the opinions given are accurate, complete and reasonable, liability is expressly disclaimed by AAM and any affiliates (collectively known as “AAM”), and their representative officers and employees. This report has been prepared for informational purposes only and does not purport to represent a complete analysis of any security, company or industry discussed. Any opinions and/or recommendations expressed are subject to change without notice and should be considered only as part of a diversified portfolio. A complete list of investment recommendations made during the past year is available upon request. Past performance is not an indication of future returns.
This information is distributed to recipients including AAM, any of which may have acted on the basis of the information, or may have an ownership interest in securities to which the information relates. It may also be distributed to clients of AAM, as well as to other recipients with whom no such client relationship exists. Providing this information does not, in and of itself, constitute a recommendation by AAM, nor does it imply that the purchase or sale of any security is suitable for the recipient. Investing in the bond market is subject to certain risks including market, interest-rate, issuer, credit, inflation, liquidity, valuation, volatility, prepayment and extension. No part of this material may be reproduced in any form, or referred to in any other publication, without express written permission

March 10, 2016 by

The Bank sector has experienced a reversal of its strong relative performance vs. the Corporate Index during the first quarter of 2016.  In this white paper, AAM’s bank analyst examines the drivers of performance in the sector and looks at trades that have outperformed during the recent volatility.


In fiscal year 2015, the Bank sector was one of the best performing subsectors of the Barclays Capital U.S. Corporate Investment Grade Index (“the Index”), reflecting strong capital, improving asset quality and expectations of an impending rate hike cycle.

This trend reversed abruptly in the first two months of 2016 with banks participating in the sharp acceleration of negative excess returns in the Index. As of February month end, the bank sector had generated year-to-date negative excess returns of -227 basis points (bps) as compared to -248 bps for the Index. While broad corporate bond performance has retraced some of this performance in March, the bank sector has actually lagged the overall Index, having generated 40 bps of positive excess returns month-to-date vs. 94 bps for the Index.

However, a more granular examination of the performance in the bank sector better illustrates what trades have helped or hurt performance in the space. If we break out performance of senior bank bonds vs. subordinated bonds (the latter representing the riskier portion of the bank capital structure), it quickly becomes clear that the bulk of the negative excess returns were driven by the subordinated bonds (-498 bps through February). In contrast, senior bank bonds actually outperformed the Index with negative excess returns of -163 bps through February (Exhibit 1).

Exhibit 1:

GBR1

          Source: Barclays, AAM

Additionally, the performance in the bank sector has been depressed by the non-domestic (Yankee) banks (-203 bps excess returns YTD for Yankee banks vs. -186 bps for banks overall). The negative performance in Yankee banks was driven in particular by the sharp sell-off in European banks in February as fears about capital adequacy and the ability to continue paying coupons on capital securities were sparked by poor financial results and diminished return on equity prospects for several of the continent’s largest banks (Deutsche Bank, Credit Suisse and Unicredit were all subject to material sell-offs).

Anecdotally, many total return managers were also hurt by their overweighting of Additional Tier 1 /Contingent Convertible (CoCo) securities, which represents an investment in the most junior layer of the bank capital structure. While CoCos are not included in the Index (because they are generally not investment grade rated), they generated very strong performance in fiscal year 2015 (+6.3% total return), and were a top recommendation of most sell-side credit strategists heading into 2016. However, through February AT1/CoCos delivered a -8.6% total return as fears about coupon sustainability grew.

So how is AAM positioned within the bank space?

We have been overweight the bank sector since mid-2009 based on improving fundamentals and an increasingly benign economic outlook. However, within the bank sector we have retained a strong preference for senior vs. subordinated bonds, reflecting a preference for downside protection and a desire for clarity on Total Loss Absorbing Capacity/Capital (TLAC) rules. We have also increasingly weighted regional and community banks vs. universal banks, reflecting the potential for increased issuance by universal banks to meet TLAC minimum debt requirements, as well as our view that the traditional banking model of the regional space was likely to have better fundamental momentum in a slow growth environment and less residual regulatory liability.

Finally, we have been underweight Yankee banks, and particularly European banks, since macro-political instability in Greece, Italy and Spain sparked the European sovereign crisis in 2011. Although fears of a Euro or EU break-up have receded somewhat, we have remained underweight as we feel the underlying causes of that crisis (lack of political consensus and stagnant economic growth) remain unresolved. Additionally, we view the European universal banks as having a much greater restructuring burden with regard to meeting TLAC requirements as compared to the U.S. universal banks.

While our underweight to subordinated debt and Yankee banks constrained investment performance during 2014 and 2015, the benefits of this credit selection can be seen in the downside protection in periods such as the first quarter of 2016. Conversely, we began selectively investing in subordinated bank debt of the U.S. universal banks in late February, as we felt that the spread widening over the previous two months had made certain credits attractive given our fundamental outlook (Exhibit 2).

Exhibit 2:

GBR2

Source: Barclays, AAM

Written by:
NSebastianBacchus
N. Sebastian Bacchus, CFA
Senior Analyst, Corporate Credit


For more information, contact:

Colin T. Dowdall, CFA
Director of Marketing and Business Development
colin.dowdall@aamcompany.com

John Olvany
Vice President of Business Development
john.olvany@aamcompany.com

Neelm Hameer
Vice President of Business Development
neelm.hameer@aamcompany.com

  • « Go to Previous Page
  • Page 1
  • Interim pages omitted …
  • Page 3
  • Page 4
  • Page 5
  • Page 6
  • Page 7
  • Interim pages omitted …
  • Page 9
  • Go to Next Page »

Get updates in your inbox.

  • Investment Strategies
    • Investment Grade Fixed Income
    • Specialty Asset Classes
  • Our Clients
    • Client Experience
    • Sample RFP Download
  • Insights
    • Video
    • Webinar
    • News
    • Podcasts
  • About
    • Our Team
    • Contact
    • Client Login

Disclaimer: Asset Allocation & Management Company, LLC (AAM) is an investment adviser registered with the Securities and Exchange Commission, specializing in fixed-income asset management services for insurance companies. Registration does not imply a certain level of skill or training. This information was developed using publicly available information, internally developed data and outside sources believed to be reliable. While all reasonable care has been taken to ensure that the facts stated and the opinions given are accurate, complete and reasonable, liability is expressly disclaimed by AAM and any affiliates (collectively known as “AAM”), and their representative officers and employees. This report has been prepared for informational purposes only and does not purport to represent a complete analysis of any security, company or industry discussed. Any opinions and/or recommendations expressed are subject to change without notice and should be considered only as part of a diversified portfolio. A complete list of investment recommendations made during the past year is available upon request. Past performance is not an indication of future returns. This information is distributed to recipients including AAM, any of which may have acted on the basis of the information, or may have an ownership interest in securities to which the information relates. It may also be distributed to clients of AAM, as well as to other recipients with whom no such client relationship exists. Providing this information does not, in and of itself, constitute a recommendation by AAM, nor does it imply that the purchase or sale of any security is suitable for the recipient. Investing in the bond market is subject to certain risks including market, interest-rate, issuer, credit, inflation, liquidity, valuation, volatility, prepayment and extension. No part of this material may be reproduced in any form, or referred to in any other publication, without express written permission. *All figures shown are approximate and subject to change from quarter to quarter. **The accolades and awards highlighted herein are not statements of any advisory client and do not describe any experience with or endorsement of AAM as an investment adviser by any such client.

Copyright © 2024 AAM | Privacy and Disclosures

  • LinkedIn
  • YouTube