• Skip to primary navigation
  • Skip to main content
  • Skip to footer
AAM CompanyTransparent Logo

AAM Company

AAM Company Website

  • Investment Strategies
    • Investment Grade Fixed Income
    • Specialty Asset Classes
  • Clients
    • Our Clients
    • Client Experience
    • Download Sample RFP
  • Insights
    • Video
    • Webinars
    • Podcasts
    • News
  • About
    • Our Team
    • Events
  • Login
  • Contact Us
Contact

Sector Commentary

February 18, 2016 by

We believe investors should be aware of distressed exchanges given the increased number of fallen angels in the energy space and the negative influence that this liability management tool is having on bond prices and the high yield sector. In the following pages, we detail how an exchange typically takes place and why they are becoming more prevalent. We also provide a list of items that investors must consider when evaluating an exchange offer, review how the exchanges are influencing the high yield market, and review past exchanges. Unfortunately, there is no template for investors to use when deciding to exchange or not. Each exchange is unique, and a careful evaluation of many factors is necessary. This opinion is supported by the ultimate success of an exchange, which is slightly greater than 50/50 according to a New York University study1.


Distressed Debt Exchange Description

 In a distressed debt exchange (DDE), a company proposes that existing debt holders take a haircut on their principal amount in exchange for moving up in payment priority in the form of secured debt. Generally, a distressed exchange is proposed by a company to avoid a bankruptcy, improve liquidity, reduce debt, manage its maturity dates (by exchanging debt securities that are coming due for debt securities with an extended maturity) and to reduce or eliminate onerous covenants.

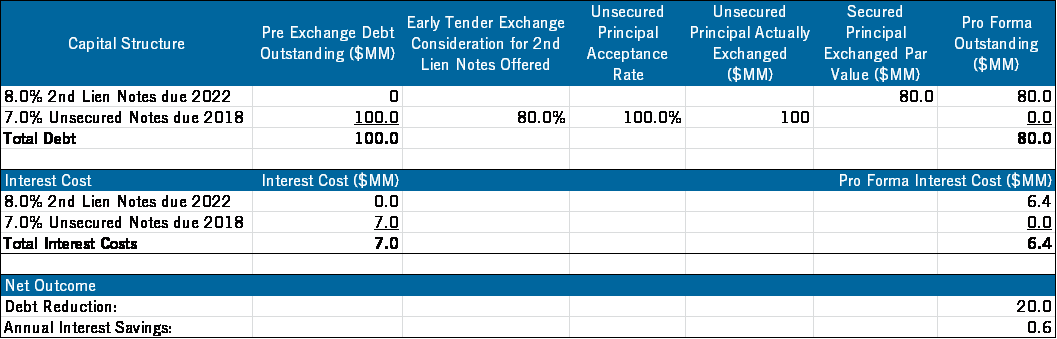
For example, XYZ Company has $100 million principal of 7.0% senior unsecured bonds due June 30, 2018. Due to market conditions, these distressed bonds are trading for $30, yielding 66% with a par value of $100. The company has little liquidity and external capital options are limited, so refinancing or repaying this upcoming maturity is doubtful. In order to avoid a costly bankruptcy, XYZ may offer to its bond holders the chance to exchange 100% of its 7.0% senior unsecured bonds maturing in 2018 for 80% of the original principal for new, 8% secured second lien debt maturing June 30, 2022. The new second lien debt will be issued at $50; yielding 25% based on peer trading levels and have a par value of $100. If all $100 million of principal is exchanged, the issuer will have eliminated the need to refinance in the near term (from 2018 to 2022), delayed a bankruptcy, reduced debt by $20 million (from $100 million to $80 million, also known as a Cancellation of Debt), and reduced annual interest expense by $0.6 million ($100 million x 7% – $80 million x 8%). Investors will forgo $20 million of principal, but will move to a secured position in the capital structure and see the price of its holding increase to $50 from $30. A secured position offers higher recovery values relative to an unsecured position if the company were to ultimately file for bankruptcy (See Exhibit 1).

Exhibit 1:
DD - Ex 1
Source: AAM

The rating agencies play a role in DDEs as well. Based on their respective methodologies, if the exchange is viewed as effectively allowing the issuer to avoid bankruptcy or payment default, the rating agencies will take action to reflect the loss expected to be incurred by participating debt holders (e.g., Caa3, Ca, or C, using Moody’s scale). Otherwise, the agency will view it to be an opportunistic refinancing. Moody’s explains that often, the rating of the issuer is the determining factor of whether or not it is opportunistic. Debt exchanges from issuers rated B1 and higher are typically deemed as opportunistic refinancings vs. those rated Caa1 being viewed as distressed exchanges. This likely causes companies to pull forward the timing of the DDE, so the downgrade is less onerous.

Why are They Being Discussed Now?

DDEs are not new and have been used for decades. They have become more common in the last year following the surge in distressed energy companies. In fact, we are aware of at least a dozen energy companies that have employed this tactic since the beginning of 2015. Upon the completion of a DDE, the issuer will likely have reduced total debt and interest expense without using cash, thereby improving its credit profile modestly.

Reduced cash flows combined with inflated capital structures have contributed to an increase in liability management as a tool to delay or prevent a costly Chapter 11 default. In the Energy sector, lower commodity prices reduce companies’ borrowing bases, since banks use frequently updated asset values based on discounted cash flow analysis to determine borrowing-base availability. These updates, which generally occur every six months, are known as redeterminations. Exploration and Production (E&P) companies with unhedged production volumes leave themselves entirely exposed to low commodity prices, and risk significant borrowing-base reductions when the redetermination takes place. Banks generally give E&P companies some time to improve their liquidity, rather than take over the E&P assets themselves, but will take action if necessary.

Additionally, there are tax reasons for the increased use of this tool. Historically, if companies repurchased bonds at a discount, the difference between the par amount and the purchase price was a gain and taxed accordingly, significantly offsetting the benefits of the exchange. However, this changed in 2009 when the American Reinvestment and Recovery Act allowed deferral of most cancellation of debt (COD) income for five years and then allowed amortization of that COD over a five year period. Presently, section 108(a) of the Tax Code provides that in insolvency and bankruptcy the COD income is permanently excluded from taxation.

Evaluating a DDE Offer

When faced with a DDE offer, an investor must first determine the probability of default. Analyzing the issuer’s existing liquidity and the amount of time that the company can operate in the existing stressed environment should provide direction on whether or not a default is likely in the near term. If the investor is confident that a bankruptcy is unlikely and the issuer is simply attempting to take advantage of market conditions to reduce leverage via an exchange, then declining the exchange is the best course of action.

If a bankruptcy is more likely, investors should closely analyze and stress the company’s cash flows and multiples to determine a reasonable amount of debt that the company could support and receive court approval to emerge from Chapter 11. If the restructured company will only be able to support the amount of senior secured debt being offered as part of the exchange, then accepting an exchange offer should be strongly considered.

DDEs are usually voluntary and some holders of the debt may not exchange, which presents a holdout issue that investors must consider when deciding whether or not to accept the exchange offer. Importantly, debt exchange offers may be conditioned on the tender of a high percentage (e.g., 90% or more) of the debt sought in the offer. Such a minimum condition can provide comfort to holders who may otherwise be wary of exchanging debt securities at a discount if other holders who do not participate will reap the economic benefits of the exchange (i.e., the borrower’s improved balance sheet and ability to pay debts) without the cost. A minimum condition provides assurance that there will be, at most, a limited number of such free riders. Additionally, debt exchange offers can be structured to include various incentives such as secured debt and early tender premiums to holders to participate. Moreover, debt exchange offers can be combined with consent solicitations that propose, through an indenture amendment, to strip covenants and other protections from the debt sought in the exchange offer.

Another item to evaluate when considering an exchange is the influence of credit default swaps (CDS) owners on the issuer. Holdouts and the acceptance rate of the exchange will certainly be affected by those investors who own CDS. Bondholders that buy protection under CDS will be incentivized to force the issuer into bankruptcy in order to collect under their CDS contracts and therefore will likely not participate in efforts by the issuer to improve liquidity, extend maturities or reduce debt. The problem is increased if an issuer requires a high acceptance rate in order to make the debt exchange offer economically viable.

A final consideration in the exchange decision is estimating what liquidity there will be for the non-exchanged unsecured bonds. A significantly reduced total issue size will reduce liquidity of that issue, negatively affecting prices and likely incentivize holders to exchange. However, this concern is somewhat mitigated for holders of debt maturing prior to the secured notes offered as part of the exchange. The logic is that the improved credit profile of the issuer subsequent to the exchange could actually improve the likelihood that the original debt will be repaid. It will obviously mature first and the total funds required to repay or refinance the original debt that remains outstanding will be reduced significantly due to the exchange.

Influence on Today’s Market

We believe the threat of more DDEs with potentially new senior secured debt has contributed to rapidly declining prices in the high yield energy market (Exhibit 2) for two reasons. The first result of this potential threat is an increase in the number of sellers of any issuer that has capacity to take on senior secured debt, regardless of whether or not there is an impending need for liquidity or solvency issue. The second result is that there are few investors willing to buy unsecured debt given the lack of confidence in the future capital structure of the investment. We believe this environment will persist until unsecured investors involved in exchanges demand more favorable terms, issuers provide assurances that there is no need for an exchange in the foreseeable future, and/or macroeconomic conditions improve.

Exhibit 2: High Yield Energy Yield to Worst

DD - Ex 2
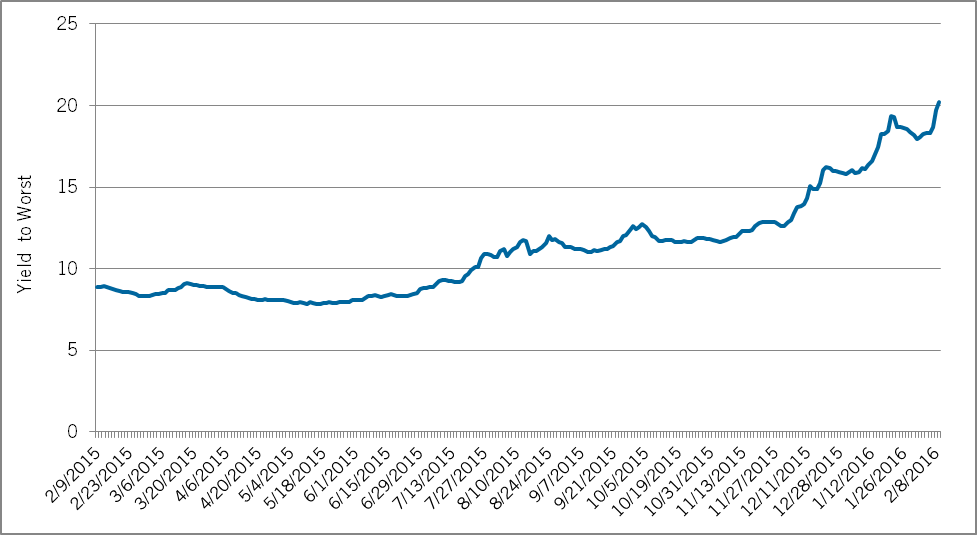
Source: Bank of America Merrill Lynch High Yield Energy Index (HOEN)

Evaluation of DDEs

We believe that the success of a distressed exchange should be viewed from the perspectives of the original investor, the distressed investor and the issuer. It is too early to determine the outcome of the exchanges from the investors’ perspectives in the recent energy related transactions. However, it appears as though those companies have merely delayed the inevitable default at this point, which probably favors those investors that accepted the exchange offer.

If a DDE is eventually followed by a bankruptcy, the restructuring efforts could be characterized as unsuccessful. However, we believe that the exchanges have achieved several of the companies’ goals. The exchanges have in fact partially extended near term maturities, reduced total debt and interest expense, allowing the companies to postpone a costly default in hopes of a recovery in the operating environment.

Studies of the outcomes of previous exchanges have to be viewed cautiously because few such transactions have taken place. Out of 57 DDEs to take place from 1984- 2008, 26 (46%) were followed by a bankruptcy filing (20 Chapter 11 reorganizations and six Chapter 7 liquidations), seventeen (30%) firms were eventually acquired, while 11 (24%) were still operating in 2009 (Exhibit 3). Additionally, the recovery rate of the exchanged debt that eventually defaulted was 52%, whereas, the recovery rate for the 875 non-DDE defaults in that same period was 42%.

Exhibit 3: Subsequent Development of Distressed Exchanges (1984 – 2007)

DD - Ex 3   
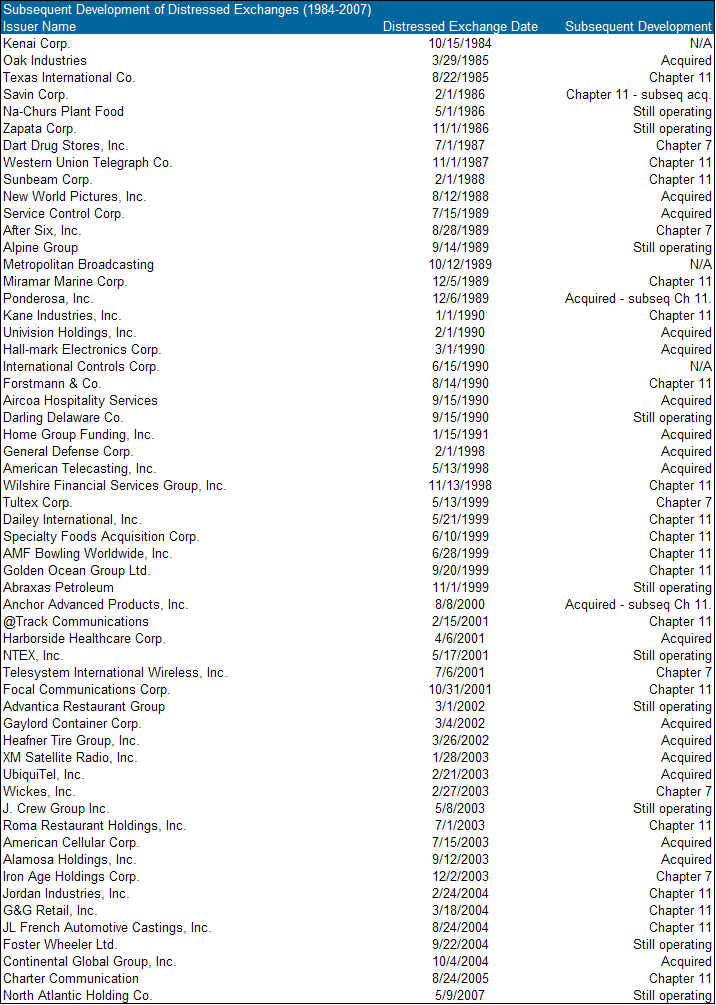
Source: The Reemergence of Distressed Exchanges in Corporate Restructurings  (2009), AAM

Conclusion

Market participants believe debt exchanges are going to accelerate in the upcoming year as distressed energy companies attempt to reduce debt, improve liquidity, and delay a costly bankruptcy. Other companies may seek to take advantage of the weak environment and offer an exchange despite not having a liquidity or solvency issue in the near term. We have outlined several critical factors to analyze when deciding to accept an exchange offer or decline. We believe this knowledge prepares us to make disciplined investment decisions in the event we are faced with deciding against an exchange offer or accepting less than the original promised principal.

Written by:

PatrickJMcGeever
Patrick McGeever
Senior Analyst Corporate Credit


1 Edward I. Altman and Brenda Karlin, “The Reemergence of Distressed Exchanges in Corporate Restructurings,” (March 2009) accessed February 11, 2016, https://people.stern.nyu.edu/ealtman/Reemergence%20of%20Distressed%20Exchanges.pdf
2 Edward I. Altman and Brenda Karlin, “The Reemergence of Distressed Exchanges in Corporate Restructurings,” (March 2009)
Lenny Aizenman et al., “Distressed Exchanges: Implications for Probability of Default Ratings, Corporate Family Ratings and Debt Instrument Ratings,” Moody’s Global Corporate Finance, (March 2009)
3 Ze’-ev D. Eiger et al., Liability Management Handbook 2015 Update, International Financial Law Review, 82, accessed February 11, 2016, https://media.mofo.com/files/Uploads/Images/MofoLiabMan.pdf
4 “Debt Exchange Offers in the Current Market,” The Bankruptcy Strategist, Law Journal Newsletters, Volume 26, Number 9 (July 2009)
5 “Debt Exchange Offers: Legal Strategies for Distressed Issuers – Navigating Complex Securities Laws When Restructuring Convertible Debt Securities,” 7, (April 15, 2010). Accessed February 11, 2016, https://media.straffordpub.com/products/debt-exchange-offers-legal-strategies-for-distressed-issuers-2010-04-15/presentation.pdf
6 Edward I. Altman and Brenda Karlin, “The Reemergence of Distressed Exchanges in Corporate Restructurings,” (March 2009) 


For more information, contact:

Colin T. Dowdall, CFA
Director of Marketing and Business Development
colin.dowdall@aamcompany.com

John Olvany
Vice President of Business Development
john.olvany@aamcompany.com

Neelm Hameer
Vice President of Business Development
neelm.hameer@aamcompany.com


Disclaimer: Asset Allocation & Management Company, LLC (AAM) is an investment adviser registered with the Securities and Exchange Commission, specializing in fixed-income asset management services for insurance companies. This information was developed using publicly available information, internally developed data and outside sources believed to be reliable. While all reasonable care has been taken to ensure that the facts stated and the opinions given are accurate, complete and reasonable, liability is expressly disclaimed by AAM and any affiliates (collectively known as “AAM”), and their representative officers and employees. This report has been prepared for informational purposes only and does not purport to represent a complete analysis of any security, company or industry discussed. Any opinions and/or recommendations expressed are subject to change without notice and should be considered only as part of a diversified portfolio. A complete list of investment recommendations made during the past year is available upon request. Past performance is not an indication of future returns.

This information is distributed to recipients including AAM, any of which may have acted on the basis of the information, or may have an ownership interest in securities to which the information relates. It may also be distributed to clients of AAM, as well as to other recipients with whom no such client relationship exists. Providing this information does not, in and of itself, constitute a recommendation by AAM, nor does it imply that the purchase or sale of any security is suitable for the recipient. Investing in the bond market is subject to certain risks including market, interest-rate, issuer, credit, inflation, liquidity, valuation, volatility, prepayment and extension. No part of this material may be reproduced in any form, or referred to in any other publication, without express written permission.

November 19, 2015 by


Hoverboards and Michael Jordan shoes. I can’t get through a conversation with my kids without one or both of these topics coming up. I have to admit, being a huge Back to the Future fan and growing up in Chicago during the Bull’s domination of the 90’s, I am excited about this holiday season. This is always a very important time of year for the retailers, as up to 40% of annual revenues are realized during this season. Based on our figures from the U.S. Census Bureau (retail, excluding auto and gas), retail sales for 2014 were up 4.4%. We believe that retail sales for this year will be up between 3.25% and 3.75%. The following report explores some of the more important drivers of our analysis.


The Consumer is Strong

We believe the most important driver of retail sales is the strength of the consumer. The following table summarizes our analysis of nine different factors which drive the willingness to spend. We make an assessment of the individual factors in terms of how we think they may impact future spending.

Source: AAM Note: Highlight notes a change from 2014.
Source: AAM
Note: Highlight notes a change from 2014.

The overall picture is about the same as last year.  Positive developments include falling gas prices and stronger consumer confidence data.  Home prices and sales look steady and we continue to see more spending on home improvement.  Homeowners spend more aggressively when their homes transition to an investment from a cost.  Stagnant income growth coupled with rising personal debt could impact spending. Currently, credit card performance has been solid, so we would not expect rising credit card balances to slow spending.  In addition, GDP in the U.S. remains volatile throughout the year with expectations to flat line through 2017, signifying a pretty benign economic environment.

Big Ticket Item Spend Could Slow Holiday Shopping

Once again, a significant amount of consumer spending this year has been on big ticket items, including new cars and home appliances.  The fear is that spending on these sorts of items could impact holiday season shopping for various discretionary items.  Auto sales continue to consistently come in higher than expected with the last two months above a SAAR (Seasonally Adjusted Annual Rate) of 18 million, which hasn’t happened in more than 10 years.  Most analysts point to easy access of funding and attractive incentives to explain this sort of growth.  In addition, there are also secular trends driving demand including the increasing age of used cars and number of cars owned per household.  Years of pent up demand from curtailed spending, high average appliance age (approximately 10 years), an improved housing picture, and a better job environment are giving consumers greater confidence to spend on their homes.  We continue to see strong buying in the large appliance sector.

We took a closer look at the history of auto sales and potential impact on consumer spending.  To do this, we used information from the monthly retail trade data completed by the U.S. Census Bureau.  We segmented the Motor Vehicle & Parts Dealers portion of spending and compared it to retail spending (Exhibit 2).  What we observe is that retail spending (not including autos) is growing faster than auto spending.  The green line is the ratio of auto versus retail spending. That ratio has been growing and is currently at 36%, well below the maximum of 48%.  Based on this information, it appears there is still opportunity for auto sales to grow without impacting retail spending.

Source: U.S. Census Bureau, data as of 11/02/2015

Big ticket items include technology as well.  This year, there are a number of new/innovative electronic devices available for the holiday.  These include the iPhone 6s, 4K Ultra TV’s, drones, fitness trackers, 3D printers, and connected home technology.  The Consumer Electronics Association expects tech spending this holiday to be up 2.3% to $34.2 billion.

Statistical Analysis – Predicting a Slow Down

Looking back on data over the last twenty two years reveals a significant correlation (81%) between “Back to School” retail sales (August and September) and “Holiday” sales (November and December). To complete this analysis, we used the U.S. Census Bureau’s monthly retail trade data, which includes a variety of retail businesses.  We exclude Motor Vehicle & Parts Dealers and Gasoline Stations from our analysis because sales in those segments have been more heavily impacted by factors outside the control of consumers.  In 2014, “Back to School” sales of 4.0% led to “Holiday” sales of 4.4%.  Our model predicts “Holiday” sales of 3.2% when using 3.0% for the “Back to School” sales observed in 2015. Holiday sales of 3.2% would be below the 23 year average of 4.2%.

Seasonal Hiring Looks Similar to Last Year

The National Retail Federation predicts that between 700,000 and 750,000 seasonal workers will be hired this year[note]Retail Employment and Seasonal Hiring. ”National Retail Federation, derived from Bureau of Labor data.https://nrf.com/resources/holiday-headquarters/retail-employment-and-seasonal-hiring, accessed November 17, 2015.[/note]. This compares to 714,000 hired last year and 765,000 hired in 2013.  Companies, including Macy’s, Kohl’s, and Walmart seem to be adding holiday staff in a somewhat conservative manner.  We continue to see hiring shifts to distribution warehouses which support online shopping.  E-commerce giant, Amazon is hiring 100,000 seasonal employees which is up significantly from 80,000 last year.  In addition, shipping giants FedEx and UPS are predicting a similar holiday season to 2014.  UPS expects to ship 10% more packages between Thanksgiving and New Year’s (3Q Earnings Transcript).  UPS expects their peak day to be December 22, when they expect to ship about 36 million packages, twice the normal amount in a day (3Q Earnings Transcript).

Higher Inventory Should Lead to Better Discounts

Technology working closely with demographic and social change has altered the way traditional retailers are selling/marketing their products.  One of the outcomes has been a much more efficient and better informed shopper.  Shoppers will continue to deal hunt, forcing retailers to sharpen their prices and start promoting earlier.  This year, we believe that retailers are in a less favorable inventory position versus last year.  We took a look at the inventory-to-sales spread (inventory – sales growth (year/year)) for a variety of retailers since 2013.  In a perfect world, we would want to see this at zero as inventory build keeps the same pace as sales.

A positive figure might result in price discounting by retailers, as they are stuck with too much inventory.  As shown in Exhibit 3, the average inventory-to-sales spread seems to have picked up somewhat since the second quarter of 2015.   While it is too early to determine the pace in the third quarter, so far, it looks as if inventories are up substantially, as sales have been disappointing.  Lower tourism and luxury spending seem to be a building theme in the locations that are geared toward higher income spenders.  The problem can be partly blamed on weaker emerging stock markets and a stronger U.S. dollar versus other currencies.

Source: Bloomberg
Source: Bloomberg

As a result, we expect retailers will need to be aggressive with discounts this season.  We expect retail margins to be somewhat stable as costs, especially commodities, have generally decreased.

Online Shopping Blazes Ahead – Department Stores Have a Big Opportunity

A solid e-commerce strategy has become a “must have” for all major retailers.  Even with the incredible advancements in this area, most shoppers still want to visit an actual store.  Retailers must continue to update their stores to remain relevant amongst a huge host of competition.  Omni-channel retailing has merged the inventory and distribution of physical stores with the online business.  In short, it has simplified and enhanced the entire buying process. According to the U.S. Census Bureau, e-commerce now accounts for 7.2% of total retail sales.  Year over year growth since 2010 has averaged 15% on a quarterly basis.  According to the National Retail Federation, the average shopper said that 46% of their shopping will be completed online[note]Retail Employment and Seasonal Hiring.”National Retail Federation, derived from Bureau of Labor data.https://nrf.com/resources/holiday-headquarters/retail-employment-and-seasonal-hiring, accessed November 17, 2015.[/note].  In addition, mobile devices are now much easier to use and play a bigger role in shopping for consumers.  One important outcome of e-commerce has been quicker delivery.  The much talked about Millennials are helping shape the evolution of retail.  It’s interesting to note that about 16% of this group expects to use the “same day delivery” option this holiday compared to just fewer than 8% for the rest of the population.

One area of particular interest is in the department store segment of retail.  This has been especially newsworthy given the very high profile e-commerce push at Walmart.  E-commerce is a big opportunity for large department store retailers given lower online penetration and slower same-store-sales growth at brick and mortar stores.  Exhibit 4 gives a good sense of the upside when compared to other retail segments.   One example of the growth opportunity is in the consumer electronics segment which doubled its online penetration to almost 24% in only four years[note]Steven Grambling, CFA, Alison Levens, Chistopher Prykull, CFA,. “Bricks and Click reboot: Adoption accelerates, margin trajectory grows murkier,” Goldman Sachs Equity Research – Americas: Retail: Broadlines, October 22, 2015 (6).[/note].

In general, we would expect margins to compress as a larger percentage of the business is moved online.  Also, capex spending would shift more towards e-commerce spending and less to net new builds.

Source: BEA, Comscore, eMarketer, Company Data, Goldman Sachs Global Investment Research

Trade Group Surveys Expect Lower Growth in 2015

We have included a summary of the four trade groups which publish their views on upcoming holiday sales (Exhibit 5). While each of them uses a different data set to base their expectations, the more important aspect is the change in growth year–over-year. In addition, we thought it would be interesting to look at how accurate each group has been over the past three years. The International Council of Shopping Centers (ICSC) seems to be the most accurate.

Source: Morgan Stanley, AAM

Weather and Calendar Remain Relevant

Weather and the changing calendar are always important factors for holiday spending.  Last year, November was colder and December was warmer than normal.  We saw a lot of snow in November and a very limited amount in December.  According to Weather Trends International (WTI), this holiday season is expected to be milder with temperatures warmer and precipitation lower than normal[note]Denise Chai, CFA, Lorraine Hutchinson, CFA, Robert F. Ohmes, CFA, “Holiday ’15: Santa’s sleigh faces uphill ride,” Bank of America Merrill Lynch, Equity. Oct. 21 2015, 7.[/note].  Of course, better weather makes travel easier for consumers.  Having said that, consumers are less likely to buy winter focused products when the weather is unseasonably warm.  A more severe winter might actually be a good thing especially given the growing popularity of online shopping.

The days between Thanksgiving and Christmas are key shopping days.  This year, those days total 28 (26 is the minimum, 32 is the maximum) versus 27 last year.  In addition, there are eight total weekend days to shop, the same as last year.  One more day will probably not make a significant difference.  We would not expect this to be a factor in our estimate for 2015 sales.

Conclusion  

We believe 2015 will be a decent year for holiday spending coming in slightly below last year’s growth.  Overall, the typical consumer is in a better economic position than recent years.  We believe mediocre job growth and inflation adjusted wages will limit the upside to spending.  We would expect retailers to be challenged somewhat with higher inventory positions this year, especially if tourism related spending does not return to normal levels.  In addition, we believe consumers will continue to purchase big ticket items, which may negatively affect other areas of consumer spending.  Seasonal hiring outlooks and subdued predictions from various trade group organizations support our prediction of a slower holiday season in 2015.  The calendar will look very similar to last year while the weather is expected to be harsh but not quite as bad as last year.

Michael Ashley
Principal and Senior Analyst, Corporate Credit


Disclaimer: Asset Allocation & Management Company, LLC (AAM) is an investment adviser registered with the Securities and Exchange Commission, specializing in fixed-income asset management services for insurance companies. This information was developed using publicly available information, internally developed data and outside sources believed to be reliable. While all reasonable care has been taken to ensure that the facts stated and the opinions given are accurate, complete and reasonable, liability is expressly disclaimed by AAM and any affiliates (collectively known as “AAM”), and their representative officers and employees. This report has been prepared for informational purposes only and does not purport to represent a complete analysis of any security, company or industry discussed. Any opinions and/or recommendations expressed are subject to change without notice and should be considered only as part of a diversified portfolio. A complete list of investment recommendations made during the past year is available upon request. Past performance is not an indication of future returns.

This information is distributed to recipients including AAM, any of which may have acted on the basis of the information, or may have an ownership interest in securities to which the information relates. It may also be distributed to clients of AAM, as well as to other recipients with whom no such client relationship exists. Providing this information does not, in and of itself, constitute a recommendation by AAM, nor does it imply that the purchase or sale of any security is suitable for the recipient. Investing in the bond market is subject to certain risks including market, interest-rate, issuer, credit, inflation, liquidity, valuation, volatility, prepayment and extension. No part of this material may be reproduced in any form, or referred to in any other publication, without express written permission.


September 28, 2015 by

  • Liquidity in the bond market is substantially reduced.
  • This liquidity reduction is structural, driven by regulation and a reduced field of intermediaries.
  • At the same time, institutional fixed income management has consolidated in order to capture benefits of scale, but their ability to transact is reduced.
  • In this environment, there is benefit to being a nimble manager.

Dimensioning the Bond Market and Liquidity

Since the extreme disruption of the global financial crisis in 2008 the world and the U.S. have experienced a deep economic recession followed by a much slower than expected resumption of GDP growth (Exhibits 1 and 2).

Source: National Sources and Citi Research (July 2015)


Source: BEA, BLS, and Citi Research Forecasts (July 2015)

The response of central banks and policy makers to the economic downturn and the subsequent slow recovery have been broad and aggressive, including both conventional policy such as interest rate cuts and non-conventional approaches including aggressive quantitative easing in the large developed markets (Exhibits 3 and 4).

Source: National Central Banks and Citi Research (July 2015)


Source: National Central Banks, Haver Analytics and Citi Research (July 2015)

The sustained low rate environment, as well as the introduction of quantitative easing via open market purchase programs, has resulted in an acceleration of the growth of global leverage even as the mix has shifted (Exhibit 5).

Source: Haver Analytics; national sources; World economic outlook; IMF; McKinsey Global Institute analytics (February 2015)

U.S. dollar denominated fixed income markets have participated in this expansion of leverage with the overall market experiencing 18% growth since 2008.  While the most rapid rate of growth has been in government linked indebtedness (116%), it has been followed by corporate indebtedness (45%) as shown in Exhibits 6, 7, and 8.

Source: Federal Reserve


Source: Federal Reserve


Source: SIFMA and Citi Research (August 2015)

And in particular, growth of the corporate bond market has been propelled both by a move away from bank loans and an influx of retail money in the form of mutual funds and Exchange Traded Funds (ETFs) as well as non-U.S. investors (Exhibit 9).

Source: Fed Flow of Funds (as of December 2013)

At the same time that the corporate bond market has experienced record growth, liquidity within the asset class has been dramatically reduced.  The most obvious sign of illiquidity is the materially reduced inventories held by the global banks that act as the main intermediaries in the market (Exhibit 10).

Source: RBS Credit Strategy (July 2014), Federal Reserve Bank of New York, SIFMA, MarketAxess

Note: Because corporate bond dealer inventories are not broken down prior to 2013, we have assumed IG and HY inventories are in the same proportion as the average from 2013 – present.

While reduced dealer inventories in all classes of fixed income are evident, the fall in inventories relative to the growth in the size of the corporate bond markets is particularly striking (Exhibit 11).

Source: Primary Dealer Positons - Federal Reserve Bank of New York Primary Dealer Statistics, Positions greater than 1 year. Data includes Asset-Backed and Municipal Securities. Corporate Bond Market Outstanding = Bank of America Merrill Lynch US Corporate Bond Index and US Cash Pay High Yield Index
Source: Primary Dealer Positons – Federal Reserve Bank of New York Primary Dealer Statistics, Positions greater than 1 year. Data includes Asset-Backed and Municipal Securities.
Corporate Bond Market Outstanding = Bank of America Merrill Lynch US Corporate Bond Index and US Cash Pay High Yield Index

Further evidence of reduced liquidity can be seen in the static daily turnover and average trade size in the corporate bond market (despite the 45% growth in the outstanding).

Source: RBS Credit Strategy (July 2014), SIFMA, MarketAxess


Source: RBS Credit Strategy (July 2014), SIFMA

Why Has Liquidity Been Reduced?

The cause of the reduced liquidity is twofold.  Firstly, the advent of new banking regulations in response to the global financial crisis has increased the capital intensity of bank owned capital markets businesses, incentivizing balance sheet reductions by this group of intermediaries.  Secondly, the global financial crisis has reduced the traditional pool of intermediaries (the “sell side”), either through outright failure, or through a retreat from the capital markets business.

The main regulatory developments impacting bond market liquidity have been the advent of the Basel III capital guidelines and the Dodd-Frank Act.  The Basel III guidelines are a recommended framework for bank capitalization which were finalized in 2011 in response to shortcomings of the previous capital guidelines that were exposed by the global financial crisis (most notably undercapitalizing against the risks inherent in capital markets businesses and securities inventories).  The Dodd-Frank Act signed into law in 2010 represents the U.S. Congress’ attempt to remedy the shortcomings in regulatory oversight of the U.S. financial sector that came to light during the financial crisis (and which set the stage for the U.S. adoption of the Basel III guidelines).  The key aspects of the Dodd-Frank Act that have impacted liquidity of the U.S. bond market include:

  1. Implementation of Basel III capital rules – while the new capital guidelines materially increased the minimum levels of capital, they also raised the risk weighting assigned to securities portfolios and counterparty exposures resulting from OTC derivative trades.  The increased capital requirements and risk weightings have made the fixed income business considerably more capital intensive (Exhibit 14).

    Source: RBS Credit Strategy (July 2014), RBS ABS Strategy, BIS
    Source: RBS Credit Strategy (July 2014), RBS ABS Strategy, BIS
  2. Imposition of a leverage ratio – in addition to increased risk weighting of securities on the balance sheet, Basel III has imposed a leverage ratio that measures capital against gross assets.  This measure of capitalization is meant to protect against any gaming of risk weightings, and particularly penalizes inflated balance sheets (even those consisting of low risk weighted assets such as secured repo and highly liquid Treasury and agency debenture portfolios).  The impact of the leverage ratio can be directly observed in the reduction of money center trading portfolios (Exhibit 15).

    Source: SNL Financial
    Source: SNL Financial
  3. Volker Rule – the Volker Rule was a late addition to the Dodd-Frank Act and was meant to cap “risky” activities previously undertaken by banks.  Most relevant to the discussion on corporate bond liquidity is the prohibition on “proprietary” trading, defined as trading that is not reasonably associated with customer-based activity.  While the implementation of this part of the Volker Rule has been somewhat watered down, it remains subject to regulatory discretion and it has been cited as a driver of reduced trading inventories and staff by bank management.

While increased regulations have reduced the depth of bond market liquidity, the global financial crisis also caused a reduction in the breadth of market liquidity as intermediaries either failed or retreated from the market.  The failure of Bear Stearns and Lehman Brothers, as well as the sale of Merrill Lynch to Bank of America represented the most obvious removal or consolidation of market makers.  Numerous European banks have also been forced by their domestic regulators to pare back their capital markets businesses.  Institutions such as UBS AG, Credit Suisse, Royal Bank of Scotland and Barclays Capital, which had previously been heavily involved in the U.S. fixed income markets, have downsized their capital markets staffing and market making.  While various pools of capital have attempted to replace these traditional intermediaries, the effect of new entrants has been muted.  Non-bank intermediaries such as hedge funds and start-up broker/dealers have had uneven results and have been reluctant to commit meaningful capital to market making.  At the same time, several alternative bond trading platforms have failed to gain a toehold in the markets (with the liquidation of the online start-up Bondcube being the latest failure).

Shift in the Bond Buyer Universe

At the same time that bond market liquidity has been challenged by increased regulations and a narrowed field of intermediaries, the bond buyer universe has experienced a transformation.  Insurance companies and pensions have remained large buyers, but their proportion of the market has dropped.   In contrast, mutual funds/ETFs and foreign buyers have increased as a proportion of the buyer base as investors have attempted to offset the impact of low rates by extending from money market funds (Exhibit 16).

Source: Fed Flow of Funds (as of December 2013)

The investment management field has experienced rapid consolidation as bond buyers strive to gain economies of scale.  Over the past decade, the twenty largest institutional fixed income managers have increased to 60% of total fixed income assets under management vs. 50% a decade ago, even as the overall market size has grown.

Importantly, the mutual fund and ETF component of these asset managers’ AUM have grown as investors that previously would have invested in money market or treasuries instead pursue income through broad fixed income exposure (Exhibit 17).

Source: Federal Reserve


Source: Morgan Stanley Research (May 2015), Yieldbook, Bloomberg

Implications for Investors

Corporate bonds as an asset class have largely been a one way trade since 2008, with spreads tightening even as supply has exploded.  Reduced liquidity has ramifications for investment management clients both in the current environment, and when the credit cycle turns.

Going forward, total return opportunities in fixed income will increasingly be generated from yield as opposed to opportunistic trading.  While increased scale benefits the largest managers in the new issue allocation process, their absolute size is making it increasingly difficult to build meaningful positions across portfolios.  Stealth indexing becomes a risk if managers are forced to buy every new deal that comes to market just to maintain diversity and exposure.

Because of the lack of secondary market liquidity, large managers also face limits on their ability to add to positions outside of the new issue market.  And liquidity challenges will be aggravated in more volatile markets, making outsized positions difficult to liquidate in more volatile markets.  In this context, portfolio construction becomes an enterprise risk management consideration.  Bond maturities and cash flow profiles of fixed income portfolios will be critical to meeting client liquidity needs.

In this environment, investment performance will accrue to the providers of liquidity from forced sellers.  It will be critical to position client fixed income and surplus strategies to be liquidity providers when there are forced sellers and traditional intermediaries pull back from the market.

Against this backdrop, the benefits of hiring a nimble manager become readily apparent.  Defined as being able to execute a chosen investment strategy in the current and foreseeable markets, nimble managers necessarily:

  • Can implement portfolio positioning through trades roughly at the market average trade size
  • Are able to achieve duration targets in individual credits without owning every outstanding issue
  • Do not need to own every issuer that comes to market  in order to achieve credit diversification
  • Can reduce or eliminate credit exposures without causing market dislocations

It is important to make the distinction between managers that are merely small and those that are nimble, with the latter maintaining institutional level market access and an investment team that is able to independently identify and recommend investments on a timely basis.

Specific Example:

With 90% of total corporate bond trade volume in lot sizes below $5 million, the ability to build material positions outside of the new issue market is minimized.  As an example, a manager with $100 billion in assets under management (AUM) trying to grow an exposure to a single credit from 10 basis points to 20 basis points of the portfolio would likely need to execute close to 50 separate trades (Exhibit 19).

Source: AAM, TRACE
Source: AAM, TRACE

Even more concerning is the prospect of increasing volatility of both flows and spreads when market sentiment turns.  Returning to our hypothetical $100 billion AUM manager, we assume a 20% weighting to corporate bonds ($20 billion).  A decision to reduce corporate bond exposure to 17% necessitates the sale of $3 billion of bonds.  Within the context of the average trade size of less than $5 million, this would entail in excess of 500 trades.  Even assuming that a larger manager was able to engage in block trades for a portion of the portfolio reduction, a $3 billion portfolio reduction represents 15% of total primary dealer inventory, so it is reasonable to expect that such a repositioning would impact prices and likely require a sustained period of time in order to execute.  If such a repositioning were occurring against the backdrop of a negative shift in market sentiment and a pull back by intermediaries, the ability of larger managers to execute portfolio shifts would be further constrained.

Screen Shot 2016-01-27 at 08.33.40

Considerations Going Forward

Have regulatory efforts to decrease systemic risk in the banking system increased systemic risk in the capital markets?

To be determined; while lower liquidity/increased volatility appear to be the unintended consequence of the regulatory response to the global financial crisis, higher capitalization and lower systemic leverage (in the financial system anyway) mean that the financial system is better able to sustain the same.

How will fixed income investors react to an eventual removal of easy monetary policy by central banks?

While a sustained rising rate environment would benefit insurance investment clients, the reaction of the new entrants (foreign investors/retail mutual funds/ETFs) in the face of falling prices is less certain.  Although mutual funds and ETFs promise continual liquidity to investors, this has yet to be tested in a sustained rising rate environment, particularly for illiquid underlying investments such as corporate or municipal bonds.

Should fixed income investors pay active management fees for passive management results?

We previously touched on the potential for “stealth indexing” to occur when large managers are forced to buy new issues indiscriminately just to stay diversified. Clients should pay careful attention to their investment managers’ ability to customize portfolios and execute their investment ideas efficiently, while also generating needed liquidity, achieving target returns, and prudently managing risk.

N. Sebastian Bacchus, CFA
Senior Analyst, Corporate Credit


Disclaimer: Asset Allocation & Management Company, LLC (AAM) is an investment adviser registered with the Securities and Exchange Commission, specializing in fixed-income asset management services for insurance companies. This information was developed using publicly available information, internally developed data and outside sources believed to be reliable.  While all reasonable care has been taken to ensure that the facts stated and the opinions given are accurate, complete and reasonable, liability is expressly disclaimed by AAM and any affiliates (collectively known as “AAM”), and their representative officers and employees.  This report has been prepared for informational purposes only and does not purport to represent a complete analysis of any security, company or industry discussed. Any opinions and/or recommendations expressed are subject to change without notice and should be considered only as part of a diversified portfolio. A complete list of investment recommendations made during the past year is available upon request. Past performance is not an indication of future returns.

This information is distributed to recipients including AAM, any of which may have acted on the basis of the information, or may have an ownership interest in securities to which the information relates.  It may also be distributed to clients of AAM, as well as to other recipients with whom no such client relationship exists.  Providing this information does not, in and of itself, constitute a recommendation by AAM, nor does it imply that the purchase or sale of any security is suitable for the recipient. Investing in the bond market is subject to certain risks including market, interest-rate, issuer, credit, inflation, liquidity, valuation, volatility, prepayment and extension. No part of this material may be reproduced in any form, or referred to in any other publication, without express written permission.

April 21, 2015 by

A couple of weeks ago Teva held a call to announce the company’s acquisition of Auspex for about $3 billion.  During the call, Teva’s CEO, Erez Vigodman, commented that “if the right large transaction shows itself, we might be engaged.” He wasn’t kidding!

This morning, Teva announced an offer for Mylan. The offer is for $82/share in cash (50%) and stock (50%), which equates to around $40 billion plus about $8.5 billion in assumed Mylan debt. Proforma 2016 leverage increases from 2.0X to 4.2X, not including synergies or asset sales.  If a deal goes through, we would expect credit rating downgrades.  Current ratings are A3/A-/BBB+.

Following rumors last week, Mylan publically announced the company would not be interested in selling to Teva.  Complicating the situation, Mylan made a $29 billion offer for Perrigo on April 8, 2015.  Strategically, we think a Teva/Mylan transaction would be positive.  A transaction of this size would help to insulate Teva from the recent generic approval of its blockbuster Multiple Sclerosis drug, Capoxone (20mg dose).  We believe this situation is far from over.  Clearly, Mylan is not a willing participant.  Laws/defense tactics in the Netherlands do not support hostile takeovers, so the transaction would most likely need to be “friendly.”  Also, a few weeks ago, Mylan put a poison pill in place to make a takeover difficult.  In addition, we believe there could be anti-trust issues.

There are many scenarios that could play out, including a sweetened offer from Teva.  Other large pharmaceutical companies could step in and make an offer for Mylan, Perrigo, or both.  Perhaps the deal falls through completely.  In that case, we believe Teva hunts for another large company. Most analysts agree that a Teva/Mylan transaction makes sense over a Mylan/Perrigo merger.  We think Mylan board members will be hard pressed to consider a transaction with Teva, especially if the valuation is improved.

The graph below illustrates just how active mergers and acquisitions have been in the pharmaceutical space over the last two years.  We expect 2015 to be another record year.  Limited organic growth is being offset by acquisitions which are being financed with large cash balances and low interest rate debt. Despite the releveraging that we expect to take place, the sector has significant capacity to add debt given solid balance sheets and strong cash flow generating abilities.  While this trend is typically not good for credit ratings and spreads, we believe the business risk of the sector is improving as operations become better diversified and growth prospects are improved.  We continue to position portfolios to take advantage of attractively priced opportunities.

Source: Bloomberg
Source: Bloomberg


Michael J. Ashley
Principal and Senior Corporate Credit Analyst
Disclaimer: Asset Allocation & Management Company, LLC (AAM) is an investment adviser registered with the Securities and Exchange Commission, specializing in fixed-income asset management services for insurance companies. This information was developed using publicly available information, internally developed data and outside sources believed to be reliable. While all reasonable care has been taken to ensure that the facts stated and the opinions given are accurate, complete and reasonable, liability is expressly disclaimed by AAM and any affiliates (collectively known as “AAM”), and their representative officers and employees. This report has been prepared for informational purposes only and does not purport to represent a complete analysis of any security, company or industry discussed. Any opinions and/or recommendations expressed are subject to change without notice and should be considered only as part of a diversified portfolio. A complete list of investment recommendations made during the past year is available upon request. Past performance is not an indication of future returns.

This information is distributed to recipients including AAM, any of which may have acted on the basis of the information, or may have an ownership interest in securities to which the information relates. It may also be distributed to clients of AAM, as well as to other recipients with whom no such client relationship exists. Providing this information does not, in and of itself, constitute a recommendation by AAM, nor does it imply that the purchase or sale of any security is suitable for the recipient. Investing in the bond market is subject to certain risks including market, interest-rate, issuer, credit, inflation, liquidity, valuation, volatility, prepayment and extension. No part of this material may be reproduced in any form, or referred to in any other publication, without express written permission.

April 10, 2015 by

Big Changes Announced This Morning by General Electric & Co. (GE) Today.

The company announced this morning that it will exit all of its stand alone financial services businesses by Year End 2018 via sales and/or spin-offs.  This is a capital allocation decision and represents a dramatic reversal of the build-up of General Electric Capital Corp (GECC) into a non-bank finance behemoth during the Jack Welch years.  Directionally, the move is unsurprising as the vulnerabilities exposed during the global financial crisis, and the financial regulations and investor discount imposed in subsequent years, have been a drag on returns.  However, the dramatic and material move to exit the bulk of the GECC businesses is a surprise, notwithstanding GE’s willingness to engage in transformational activities over the years (those GECC units that directly support the industrial businesses will be retained; aircraft leasing, energy financial services, healthcare finance).

IMPORTANTLY, because of the way GE is structuring the exit, this will be a net credit positive for bondholders.  The historic support mechanism between parent GE and GECC was an income maintenance agreement (IMA) and the repeated assurance that GECC was a core strategic business for consolidated GE (but no explicit guarantee).  Concurrent with today’s announcement, GE has amended the IMA to fully guarantee all tradable senior and subordinate debt of GECC, as well as all outstanding commercial paper.  The company also stated that they expect no new issuance out of GECC for at least five years.  As a result, GECC net debt outstanding is expected to fall from around $275 billion currently to roughly $70 billion at Year End 2018.  The combined fundamental (full guarantee) and technical (dwindling supply) supports meant that spreads should continue to tighten (15 basis points tighter today).

GECC bonds have performed well over the past several years, and tightened further today following the announcement.  We expect that these bonds should continue to outperform given supportive technicals, and no immediate fundamental concerns.  Although GE could ultimately lever the balance sheet in pursuit of more optimal shareholder returns, they appear to be focused on repaying debt, maintaining liquidity and pursuing only bolt-on acquisitions over the next several years (Alstom notwithstanding).

As a side note, S&P affirmed GE’s AA+ rating while Moody’s downgraded GE to A1 (equalizing it to the GECC rating).

N. Sebastian Bacchus, CFA
Vice President, Corporate Credit

December 2, 2014 by

Excess returns of the energy sector have significantly lagged the investment grade corporate market in 2014 due to the unexpected decline in crude oil prices.  Credit profiles of those companies in the energy sector are highly dependent on oil prices and a thorough review of the fundamentals of oil is warranted.  In this paper we describe the factors affecting supply and demand of oil. Given that there are many variables affecting both supply and demand, we narrowed our review to the issues we believe will most affect crude oil in 2015: Libyan supply and the recent OPEC decision, Russian production, domestic oil shale production; demand from China, the European Union (EU) and the U.S.  We conclude our analysis by reviewing the marginal cost of supply of crude oil, which suggests the floor for prices is about $40 per barrel in a worst case scenario.  


The price of oil has declined more than 25% in the past quarter (Exhibit 1) in a pattern that resembles similar moves from 1998 and 2012.  In 1998, oil continued to decline for more than a year, only rebounding once OPEC gained discipline and reduced production.  In 2012, the price decline was relatively short-lived, as market concerns regarding Europe were offset by the Arab Spring induced supply curtailment.  Our opinion is that this decline will resemble the price movements of 2012, not 1998 or 2008.

Source: AAM, Bloomberg

Libyan Supply

At the beginning of 2014, there were several issues at the center of the debate about Middle Eastern crude oil supply: Libyan production, Iranian sanctions and concerns that the Syrian civil war would spill over to Saudi Arabia and Iran.  Given the instability in that region throughout the past three years, it appeared that the risk of a supply disruption was much greater than the prospect of an increase in production.

However, OPEC unexpectedly added more than 1 million barrels of oil per day (>1%) to the market since oil prices peaked in June 2014.  The country most responsible for adding supply has been Libya, where production increased more than 600,000 per day (Exhibit 2).  In our opinion, the big spike in Libyan production is the single biggest factor for the decline in oil prices since June 2014 since it was largely unexpected.

Source: AAM & Energy Information Agency

We are skeptical that Libyan production can be maintained at the current 850,000 barrel per day level in 2015 due to the violence in the region along with a lack of financial and human capital devoted to operations.  In mid-November, armed opponents of the existing government took control of the country’s largest oil field, the 200,000 barrel per day El Sharara in southwest Libya (Exhibit 3).  Additionally, unreliable power to the El Feel field near the Algerian border is curtailing production there.

Source: Energy Information Agency

Furthermore, three of the four largest service companies revealed in their third quarter 2014 earnings call that they are not engaged in Libya currently, which suggests future production will very likely decline.  Halliburton management stated, “Libya’s down for the count right now”; Weatherford management commenting on Libya stated, and “Our activity has effectively halted.” Schlumberger management commented that Libya “continues to be challenging with a very complex security situation and with activity remaining at the minimal level. We are currently carefully evaluating our operational structure in the country and will resize resources in accordance with the 2015 activity outlook.”  Other operators such as ConocoPhillips and OMV were equally pessimistic about production.  As a result, we believe Libyan production, which has averaged about 436,000 barrels per day this year could easily be cut by 20%.

OPEC’s Dilemma

Many believe that a cut in OPEC production will help to stabilize crude oil prices.  However, Saudi Arabia has made it clear in recent months that any cuts to OPEC production will have to be multilateral across all members and that it will not be the sole responsibility of the Saudis.  This is a difficult proposal to accept for many OPEC members, particularly Iran, Libya and to a lesser extent Iraq.  As Exhibit 4 indicates, Iran and Libya are not currently producing near their recent peak capacity.  However, Saudi Arabia is still producing at the same high levels as when the Kingdom supported the international community’s release of oil from strategic petroleum reserves to fend off supply fears during the Arab Spring.

Source: AAM & Energy Information Agency

Saudi Arabia clearly won the debate with other OPEC members at the semiannual meeting in Vienna on November 27th.  OPEC surprisingly kept its oil production quota of 30 million barrels per day unchanged, which implies a cut in actual production of only about 300,000 barrels per day if members adhere to their quotas.  We agree with those who have speculated that Saudi Arabia and OPEC are no longer willing to shoulder the burden as a swing producer to higher cost competition.  Nevertheless, this is a painful decision for most members of OPEC due to their dependence on oil revenues to meet governmental budgets.  Should oil prices remain in the $60 per barrel range for more than one quarter, we expect OPEC to revisit this most recent decision and possibly be joined by non-OPEC members in a production cut.

Russian Supply

Russia is the third largest producer of oil (including lease condensate) in the world at more than 10 million barrels per day, behind only the U.S. and Saudi Arabia.  Given the turmoil in Russia, we believe it is useful to review its production profile from the 1997 to 1999 period when the macroeconomic environment bore some similarities to today.  Recall that in 1998, oil prices declined by more than 50% to $10 per barrel, the ruble was under intense pressure and Russia eventually defaulted on its domestic debt.  Many had forecast Russian oil production to rise in response to the weaker ruble back then and  Russian oil producers wanted to take advantage of this scenario.  However, it took a full two years and high oil prices for production from Russia to actually increase as Exhibit 5 suggests.

Source: AAM, Bloomberg & Energy Information Agency

Not only is Russia facing the macroeconomic headwinds from 20 years ago, it is now also facing sanctions from the U.S. and the EU.  On September 12, 2014, the U.S. Treasury imposed sanctions that prohibit the exportation of goods, services (not including financial services), or technology in support of exploration or production for Russian deep water, Arctic offshore, or shale projects that have the potential to produce oil, to five Russian energy companies – Gazprom, Gazprom Neft, Lukoil, Surgutneftegas, and Rosneft – involved in these types of projects.  This measure complements restrictions administered by the Commerce Department and is similar to new EU measures published that same day.  The weakened ruble, the recently imposed sanctions, historical precedent and much weaker commodity prices suggest Russian production should decline in 2015.

Domestic Supply

The biggest contributor to worldwide crude production growth in 2014 was the U.S. and more specifically, the Eagle Ford Shale in southern Texas, the Permian Basin in west Texas and the Bakken Shale in North Dakota.  While the growth was expected by the marketplace, the efficiency and cost improvements have been surprising.  In just over one year, production from these regions has increased by 1 million barrels per day and is largely responsible for U.S. production reaching more than 13 million barrels per day including lease condensate.  Moreover, the time to complete the wells is declining as are costs.  Based on a bottom up analysis of the key producers in those domestic regions we believe that production should increase by more than 800,000 barrels per day in 2015 (see Exhibit 6), even in a $75 per barrel environment.

Screen Shot 2016-01-27 at 16.13.52
Source: AAM, Company reports and Morgan Stanley Shale Data Book – Fall 2014, Volume 3

Based on the analysis above of the regions we believe will be key in 2015, we are forecasting worldwide production of about 92 million barrels per day, which is basically flat from the second quarter of 2014.  In addition to the regions we highlighted above, we believe that modest production growth could come from Canada and Brazil.

Global Demand for Crude Oil

We base our oil consumption forecast on the International Monetary Fund (IMF) worldwide GDP estimate, which for 2015 is 3.8%.  Based on data since 1970, about 48% of the variability in oil consumption is explained by changes in GDP, which is shown in Exhibit 7.  Using this regression equation, we are forecasting oil consumption of slightly more than 92 million barrels per day in 2014.  If worldwide economic growth in 2015 is near 3.8% as the IMF suggested in October 2014, then oil consumption should exceed 93 million barrels per day in 2015.  If we use a more conservative 2.8% for 2015 worldwide economic growth, oil consumption would approach 93 million barrels per day.

Many market participants have cast a skeptical eye at the latest growth forecasts out of the IMF due to expected weakness from China and worse than expected results from Europe.  In fact, we would not be surprised to see the IMF revise down their 2015 growth forecast in April of next year.  However, we note that worldwide economic growth would have to be cut in half from its current estimate for expected oil consumption to be flat from the expected 92 million barrels per day in 2014.

Equally important, since 1970 there have been seven years when year-over-year oil consumption actually declined (1974-1975, 1981-1984 and 2008).  The average global economic growth during those years was just under 2% and the U.S. was in recession in five of those seven periods.

Source: AAM, International Monetary Fund and Energy Information Agency

China Consumption

Many market participants are concerned about China demand and justifiably so as current China oil consumption represents a larger percentage (11%) of global demand than any other time in history.  As shown in Exhibit 8, Chinese consumption has been increasing since the late 1980’s.  While there have been five occasions since 1980 when consumption actually decreased year over year, the average decrease was only 60,000 barrels per day and the maximum decrease was 83,000 barrels per day in 1990.

We are of the opinion that the pace of China’s economic growth will slow, (the IMF estimate of 7.3% seems high, but it’s still growth).  Similarly, we believe that Chinese oil demand may not grow meaningfully in 2015, but we are skeptical that consumption will actually decline by a substantial amount.

Source: AAM, International Monetary Fund and Energy Information Agency

EU Consumption

The data suggests that consumption from the EU is deteriorating the most of all regions, with demand in 2014 about 200,000 barrels per day lower than the previous year.  Estimating EU consumption using historical data is difficult because there is a limited track record of EU GDP and oil consumption.  Moreover, the correlation coefficient between the two variables is weak, making predicting future demand based on economic growth impractical.  Nevertheless, our estimate is based on the recent trend, which suggests consumption may be 250,000 barrels per day lower in 2015.

Source: AAM and Energy Information Agency

U.S. Consumption

The U.S. is the largest consumer of oil in the world at 19 million barrels per day and its consumption is largely influenced by economic growth.  Exhibit 10 shows the relationship between economic growth and oil consumption in the U.S.  Since 1980, there has been only one year in which economic growth in the U.S. was at least 3% and oil consumption did not increase – that was 1983.  Based on the regression analysis of data from the last 35 years, consumption should increase as long as U.S. GDP is at least 2.4%.  In fact, AAM expects the U.S. economy to grow 3% in 2015, which implies that oil consumption in the U.S. should rise by about 100,000 barrels per day.

Source: AAM, International Monetary Fund and Energy Information Agency

Marginal Cost of Supply

The pace at which oil prices have declined from the recent peak clearly suggests that the market believes that either supply is much greater and/or demand is much less than 92 million barrels per day.  An analysis of marginal cost of supply of crude oil provides investors a basis to understand at which price point existing production becomes unprofitable.  While we are not forecasting a scenario where production has to be “shut-in,” a review of marginal cost of supply is worthwhile (Exhibit 11).  The chart describes the cumulative worldwide production along the X-axis, the marginal cost of supply on the Y-axis and the cost of an existing producing well in these different regions.  Though capital might stop flowing to new exploratory efforts in a sub-$70 per barrel environment affecting future production, Exhibit 11 shows that oil would have to decline to $50, before current production from Kazakhstan and the Canadian oil sands wells would be uneconomic.

Source: Morgan Stanley; OPEC Outlook: Some Perspective Is Required

Based on the above analysis, we believe supply in 2015 will approximate 92 million barrels per day and demand should be at least 92 million barrels of oil per day, which is supportive for crude oil prices.  Many domestic companies recently described in detail their production plans for 2015, which we believe they will achieve adding to overall supply.  However, we are concerned that the instability in Libya and economic conditions in Russia will more than offset the domestic supply gains.  We expect oil consumption to rise in 2015 based on a conservative economic growth forecast of 2.8% versus the International Monetary Fund’s 3.8%.  While European consumption will continue to contract, Chinese and U.S. consumption should mitigate that loss.

Patrick McGeever
Senior Analyst, Corporate Credit


For more information, contact:

Colin T. Dowdall, CFA
Director of Marketing and Business Development
colin.dowdall@aamcompany.com

John Olvany
Vice President of Business Development
john.olvany@aamcompany.com

Neelm Hameer
Vice President of Business Development
neelm.hameer@aamcompany.com


Disclaimer: Asset Allocation & Management Company, LLC (AAM) is an investment adviser registered with the Securities and Exchange Commission, specializing in fixed-income asset management services for insurance companies. This information was developed using publicly available information, internally developed data and outside sources believed to be reliable.  While all reasonable care has been taken to ensure that the facts stated and the opinions given are accurate, complete and reasonable, liability is expressly disclaimed by AAM and any affiliates (collectively known as “AAM”), and their representative officers and employees.  This report has been prepared for informational purposes only and does not purport to represent a complete analysis of any security, company or industry discussed. Any opinions and/or recommendations expressed are subject to change without notice and should be considered only as part of a diversified portfolio. A complete list of investment recommendations made during the past year is available upon request. Past performance is not an indication of future returns.

This information is distributed to recipients including AAM, any of which may have acted on the basis of the information, or may have an ownership interest in securities to which the information relates.  It may also be distributed to clients of AAM, as well as to other recipients with whom no such client relationship exists.  Providing this information does not, in and of itself, constitute a recommendation by AAM, nor does it imply that the purchase or sale of any security is suitable for the recipient. Investing in the bond market is subject to certain risks including market, interest-rate, issuer, credit, inflation, liquidity, valuation, volatility, prepayment and extension. No part of this material may be reproduced in any form, or referred to in any other publication, without express written permission.

  • « Go to Previous Page
  • Page 1
  • Interim pages omitted …
  • Page 4
  • Page 5
  • Page 6
  • Page 7
  • Page 8
  • Page 9
  • Go to Next Page »

Get updates in your inbox.

  • Investment Strategies
    • Investment Grade Fixed Income
    • Specialty Asset Classes
  • Our Clients
    • Client Experience
    • Sample RFP Download
  • Insights
    • Video
    • Webinar
    • News
    • Podcasts
  • About
    • Our Team
    • Contact
    • Client Login

Disclaimer: Asset Allocation & Management Company, LLC (AAM) is an investment adviser registered with the Securities and Exchange Commission, specializing in fixed-income asset management services for insurance companies. Registration does not imply a certain level of skill or training. This information was developed using publicly available information, internally developed data and outside sources believed to be reliable. While all reasonable care has been taken to ensure that the facts stated and the opinions given are accurate, complete and reasonable, liability is expressly disclaimed by AAM and any affiliates (collectively known as “AAM”), and their representative officers and employees. This report has been prepared for informational purposes only and does not purport to represent a complete analysis of any security, company or industry discussed. Any opinions and/or recommendations expressed are subject to change without notice and should be considered only as part of a diversified portfolio. A complete list of investment recommendations made during the past year is available upon request. Past performance is not an indication of future returns. This information is distributed to recipients including AAM, any of which may have acted on the basis of the information, or may have an ownership interest in securities to which the information relates. It may also be distributed to clients of AAM, as well as to other recipients with whom no such client relationship exists. Providing this information does not, in and of itself, constitute a recommendation by AAM, nor does it imply that the purchase or sale of any security is suitable for the recipient. Investing in the bond market is subject to certain risks including market, interest-rate, issuer, credit, inflation, liquidity, valuation, volatility, prepayment and extension. No part of this material may be reproduced in any form, or referred to in any other publication, without express written permission. *All figures shown are approximate and subject to change from quarter to quarter. **The accolades and awards highlighted herein are not statements of any advisory client and do not describe any experience with or endorsement of AAM as an investment adviser by any such client.

Copyright © 2024 AAM | Privacy and Disclosures

  • LinkedIn
  • YouTube