• Skip to primary navigation
  • Skip to main content
  • Skip to footer
AAM CompanyTransparent Logo

AAM Company

AAM Company Website

  • Investment Strategies
    • Investment Grade Fixed Income
    • Specialty Asset Classes
  • Clients
    • Our Clients
    • Client Experience
    • Download Sample RFP
  • Insights
    • Video
    • Webinars
    • Podcasts
    • News
  • About
    • Our Team
    • Events
  • Login
  • Contact Us
Contact

Sector Commentary

August 5, 2014 by

The latest sanctions against Russia are just the most recent bout of volatility that energy companies have had to manage over the past quarter century.  We believe these sanctions have teeth and that Russian oil production will be negatively affected.  However, the investment grade companies with exposure in that country have very strong risk profiles. We would expect each company to be negatively affected by these sanctions, but not enough to meaningfully hurt their risk profile with the exception of BP.    


Effect of Sanctions on Russian Economy

As part of the latest round of sanctions imposed on Russia for their occupation of Ukraine, the United States and Europe have banned exports of technology for use in Russian deep-water and in Arctic and shale oil exploration in the hope of negatively affecting the country’s economic engine.  We believe that these latest sanctions on Russia will hurt its economy within 12 to 18 months. Our views are based on the likelihood that future oil production would almost certainly decline under these restrictions, which would curtail oil export revenue.  This will eventually create significant problems for Russia, as oil and gas revenues accounted for 52% of federal budget revenues and over 70% of total exports in 2012.

We also believe that the sanctions will negatively affect a number of investment grade companies including BP, Weatherford, Shell and Schlumberger.  However, the investment grade energy companies active in Russia are, for the most part, diversified enough to withstand stalled operations in that region without negatively affecting their risk profile or expected returns.

Below, we detail the latest sanctions, provide a brief on Russian oil production and the key participants in the Russian energy industry.  We conclude by updating our opinions on companies which will be affected by the developments in Russia.

Details on the Russian Sanctions

On July 29, 2014, European Union (EU) Ambassadors approved the following sanctions that ban long term financing (of more than 90 days maturity) to state-owned Russian banks; ban arms exports to Russia; ban exports of dual use technology to Russia (civilian technology that has military uses); and ban exports of specified oil exploration and production equipment to Russia.  The U.S. expanded similar sanctions as well.

The sanctions are scheduled to be released and implemented August 1, 2014 and will initially last for 12 months.  However, after three months the EU will evaluate the Russian/Ukraine situation at which point the sanctions could be removed.  The elimination of the restrictions reportedly would require unanimity from all 28 members of the European Union bloc.

Russian Producing Regions and Notable Participants

According to the Energy Information Agency, the fields in the Western Siberian Basin produce the majority of Russia’s oil. Production of oil in the region is dominated by Rosneft, the Russian state run oil company.  Additionally, western energy companies, notably Shell and BP, have secured access to production in Western Siberia in recent years.  BP and Rosneft recently began to explore for shale opportunities in Western Siberia along the Ural Mountains.  The restrictions imposed by the EU and the U.S. are clearly targeted at stopping further activity here.

Source: The World Factbook, CIA

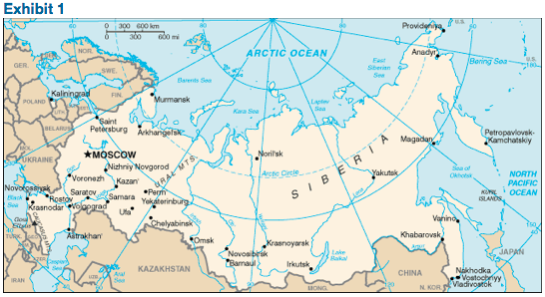
East Siberia has become the center of production growth for Rosneft.  We believe the new sanctions would likely target production in this region as well. The start-up of the Vankor oil and gas field located south of Noril’sk, but north of the Arctic Circle in Exhibit 1 has been a significant contributor to Russia’s increase in oil production since 2010.  Vankor was the largest oil discovery in Russia in nearly three decades and produces about 430,000 barrels per day.

Additionally, Gazprom, Royal Dutch Shell, Mitsui and Mitsubishi are involved in the development of Sakhalin Island oil resources on the east coast of Siberia: Sakhalin I and Sakhalin II.  We believe that the recently announced sanctions would also curtail further production progress in this region.

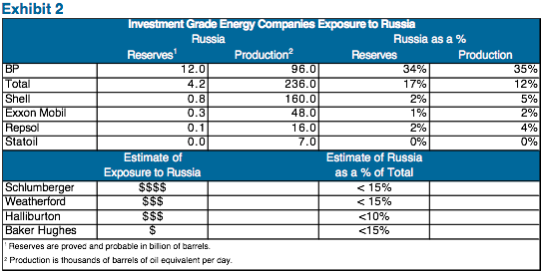
In Exhibit 2, we highlight some of the more affected investment grade energy companies.  Exhibit 2 also provides a summary of investment grade energy companies’ exposure to Russia.  Unfortunately, the oil service companies do not provide country level exposure.  The figures for the service companies are AAM’s estimates based on available geographic data.

Source: Wood Mackenzie and AAM

BP

BP has a 20% stake in Rosneft, which it acquired through the exchange of its investment in TNK (Tyumenskaya Neftyanaya Kompaniya, Tyumen Oil Company) in March 2013.  Robert Dudley, CEO of BP, sits on the Board of Directors of Rosneft.   We believe BP’s risk profile will deteriorate as much as any investment grade company from these sanctions.

ExxonMobil

ExxonMobil does not currently produce much oil or generate significant cash flow in Russia.  However, in April 2012 it announced a very significant partnership with Rosneft to develop offshore reserves in Russia’s Arctic and Black Seas.  The deal according to some estimates is worth up to $500 billion over several decades.  We believe that progress in this joint venture will stall under the constraints.  Notably, Donald Humphries, a former executive vice president of ExxonMobil sits on the Board of Directors of Rosneft.

Royal Dutch Shell

The Netherlands-based Shell is in a very precarious position given its reasonably large position in Russia, combined with the fact it is the Netherland’s largest company and that it lost three important employees in the Malaysia Airlines Flight 17 (MH17) tragedy.  Only four months ago, Shell stated it remained committed to Russia despite the U.S. sanctions.  Now, given how the conflict between Russia and Ukraine has affected the Dutch, it remains to be seen how the super major will proceed.

Total

After BP, Total has the most exposure to Russia.  However, its exposure is primarily natural gas related, which does not seem to be included in the sanctions.  Total has a 20% interest in the $27 billion Yamal liquefied natural gas project in Siberia.  According to Total management, the impact of sanctions on the project was not yet clear.  What is clear is that funding from western companies like Total to Russian natural gas projects like Yamal will certainly slow given the uncertainty there.

Weatherford

On August 1, 2014, Weatherford completed the sale of it Russian land drilling and workover operations to Rosneft for $500 million cash. With the conclusion of this transaction, Weatherford’s remaining Russian revenue base declined from 7% of total company revenue in the first half of 2014 to 3% on a pro forma basis.

Investment Grade Energy Companies Can Manage Volatility in Russia

Subsequent to the collapse of the Soviet Union, the oil patch in Russia has experienced the privatization of the industry, a jailed oil CEO and a coerced sale of a $55 billion joint venture to a state run company – essentially, lots of turmoil.  The only western-based energy companies that can withstand this kind of unruliness are those that are very well-capitalized, diversified and liquid – basically strong investment grade companies.

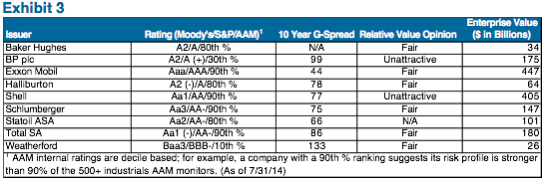
We believe the investment grade energy companies that are exposed to Russia will be able to manage disruptions caused by the sanctions.  In fact, we do not expect any of the companies listed in Exhibit 3 to see a material change to their risk profile, with the exception of BP which will be negatively affected if the sanctions last more than 12 months.

Source: Market sources, AAM


Patrick J. McGeever
Senior Analyst, Corporate Credit


Disclaimer: Asset Allocation & Management Company, LLC (AAM) is an investment adviser registered with the Securities and Exchange Commission, specializing in fixed-income asset management services for insurance companies. This information was developed using publicly available information, internally developed data and outside sources believed to be reliable.  While all reasonable care has been taken to ensure that the facts stated and the opinions given are accurate, complete and reasonable, liability is expressly disclaimed by AAM and any affiliates (collectively known as “AAM”), and their representative officers and employees.  This report has been prepared for informational purposes only and does not purport to represent a complete analysis of any security, company or industry discussed. Any opinions and/or recommendations expressed are subject to change without notice and should be considered only as part of a diversified portfolio. A complete list of investment recommendations made during the past year is available upon request. Past performance is not an indication of future returns.

This information is distributed to recipients including AAM, any of which may have acted on the basis of the information, or may have an ownership interest in securities to which the information relates.  It may also be distributed to clients of AAM, as well as to other recipients with whom no such client relationship exists.  Providing this information does not, in and of itself, constitute a recommendation by AAM, nor does it imply that the purchase or sale of any security is suitable for the recipient. Investing in the bond market is subject to certain risks including market, interest-rate, issuer, credit, inflation, liquidity, valuation, volatility, prepayment and extension. No part of this material may be reproduced in any form, or referred to in any other publication, without express written permission.

June 25, 2014 by

When contemplating an investment, it is important to step back and look at the big picture. Baby Boomers, Generation X’ers, and Millennials are all large groups of the population which carry their own unique characteristics and are defined by the time in which they live. We believe that Millennials and Hispanics will help shape the future of the consumer sector, and an understanding of both demographics will be critical for successful analysis of investment grade credits in insurer’s portfolios.  


A Paradigm Shift in Popular “Trends”: Re-Shaping Focus

Smart phones… Online shopping… Organic Foods… Eat-in vs. Eat-out… 

The combination of population change, economic conditions, and technological advancements have helped to accelerate these trends.  The U.S. population is rapidly aging and evolving into a predominately non-white race/ethnicity. These are a couple of important trends that have been clearly distinguished by the demographic community.  From a business perspective, it’s absolutely imperative to take into consideration these types of longer term changes.   Many companies are reshaping their strategy and recognize that long term survival may depend on making major changes to their business.

We believe that the two most important demographic groups to explain the continued shift in popular trends will be Hispanics and Millennials.

Hispanics: Nearly 25% of the U.S. Population within 20 years

In 2010, Hispanics accounted for about 50 million people which represented 16% of the U.S. population.  By 2035, Hispanics are expected to grow rapidly to 23% of the population.  This is a large group of the population which must be addressed by any consumer focused business. One interesting observation is that Hispanics spend a lot of money on apparel: approximately 20% more than the non-Hispanic consumer (U.S. Census Bureau). This makes the retail industry particularly sensitive to Hispanics spending trends.  The following is a quote from Macy’s Chief Financial Officer, Karen Hoguet, during their fourth quarter earnings conference call:

”And obviously as you look at the population base, there are stores in local areas where you need to think through the Latino strategy or an African-American strategy or Asian. But interestingly, there isn’t one Latino strategy, because in different parts of the country in different countries of origin, it can be very different.”

This approach fits well with the company’s “My Macy’s” strategy, which customizes merchandise to a store specific location. The “right” fashion decision may be customized around the geography of the store. Nation-wide or even regional fashion decisions may have a more difficult time being successful.  With that said, it’s important for retailers to understand the risks associated with the geographic concentration of their stores. In the U.S., Hispanics are heavily concentrated in the southwest states including Texas, California, Arizona, and New Mexico.  This makes sense given their proximity to the Mexican border.  Investment grade companies with high exposure to these areas include Nordstrom, Macy’s, TJ Maxx, and Target.  Of course, a higher concentration of exposure makes it more critical for a particular retailer to get the fashion call right, which is true for any ethnic group.  Major retailers and consumer products companies support such well known Latin stars as: Jennifer Lopez, Shakira, and Sofia Vergara. For example, Jennifer Lopez has an entire line of apparel and home goods at Kohl’s.  Also important for retailers, are fully functioning Spanish web sites and Spanish speaking customer service representatives.  For example, Best Buy offers a very easy option to convert to Spanish with the click of one button.

Another interesting area of spending for Hispanics is in the food category.  About 16% of spending by Hispanics is on food versus 13% for non-Hispanics.  Hispanics are spending more at-home versus at restaurants. About 63% of Hispanic’s food budget is spent at-home compared to 59% for non-Hispanics.  This can be explained, in part, by Hispanic traditions including larger, more family focused meal time. This is an important trend for food retailers and manufacturers.   Grocery stores have evolved with new signage and aisles dedicated to specific ethnic groups including Hispanic, Italian, and Asian.  Additionally, food manufacturers need to understand the important buying behavior of their Hispanic customer.  Exposure to this specific group of customers can occur via mergers and acquisitions or through product innovation.  It’s common to see such ingredients as quinoa (Peruvian), acai (Brazil), chipotle, and habanero in restaurants and at the grocery store.   Interestingly, in the U.S. more tortillas are sold than pasta, hamburger/hot dog buns, and bagels, while salsa has more than twice the sales of ketchup and mustard.

Rapid growth for Hispanics is definitely positive for the economy. Unfortunately, some of this growth is offset by lower than average spending power. Exhibit 1 illustrates the financial position of Hispanics versus other groups.

Note: Household income by ethnic group in $; 2000-2012 percent change in parenthesisSource: U.S. Bureau of Labor Statistics, Wells Fargo Securities, LLC
Note: Household income by ethnic group in $; 2000-2012 percent change in parenthesis

Source: U.S. Bureau of Labor Statistics, Wells Fargo Securities, LLC

Hispanic household income is at the low end of the spectrum and has fallen by double digits since 2000.  Hispanics earn on average $593/week compared to the average of $796/week, according to the Bureau of Labor Statistics (BLS). This may be partly explained by the lower level of education.  Just 40% of Hispanics have a college education versus 65% for non-Hispanics.

By 2025, Three Out of Four Workers Will Be Millennials

Millennials were born between 1980 and 2000 and account for over 85 million people in the U.S.  Similar to other generations, the unique characteristics of Millennials will help shape the world, including the way businesses target consumers and adapt to significant change.  Several studies on Millennials have yielded similar outcomes when it comes to defining characteristics.  Millennials are politically independent, more liberal on social issues, racially diverse, not very religious, and well educated.  Student loans and a higher level of unemployment have led to a higher rate of Millennials living at home and waiting to get married and start a family.  In addition, this group is very tech savvy and heavily entrenched in online social networking. Online shopping has become very popular and represents the highest area of growth for many major retailers. Anyone with online access can write an opinion on a product that has the potential to reach millions of people across the globe.  Millennials are easily swayed by opinions and are less brand loyal.  Also, this group is very cost conscious and demands high quality/service.

Currently, the economic power of the Millennials is lacking, but the potential is high.  A significantly higher level of unemployment exacerbates the spending problem.  The unemployment rate at the end of May 2014 for individuals ranging in age from 18-34 was 8.0% compared to 5.9% for the entire population (BLS).  Also, Millennials have not benefited from the recent rise in the stock market and improvement in housing as illustrated below in Exhibit 2.

Source: Census Bureau, Goldman Sachs Investment Research

Looking forward, we believe the upside to economic growth from Millennials is substantial.  Typically, peak spending occurs at about age 40 and tails off significantly around 65 years of age.  For Millennials, the peak cycle will start in approximately five years.  Another positive is the higher degree of optimism that this group exhibits. Several surveys, including the University of Michigan consumer sentiment index, have been consistently higher for the 18-34 year old age group.  Exhibit 3 makes a solid case for growth potential when taking a look at the unemployment rate and percentage of consumer spending.  The graph compares the 18-34 year old age group at three different points in time (1990, 2000, and 2012).  The takeaway is that as the unemployment rate comes down, the percentage of spending should go up.

Screen Shot 2016-01-27 at 11.46.49

A projection of relative share of consumer spending shows that spending by Millennials will exceed that by the Baby Boomers in the next ten years, accounting for about 35% of all spending.

This has major implications for the food and consumer products industries. We expect Millennials’ desire for improved health and convenience will continue at a strong pace. Food companies are focused on “clean” foods, including gluten free and protein enriched products. These trends have led to significant mergers and acquisitions, including Campbell Soup’s acquisition of Bolthouse and product innovation yielding new products such as Yoplait’s 100 calorie Greek Yogurt and Quaker’s High Fiber Instant Oatmeal. Millennials are also looking for a meal that is easy to put together and doesn’t cost a lot. For example, Velveeta’s Liquid Gold inspired Cheesy Skillet Dinner Kits have experienced strong sales growth. Another area of interest is in cosmetics and skin care. An article in Cosmopolitan titled, “10 Solutions for Annoying Skin Issues Plaguing Millennials” writes about skin problems associated with stress and sallow looking skin from staying out all night. Millennials are seeing the impact that aging has on their parents. In addition, women want to look their best given the social pressures of keeping healthy and looking good. With the proliferation of smart phones, nearly everyone has a camera with them at all times, increasing the perceived importance of beauty products.

Most retailers are making major changes to their business to accommodate the specific requirements of Millennials. This includes a special focus on mobile/online shopping, branding, and exposure to all forms of social networking. The way retailers manage their inventory is entirely different from ten years ago. This omni-channel strategy allows the customer to shop online and in the store from a computer or mobile device. A customer in the store can buy a product on the shelf in a different location which can be shipped to that store or delivered directly to the customer’s home. In addition, sales that originate online draw inventory from distribution centers or directly from a brick and mortar store. Pricing is very important to customers. Shoppers have become more intelligent when shopping for the “best deal.”  The frugal nature of shoppers was emphasized in the latest economic recession.  We would not expect this type of mindset to change any time soon. In addition, shoppers have simple online tools available to compare prices, and the commonplace practice of “price matching” also makes shopping in an actual store competitive. Millennials are very tuned into hot trends. This group is not shy about publicizing their opinions and is easily swayed by popular trends and celebrity endorsements. Branding and image are critically important for retailers. Retailers are actively partnering with established, well known leaders in their field. An example of this is Target’s collaboration with Giada de Laurentiis in their food department and Nate Berkus in home goods. As the Millennials improve their financial positions and move into their own homes, we expected the home improvement retailers, including Home Depot and Lowe’s, to prosper.

We See Opportunities in the Consumer Sectors

We expect the Retail and Consumer Products industries will continue to transform. We believe most companies are well aware of the changing landscape and are trying to make smart decisions. What were once strong companies (Sears, JCPenny, RadioShack, Polaroid) are now worn out concepts that didn’t adapt to change. For our client’s portfolios, we focus on companies that are open to change whether it’s through mergers and acquisitions or through internal development. For the most part, we believe that “bigger is better” especially for a mature business in a highly competitive environment. We would expect companies to continue to expand overseas and look for strategic acquisitions in the U.S. where trends such as Hispanics and Millennials can be emphasized. We do not avoid those companies that have increased their debt leverage as long as the use of cash is strategic for the company and ultimately benefits all stakeholders.

The Retail and Consumer Products sectors trade significantly tighter than the overall market. At the end of April, the OAS of the Retail sector was 89 basis points and for Consumer Products it was 85 basis points. This compares to 101 basis points for the OAS of the Corporate bond market, as reflected by the Barclays Investment Grade Corporate Index. We would need to see significant relative spread tightening for these sectors to outperform the broader market. We don’t expect credit measures for these industries to improve markedly. Event risk is very high. Shareholder friendly action has become ordinary with the range of options including share buybacks, asset spinoffs, and leveraged buyouts. We expect this kind of activity to continue. As bondholders, we would rather see debt used for mergers and acquisition purposes. While it may be difficult for the sectors to outperform, we are confident that there are still many good opportunities to pursue.

Our strategy is to focus on “best in class” companies or subsectors that benefit from a positive secular development or an attractive niche. In addition, we generally prefer the BBB rated credits because they offer more yield with a greater opportunity for relative spread tightening. Despite severe competitive challenges Macy’s, Kroger, CVS, and Home Depot have consistently proven their market leading positions. Large home appliance leader Whirlpool will continue to benefit from an attractive replacement cycle and the steady improvement in the housing sector. Kerry Group is one of the largest ingredient and flavor manufacturers in the world. We like this business given the diversified nature of its customers and the innovative, value added products that it offers.

Michael J. Ashley
Principal and Senior Analyst, Corporate Credit


For more information, contact:

Colin T. Dowdall, CFA
Director of Marketing and Business Development
colin.dowdall@aamcompany.com

John Olvany
Vice President of Business Development
john.olvany@aamcompany.com

Neelm Hameer
Vice President of Business Development
neelm.hameer@aamcompany.com


1 Paul Lujuenz, Matt Nemer, Evren Koppelman, Trisha Dill, and Kate Wendt, “Retail Weekend Reading: Who Can Win Over the Hispanic Population,” Wells Fargo Securities Equity Research, January 30, 2014, page 2.
2 John Baumgartner and Kristina Westura, “Food: Evaluating Hispanic/Millennial Opportunities,” Wells Fargo Securities Equity Research, March 13, 2014, page 1.
3 Baumgartner and Westura, “Food: Evaluating Hispanic/Millennial Opportunities.”
4 Elaine Watson, “Hispanic food and beverage market set for more ‘aggressive growth’ Predicts Packaged Facts,” Food Navigator USA, December 7, 2012, accessed May 7, 2014, https://www.foodnavigator-usa.com/Markets/Hispanic-food-and-beverage-market-set-for-more-aggressive-growth-predicts-Packaged-Facts.
5 Baumgartner and Westura, “Food: Evaluating Hispanic/Millennial Opportunities.”
6 Michael Kelter, Matthew Fassler, Steven Kent, and Ivan Holman. “4Q13 macro survey suggests middle income and Millennial strength,” Goldman Sachs Equity Research – Americas: Retail, January 28, 2012, page 15.
7 Kelter, Fassler, Kent, and Holman, 4Q macro survey suggests,” page 18.


Disclaimer: Asset Allocation & Management Company, LLC (AAM) is an investment adviser registered with the Securities and Exchange Commission, specializing in fixed-income asset management services for insurance companies. This information was developed using publicly available information, internally developed data and outside sources believed to be reliable.  While all reasonable care has been taken to ensure that the facts stated and the opinions given are accurate, complete and reasonable, liability is expressly disclaimed by AAM and any affiliates (collectively known as “AAM”), and their representative officers and employees.  This report has been prepared for informational purposes only and does not purport to represent a complete analysis of any security, company or industry discussed. Any opinions and/or recommendations expressed are subject to change without notice and should be considered only as part of a diversified portfolio. A complete list of investment recommendations made during the past year is available upon request. Past performance is not an indication of future returns.

This information is distributed to recipients including AAM, any of which may have acted on the basis of the information, or may have an ownership interest in securities to which the information relates.  It may also be distributed to clients of AAM, as well as to other recipients with whom no such client relationship exists.  Providing this information does not, in and of itself, constitute a recommendation by AAM, nor does it imply that the purchase or sale of any security is suitable for the recipient. Investing in the bond market is subject to certain risks including market, interest-rate, issuer, credit, inflation, liquidity, valuation, volatility, prepayment and extension. No part of this material may be reproduced in any form, or referred to in any other publication, without express written permission.

November 26, 2013 by

Another year is behind us and we find ourselves in the midst of the holiday shopping season. Holiday merchandise seems to creep into stores earlier every year. According to the National Retail Federation (NRF), about 40% of shoppers begin their holiday shopping before Halloween. This is a very important time of year for the retailers as up to 40% of their annual revenues are realized during the holiday season. The retail industry has performed reasonably well this year despite concerns in Washington (government shut down, budget woes, and unrest in Syria) and continued low economic growth. Various analysts and trade organizations predict that holiday sales will be up anywhere from 2% to 4%. We believe that sales for this year will come in at the low end of that range. The following report explores some of the more important drivers of our analysis.


The Consumer’s Financial Position Remains Questionable

Probably the most important driver of retail sales is linked to the strength of the consumer. The table in Exhibit 1 summarizes our analysis of nine different factors which help us think about the typical consumer’s economic position. We make an assessment of the individual factors in terms of how they may impact spending.

Source: Bloomberg
Source: Bloomberg

These factors are slightly more positive than last year. Positive developments include falling gas prices and better housing data. Low income growth, a falling labor participation rate, and headlines out of Washington create uncertainty and hurt spending. In addition, GDP in the U.S. has tapered off throughout the year and is not expected to be significantly better in 2014.

Big Ticket Items Could Take Away From the Shopping List

This year, a significant amount of consumer spending has been on big ticket items, including new cars and housing related items. Auto sales have been stronger than expected because of more available funding and secular trends including the increasing age of used cars, shown in Exhibit 2.

Source: Company Data, Morgan Stanley Research

Another indicator to watch is the “AHAM 6” (Association of Home Appliance Manufacturers) which measures shipments of six major home appliances (washers & dryers, dishwashers, refrigerators, freezers, ovens, and ranges). As shown in Exhibit 3, growth has been impressive in 2013.

Source: Company Data, Morgan Stanley Research

Years of pent up demand from lack of spending and improving housing prices are giving consumers greater confidence to spend on their homes. There is the risk that a greater piece of the spending pie will be used to buy these types of big ticket items, leaving a smaller portion for typical Christmas items including apparel and electronics.

Statistical Analysis – Purely Quantitative But Supports Slower Sales

Looking back on data over the last twenty years, reveals a significant correlation (81%) between “Back to School” retail sales (August and September) and “Holiday” sales (November and December). To complete this analysis, we used the U.S. Census Bureau’s monthly retail trade data which includes a variety of retail businesses. The model predicts “Holiday” sales of 1.6% when using 1.9% for the “Back to School” sales observed in 2013. We also used adjusted data which predicted “Holiday” sales of 2.2%. This would be significantly lower than the average, which was 3.6% (4.1% adjusted) over those twenty years.

Seasonal Hiring Resembles Last Year

The National Retail Federation predicts that between 720,000 and 780,000 seasonal workers will be hired this year[note]“Holiday Survival Kit 2013,” National Retail Federation. Page 7, accessed November18, 2013, https://www.nrf.com/modules.php?name=Dashboard&id=55[/note].  This compares to 720,490 hired last year and is above the pre-recession numbers which were closing in on 700,000 several years in a row. One important trend stems from the growing online business. Companies are shifting hiring in stores to adding staff in call centers or distribution warehouses. E-commerce giant, Amazon, is hiring 70,000 seasonal employees which is up 40% from last year.

Worse Inventory May Lead to Pricing and Margin Pressures

Consumer shopping patterns are not expected to be much different this year. Consumers are much smarter these days given much more efficient ways to comparison shop. Shoppers have turned into deal hunters which has forced retailers to deepen promotions and to start promoting earlier.  This year, we believe that retailers are in a worse inventory position than last year. We take a look at inventory growth (year/year) in the second quarter and third quarter for the largest retailers in the U.S. over the past three years. As you can see in Exhibit 4, the average growth is significantly up from 2012 and about the same as 2011. We are still waiting on some financial results to get a more complete picture for the third quarter of 2013.

Source: CapitalIQ
Source: CapitalIQ

As a result, we expect retailers will need to be price competitive. We expect retail margins to be weaker going into the end of year as overall costs have increased. In particular, retailers experienced higher cotton prices earlier in the year when orders for holiday merchandise were made. In addition, there is a lack of fashion newness and limited “hot” toys this year which typically help margins.

Online Shopping Continues to Gain Importance

E-commerce continues to be a very important area of growth for the retail industry. Those brick and mortar retailers that have not adapted to the evolution of online shopping are loosing dollars. Retailers’ “Omni-channel” strategy has merged the inventory and distribution of physical stores with the online business. As shown in Exhibit 5, for some retailers, e-commerce has grown to a significant portion of their business, especially the major department stores. According to Shop.org, holiday sales are expected to be up 13% to 15% this year to as much as $82 billion[note]Deborah L. Weinswig, “Weinswig’s Holiday 2013 Outlook: Soft Holiday Sales Likely to Put our Retailers on the Naughty List,” Citi Research: Equities, Retailing – Broadlines (North America), October 24, 2013, 14[/note]. Mobile devices are getting easier to use and are playing a bigger role in shopping for consumers. According to eMarketer, 16% of e-commerce sales will be made on a mobile device this year.

Source: Company Reports, Citi ResearchNote: DG, SKS, TGT, and WMT are estimated
Source: Company Reports, Citi Research

Note: DG, SKS, TGT, and WMT are estimated

NPD Survey Is Positive for 2013 Holiday Sales

According to a recent survey by the NPD Group (Exhibit 6), consumers are expected to spend more this holiday season. This year, 79% of shoppers are expected to spend more or the same compared to 77% last year and 73% in 2011. The main purchase drivers for consumers are special sale prices, overall value for the price, and free shipping.

Source: NPD Group, Morgan Stanley Research

Weather…Good, Calendar…Bad

Weather and the changing calendar are always important factors for holiday spending. Last year, the vast majority of the country trended warmer which seemed to have an impact on seasonal items (e.g., coats, scarfs) which are more important to the department store segment. According to Weather Trends International (WTI), November and December of this year are expected to be significantly colder. This should be a positive so long as a heavier than normal amount of snow does not keep shoppers from driving. Having said that, WTI is predicting one of the heaviest snowfalls in the last three years, but still slightly below the average. Worse than expected weather might not be that bad, as we would expect some of that shopping to shift to increased online sales.

The days between Thanksgiving and Christmas are key shopping days. This year, those shopping days total 26 (minimum) versus 32 (maximum) last year. In addition, this year there is one fewer weekend between holidays. The shortened holiday shopping season could make it more difficult for retailers to forecast sales, which could lead to an earlier start to promotions.  We expect the changing calendar will negatively affect the retailers.

Despite some challenges this year, the typical consumer remains resilient.  Slowly, but surely, the consumer seems to be improving. Retailers seem to have built up a bigger than normal inventory which may prove costly given the lack of exciting product this season and an off-year in terms of the calendar. Also, spending on big ticket items may leave less money left over for typical Christmas presents.  Growing popularity with online shopping and a better than normal weather forecast should help retail sales. Also, season hiring expectations appear to support moderate growth. We expect spending during this holiday to be decent probably up somewhere around 2% which is at the low end of forecasts.

Michael J. Ashley
Senior Research Analyst, Corporate Credit


For more information, contact:

Colin T. Dowdall, CFA
Director of Marketing and Business Development
colin.dowdall@aamcompany.com

John Olvany
Vice President of Business Development
john.olvany@aamcompany.com

Neelm Hameer
Vice President of Business Development
neelm.hameer@aamcompany.com


Disclaimer: Asset Allocation & Management Company, LLC (AAM) is an investment adviser registered with the Securities and Exchange Commission, specializing in fixed-income asset management services for insurance companies. This information was developed using publicly available information, internally developed data and outside sources believed to be reliable.  While all reasonable care has been taken to ensure that the facts stated and the opinions given are accurate, complete and reasonable, liability is expressly disclaimed by AAM and any affiliates (collectively known as “AAM”), and their representative officers and employees.  This report has been prepared for informational purposes only and does not purport to represent a complete analysis of any security, company or industry discussed. Any opinions and/or recommendations expressed are subject to change without notice and should be considered only as part of a diversified portfolio. A complete list of investment recommendations made during the past year is available upon request. Past performance is not an indication of future returns.

This information is distributed to recipients including AAM, any of which may have acted on the basis of the information, or may have an ownership interest in securities to which the information relates.  It may also be distributed to clients of AAM, as well as to other recipients with whom no such client relationship exists.  Providing this information does not, in and of itself, constitute a recommendation by AAM, nor does it imply that the purchase or sale of any security is suitable for the recipient. Investing in the bond market is subject to certain risks including market, interest-rate, issuer, credit, inflation, liquidity, valuation, volatility, prepayment and extension. No part of this material may be reproduced in any form, or referred to in any other publication, without express written permission.


October 1, 2013 by

AAM has established an overweight to REIT (Real Estate Investment Trust) debt over the past three years.  This position reflects the firm’s view that the sector offers attractive excess return potential due to good fundamentals and technical support.  This paper will review the structure of the industry and the key credit factors that underpin our investments in the REIT sector.


REIT Investment Thesis

Investment in REIT corporate bonds provides exposure to the asset based cash flow generated by ownership of commercial real estate.  In contrast to investment in Commercial Mortgage Backed Securities (CMBS), the underlying asset portfolios are dynamic, rather than static, and benefit from an experienced management team that manages the real estate holdings through the cycle.  This exposure to commercial real estate will benefit from our expectation of continued slow but steady economic growth which will support operating fundamentals and underpin property valuations.  At the same time, REIT balance sheets are significantly better positioned today than five years ago, and we expect this fundamental strength to endure over the intermediate term.  Although the legal structure of the REIT sector makes it heavily dependent on capital market access, the experience of the global financial crisis demonstrated the sector’s resilience and the covenant protections unique to the sector.

Relative Value

The REIT sector has exhibited a higher beta relative to the overall corporate index during times of volatility (Exhibit 1), and the sector trades wide of the broad corporate index.  After reaching historic wides during the latter stages of the financial crisis in early 2009, REIT spreads compressed meaningfully as credit fundamentals improved.  Going forward, the scope for REIT bond spread tightening appears modest given our macro forecast of restrained economic growth, but because the sector trades wide to the overall corporate index, our investments should continue to generate excess return via carry.

Screen Shot 2016-01-27 at 09.06.43
Source: Barclays Capital

Sector Background and History

A REIT is a tax advantaged form of corporate organization focused on commercial real estate ownership.  Created by Congress in order to encourage real estate investment, REIT designation requires that no less than 75% of operating income is generated from ownership/operation of real estate holdings, and that at least 90% of net income is paid out as common dividends to the REIT’s equity investors.  The benefit of the REIT designation is that income is not subject to federal income tax so long as 90% is paid out to investors (thus avoiding the double taxation which traditional corporate equity investors face).

REITs invest across the traditional real estate subsectors (retail, multifamily, office) and increasingly have expanded into new subsectors (medical office, assisted living, industrial) and less traditional “real estate” sectors (timber land, billboards, cellular towers) over the past decade.  Although REITs gained acceptance by institutional investor acceptance with the advent of publicly floated REITs in the early 1990s, the sector remains something of a niche product.  While the liquidity provided by access to the capital markets have allowed public REITs considerably greater financial flexibility and scale than private real estate ownership, REITs still account for less than 15% of total commercial real estate ownership in the United States.

REIT debt has been included as a corporate subsector in the Barclays Capital Aggregate since 1997 and has risen from 0.72% of the outstanding corporate bonds in the Aggregate that year to 1.5% in 2003 and 2.25% as of August 2013.  While REITs originally relied heavily on commercial mortgage debt provided by banks, the use of unsecured corporate debt and CMBS funding grew rapidly in the early 2000s, leading to a build-up of balance sheet leverage heading into the global financial crisis.

Following the collapse of Lehman Brothers, REITs were effectively shut out of the capital markets.  This was a potentially existential threat for the sector, as the inability to retain earnings mandated continual access to capital in order to roll maturing debt.  Public REITs addressed the funding challenge by returning to the banks for secured funding, and, beginning in early 2009, engaged in a sector-wide recapitalization.  The REITs were able to accomplish such a recapitalization due to the existence of a dedicated REIT investor base (i.e., asset managers exclusively focused on REITs) which account for approximately 40% of total REIT equity holders. This group of investors was willing to participate both because of their single sector focus, and because they wanted to avoid the nearly 50% dilution to their existing holdings that such a recapitalization entailed.  The success of the 2009 recapitalization laid the foundation for the recovery of the sector’s fundamental creditworthiness since 2010.

Recovery of Fundamentals Post 2009

As the U.S. economy emerged from recession in the latter half of 2009, the recapitalized REIT sector was well positioned for the dual recoveries in commercial real estate and the capital markets.  The low interest rate environment and modest economic growth supported a recovery in commercial real estate valuations, allowing REITs to exit non-core portions of their portfolio at a gain.  At the same time, the low cost of funding and demand for corporate debt by fixed income investors provided the financing for opportunistic acquisition.  Public REITs were at a particular advantage relative to non-public real estate owner/investors who were still cut off from the capital markets and carrying properties at a loss.  This combination of factors allowed the large, well capitalized public REITs to cherry pick the best of the large amounts of commercial properties that had ended up in special servicing or outright default during the recession.

During the depths of the recession, most public REITs experienced deterioration in credit metrics as operating results came under pressure.  Most made a concerted effort to preserve occupancy to the extent possible by offering rent and lease term concessions in order to renew expiring leases.  With the renewal of economic growth, and the rationalization of REIT portfolios, occupancy has recovered rapidly, and now stands at or above pre-recession levels for most subsectors.

At the same time, net operating income (NOI), which fell rapidly due to lease concessions offered during the down turn, also recovered (Exhibit 2). Albeit, at a slower pace than occupancy, given the extended concessions granted in order to maintain occupancy.  However, NOI has continued to grow even as occupancy has stabilized, as lack of new development has allowed REITs to push rent increases and previous lease concessions have expired.

Source: Company reports and Wells Fargo Securities, LLC.

The combination of improving operating results and renewed access to the capital markets have combined to drive balance sheet deleveraging and improving credit metrics (Exhibit 3).  Following 2009, all of the REITs have aggressively reduced leverage on their balance sheets, both through debt refinancing and improved profitability.  In addition to reducing balance sheet leverage, REITs have taken advantage of the low rates to term out funding and to pay down secured mortgages using unsecured bonds.

Source: SNL Financial, J.P. Morgan

REITs have also taken steps to improve liquidity following the crunch experienced in 2008.  As noted previously, they have meaningfully termed out their debt, taking advantage of the low rates and receptive markets.  Backstop credit facilities have been upsized and extended at lower cost.  The result has been an improvement in distance to funding and meaningful improvement in fixed charge coverage ratios (Exhibit 4).

Source: J.P. Morgan, Company reports

Credit Factors Sustaining REIT Bond Performance Going Forward

The strong performance of the sector over the past three years raises the question of whether the excess returns are sustainable going forward.  We remain confident in our overweight to the sector, based on a number of fundamental and technical supports.

Balance Sheet Discipline – the lessons learned during the 2008 credit crunch appear to have stuck.  REIT management teams have shown good discipline maintaining lower leverage and unencumbered portfolios despite falling cap rates, even in the face of increased competition for properties as financial buyers have re-entered the market.  To the extent that balance sheet leverage begins to move back up, we would be forced to reconsider this point.

Lack of Development/New Build – while commercial real estate fundamentals have recovered substantially, development activity (and especially speculative development) remains very subdued, and new deliveries into key markets as a proportion of overall supply remain well below the peaks seen in late 2006.  Partially this reflects still tight credit from banks that are running off legacy construction lending portfolios.  As well, much of the commercial development infrastructure remains deeply impaired five years after the crisis.  Although there has been some resumption in multifamily development in the strongest coastal markets (NYC, Northern California, Seattle), deliveries into these markets are generally less than one percent of outstanding supply annually, and has been outstripped by demand as these markets have enjoyed the strongest recovery in employment.

REIT Covenant Package – Unique within the investment grade bond space, REITs have traditionally included a financial covenant package that caps leverage and secured debt, imposes interest coverage tests and require maintenance of unencumbered assets-to-debt.  Over the past five years, inclusion of the “standard REIT covenant package” in new debt has become virtually universal, and the protections have become even more explicit (e.g., Joint venture carve-outs have become standard).  These covenants protect bondholders by maintaining balance sheet flexibility going into a crisis, and give creditors more leverage with management (something not enjoyed by the rest of the investment grade bond market).  Furthermore, these covenants effectively prevent leveraged buy-outs in the REIT space.

Excess Spread Has Technical Support – Despite the growth of REIT debt outstanding, it remains a very small sector at 2.25% of the Barclays Capital Corporate Index.  This small size, as well as the reluctance of parts of the investment grade bond investor base to participate in the sector due to its relative newness and niche asset class reputation, have resulted in the sector trading wide to the overall corporate index, and to similarly rated sectors.  The small issue size and less frequent issuance for the sector also tend to discourage total return investors that might otherwise invest actively and cause a normalization of spreads.  Because of these technical factors, we believe the relative OAS advantage of the sector is likely to sustain, providing a carry benefit, even if there is not further tightening in the basis between the REIT sector and the broader Corporate Aggregate.

Macro Outlook is Supportive – The REIT sector is one of the higher beta sectors within the investment grade corporate bond universe.  However, AAM’s expectation is that the modest economic recovery that has been under way for the past four years will continue at least for the next two years, with the active support of the Federal Reserve.  In the context of 2-3% GDP growth, we expect that class A commercial real estate in the strongest markets should continue to perform.  While we have begun to see a pick-up in M&A within the sector, we believe that bondholders are protected by the covenant package, which assures prudent financing with a high proportion of equity funding (which has in fact been the case in the two largest transactions over the past year).

REIT Subsectors Favored by AAM

Multifamily – This sector has been supported by the resumption of employment growth in the markets experiencing the strongest economic recovery (coastal markets and Texas) as well as the fall in home ownership.  Operators that have been very focused on their core markets (such as Essex (ESS) in California or Camden (CPT) in Texas) have benefited from a strong rebound in both occupancy and rental rates.  Despite an increase in new build activity, supply is well below emerging demand.

Central Business District (CBD) Office – Class A property has rebounded strongly, especially in Boston and San Francisco where performance has been bolstered by technology and biotech demand.  While New York has been impacted by downsizing in the financial sector, the best operators have been actively reformatting large space for smaller financial services firms (hedge funds), while exiting aging properties and taking advantage of capital markets access to finance the purchase of new Class A properties.  While there has been a resumption of CBD construction, it is generally pre-leased with anchor tenants.  In contrast, suburban office properties continue to struggle with high vacancies and ease of replacement by tenants.  In this sector we favor Boston Properties (BXP) while avoiding suburban operators.

Retail – The two largest regional mall operators (Simon and Westfield) have widened their advantage over competitors during the recovery, focusing on the higher end malls (and the former has moved aggressively into premium outlet shopping).  We have also invested in the two largest triple net lease (lessees responsible for maintenance/taxes/insurance) operators which focus on single location leases with long durations and strong underlying real estate characteristics (National Retail (NNN) and Realty Income (O)).  In contrast we have avoided most community shopping centers and strip center operators which have been plagued by high vacancies in small shop space and a shake out in the casual dining sector.

Risks to the Sector

While we have a high degree of confidence in our REIT sector investment thesis, there are several key risks that bear consideration.

Capital Market Dependence – Because REITs cannot retain earnings (dividend requirement), they are dependent on capital markets both to grow (through new equity issuance) and to refinance outstanding debt.  As noted previously, we expect the balance sheet discipline of the past several years to sustain over the intermediate term, and all of the REITs we invest in have substantial liquidity.  However, the wholesale funding risk is fundamental to the sector and investors should be compensated for this risk.

Rising Interest Rates – While rising rates will impact both real estate valuations and cost of funding, REITs have meaningfully termed out their debt funding at historically low rates.  Furthermore, the spread between current cap rates and REIT funding costs remain at historic wides, and thus would be able to sustain a reasonable amount of compression.

Tax Reform and REIT Status – While the prospect of comprehensive Federal tax reform appears slim, REIT status is ultimately a tax preference and could come under consideration as part of broader reform in the future.  Also, as more new property types file for REIT designation, the sector could draw unwelcome attention from tax reform advocates (examples of this include a recent unfavorable article in the New York Times regarding private prisons potentially filing for REIT status).

Conclusion

In conclusion, our overweight to the REIT sector reflects slow but steady macroeconomic improvement to the US economy, prudent balance sheet management, and sustainable operating results.  We believe that investors are compensated for the higher volatility of this sector vs. the broader Corporate Index, and believe that our investments in REIT corporate bonds will continue to generate positive excess returns for our clients.

N. Sebastian Bacchus, CFA
Senior Analyst, Corporate Credit


For more information, contact:

Colin T. Dowdall, CFA
Director of Marketing and Business Development
colin.dowdall@aamcompany.com

John Olvany
Vice President of Business Development
john.olvany@aamcompany.com

Neelm Hameer
Vice President of Business Development
neelm.hameer@aamcompany.com


Disclaimer: Asset Allocation & Management Company, LLC (AAM) is an investment adviser registered with the Securities and Exchange Commission, specializing in fixed-income asset management services for insurance companies. This information was developed using publicly available information, internally developed data and outside sources believed to be reliable.  While all reasonable care has been taken to ensure that the facts stated and the opinions given are accurate, complete and reasonable, liability is expressly disclaimed by AAM and any affiliates (collectively known as “AAM”), and their representative officers and employees.  This report has been prepared for informational purposes only and does not purport to represent a complete analysis of any security, company or industry discussed. Any opinions and/or recommendations expressed are subject to change without notice and should be considered only as part of a diversified portfolio. A complete list of investment recommendations made during the past year is available upon request. Past performance is not an indication of future returns.

This information is distributed to recipients including AAM, any of which may have acted on the basis of the information, or may have an ownership interest in securities to which the information relates.  It may also be distributed to clients of AAM, as well as to other recipients with whom no such client relationship exists.  Providing this information does not, in and of itself, constitute a recommendation by AAM, nor does it imply that the purchase or sale of any security is suitable for the recipient. Investing in the bond market is subject to certain risks including market, interest-rate, issuer, credit, inflation, liquidity, valuation, volatility, prepayment and extension. No part of this material may be reproduced in any form, or referred to in any other publication, without express written permission.

May 31, 2013 by

The relationship between the oil and rail industries goes back over 100 years to the days of the Standard Oil Company, run by John D. Rockefeller.  Rockefeller offered the railroads a steady volume of business for a preferred rate.  Soon competitors either went out of business or were acquired by Standard Oil.  That close relationship deteriorated in the early 1900’s when a system of pipelines was built, which effectively eliminated the need for railroads to ship crude oil given the cost effectiveness of the pipelines.  It has only been in the last couple of years that the rail industry has, once again, proved its importance to the oil industry.  In this white paper, we will talk about why this has occurred and how important it is to the rail industry.  We will also debate the longer term prospects for the rail industry with a focus on a couple of expected trends.


The Growth in Oil-by-Rail Has Been Incredible

The growth in the shipment of crude oil-by-rail has boomed in the last couple of years as illustrated in Exhibit 1. In the U.S. alone, carloads have increased from 9,500 in 2008 to 233,811 in 2012.

Source: Association of American Railroads (AAR), Surface Transportation Board (STB), Raymond James research

Major advancements in drilling technology, especially horizontal drilling and hydraulic fracturing, coupled with attractive commodity prices have led to rapid crude oil production in major shale formations in North America, most notably the Bakken in North Dakota. Refineries are generally located on the Coasts and in the Gulf, far away from shale plays in the middle of the continent such as the Bakken. The ramp in production has left a huge demand for transport of crude oil given the lack of pipeline infrastructure currently available to move the oil from production sites to downstream facilities. Also, we expect the oil sands in western Canada will be a huge source of production in coming years. The extensive network of track (Exhibit 2) made railroads an easy solution to this problem.

Source: Association of American Railroads

Based on current data, railroads move about 10% of the oil production in the U.S. In some areas, such as the Bakken, rails transport about two thirds of the production.

In addition to transporting oil, rails also ship large amounts of frac sand (crush resistant sand used in the hydraulic fracturing process), cement, and casing to producers of oil and natural gas. According to Burlington Northern Santa Fe, every horizontal drilling rig requires about 40 railcars of materials. Rails also transport chemicals to producers of heavy oil which combine with the oil to allow for movement through a typical pipeline.

Many Advantages When Shipping by Rail

The vast rail footprint gives shippers the ability to move oil to almost any refinery in North America. This has become very important given changing demand factors and pricing opportunities in different regions of North America. For example, a refinery on the East Coast, which historically has bought Brent crude oil barged in from the North Sea, has switched to West Texas Intermediate (WTI) oil. Even with the extra cost of transporting WTI by rail, the lower cost of WTI versus Brent still leaves the refinery at a cost advantage.

Movement of oil by rail is quick. In unit train configurations, which translate into about 72,000 barrels of crude oil, transit time is about five to six days for travel from the Bakken to the U.S. Gulf Coast compared to about 40 days for a pipeline. In addition, new infrastructure (loading and unloading terminals) for railroads can be built in a matter of months while building a pipeline can take years to complete. These factors make it much easier for the oil and gas industry to respond to production issues and price discrepancies.

Typical contracts for railroads are one to five years compared to ten to twenty year take-or-pay contracts for pipelines. This allows small to medium sized producers with a lack of financial resources to secure transportation at a reasonable cost. This also increases flexibility for producers given volatile commodity markets and offers protection against pipeline operating problems.

Product purity and efficiency is higher when using rails. Products are not mixed when moved by rail. Refiners have lower risk of contamination and are able to target certain grades of oil. In addition, diluents are not needed to transport heavy oil given the use of heated tank cars. When transporting heavy oil, pipelines require mixing with chemicals or lighter oil which can account for about 30% of the volume. This requires additional cost and time for separation at the refinery.

Rails do not have the same regulatory issues that pipelines confront. Pipelines need to cross extensive environmental hurdles when being built. In addition, there are substantial geographic obstacles when building a new pipeline especially in heavily populated, urban areas such as the East Coast.

The biggest disadvantage for rail transport of oil is the cost. The typical cost of moving crude oil from the Bakken to the Gulf Coast by rail is $14 to $19 per barrel compared to $7 to $11 per barrel using a pipeline. There are more components involved when shipping oil by rail including getting the oil to the uploading facility, transferring the oil to tank cars, leasing the cars, and off-loading the oil once the tank cars get to the refinery. In addition, with more “touches” there are more opportunities for problems to occur.

Impact on Railroad Industry is Growing

For the railroad industry, the risk/cost is minimal as the majority of capital is borne by the midstream and refining companies. Numerous participants in these sectors have been actively investing in infrastructure, including new transload facilities and tank cars. These costs come at a fraction of the cost of building a new pipeline which can run into the billions of dollars. The railroad industry needs to maintain the tracks and locomotives, which also comes at a cost; but, of course, are also used to ship other products.

All of the large railroad companies are benefitting from the oil-by-rail craze, especially those operating in the west where the Bakken resides. Exhibit 3 is a chart of the Class 1 rails and their percentage of business coming from the transport of petroleum products which includes crude oil, gasoline, and other related products. When you exclude intermodal traffic (only look at commodity business), the impact is much more significant. For the first quarter of 2013, petroleum products accounted for 5.6% of commodity carloads compared to 1.8% for the fourth quarter of 2007.

Source: Association of American Railroads, Barclays Research estimates

The same developments that have helped the railroad industry with the growth of oil-by-rail have hurt the rail’s coal business. The energy industry has produced a lot of natural gas which has resulted in low gas prices that are now competitive with coal prices. As a result, the railroad industry has lost a lot of carloads of coal to natural gas as electricity generation has switched to natural gas. While this continues to hurt the rails, the transport of crude-by-rail has eased the pain and in some quarters completely offsets lower coal shipments, as shown in Exhibit 4. We also account for added shipments of frac sand due to the oil-by-rail craze.

Source: Association of American Railroads, AAM

Over the next two to three years we feel confident that the oil-by-rail story will continue to be strong. As shown in Exhibit 5, pipeline capacity is expected to be tight as production growth stays strong. This leaves little room for delays or operational errors and bodes well for improving oil carloadings.

Source: Association of American Railroads, Canadian Association of Petroleum Producers, Raymond James research

According to Raymond James, U.S. and Canada carloads of oil are expected to more than double in three years from 281,022 in 2012 to 772,527 in 2015. This would represent a much more significant piece of the pie for the rails especially given our expectation of strong margins for this business. There are several things that could slow down this growth including limited tank car availability, less than expected loading and unloading capacity, and environmental concerns. Bigger picture, we would expect that volumes of oil shipped by rail would fall if oil prices were to drop significantly from current levels as producers might cut production.

Longer Term Impact Vary

This oil-by-rail trend is very fluid driven by a number of different factors. Longer term, we do not expect rails to replace pipelines but to serve more as a complement. The pipelines have an unbeatable cost structure which will help them regain market share once the system is up and running. We believe that the rail industry has proven itself in a short amount of time as a legitimate source of crude oil transportation. The rails offer a good source of diversification for producers and users of crude oil. The large amount of investment in the oil-by-rail platform by the refining and midstream industries makes us feel comfortable that this is not just a passing fad. In some geographic areas (East Coast) we expect the oil-by-rail story to remain strong and for some products (Alberta Oil Sands) we believe the competition with pipelines will still be compelling.

One area to watch longer term is movement of oil-by-rail to the coasts. We are already seeing this ramp up, especially in the East, as pipeline capacity is low and expected to be limited in the future. Coastal refineries are taking advantage of lower cost shale oil while displacing more expensive foreign waterborne crude imports. In addition, the oil shipped from the Bakken is higher quality oil which is more easily processed and more environmentally friendly, key demands for these particular refineries. New pipeline capacity and changing pricing dynamics will have a lot to do with the direction of oil transport across North America. As new pipelines are constructed on route to the Gulf Coast, we believe that a glut of oil will hit that will discount the local oil price of Light Louisiana Sweet (LLS). Producers of oil will be incentivized to ship oil to the coasts where the benchmark is Brent, which we expect will be significantly higher than LLS.

As mentioned before, we expect production of Canadian heavy oil to be very strong in the near to intermediate term. We expect that a lot of that oil will end up in the Gulf Coast. That grade of oil works well with the more advanced refineries in that region. New pipelines running through the middle of the United States will facilitate the transport of that oil. In addition, oil imported from Mexico and Venezuela continues to be on the decline which will free up refining capacity. There are a couple of extra costs associated with the shipment of this heavy oil via pipeline. First, is the volume penalty. A chemical, called diluent, has to be added to this heavy oil to enable movement through a pipeline. For example, 40 barrels of diluent would need to be added to 100 barrels of heavy oil. So transportation costs are based on 140 barrels not 100 barrels raising costs by 40%. The other major cost is getting the actual diluent, which many producers in Canada may have to import from the southern U.S. Therefore, producers are effectively shipping 180 barrels which raises the cost by a total of 80%. This makes the shipment of this heavy Canadian oil by rail much more cost competitive as the rail industry uses heated tank cars which do not require the addition of a diluent.

Oil-By-Rail Has Neutral to Positive Implications for Our Credit Outlook

From a credit perspective, we continue to be positive on the railroad industry. The rails have grown into a better diversified and more efficient mode of transportation. The industry has gained market share and profits from pricing opportunities given the cost benefit advantage enjoyed by shippers. We expect volumes to follow U.S. GDP as the rail industry ships most of the everyday items used by the typical consumer. While we don’t believe that the oil-by-rail opportunity is a game changer, we think it can only help the bottom line for all of the class 1 rails. As explained above, the boost to the railroad’s oil business comes at a good time given disappointing results from coal. In the short to intermediate term, we expect the oil business for rails to be a much bigger part of the overall business than ever before assuming the price of oil stays relatively high and production remains robust. In terms of credit ratings, we expect the rail industry to migrate into the high-triple-B to low-single-A category. The OAS of the sector is almost on top of the broader set of industrials. We have assigned an attractive relative value recommendation to the rail industry given our expectation of fundamental improvements and spreads that should trade significantly through industrials.

Michael J. Ashley
Vice President, Corporate Credit


For more information, contact:

Colin T. Dowdall, CFA
Director of Marketing and Business Development
colin.dowdall@aamcompany.com


1 “Moving Crude Petroleum by Rail,” Association of American Railroads,(December 2012):1, accessed May 8, 2013, https://www.aar.org/keyissues/Documents/Background-Papers/Moving%20Crude%20Petroleum%20by%20Rail%202012-12-10.pdf
2 “Moving Crude Petroleum by Rail,” 4.
3 Justin Yagerman, Robert Salman, CFA, and Joshua Katzeft, “Takeaways from Houston Crude By Rail Summit,” Deutsche Bank Markets Research: Crude by Rail Update (March 4, 2013): 2.
4 Steven P. Hansen, CMA, CFA, Patrick Tyler Brown CFA, Arthur W. Hatfield, CFA, et al., “Crude Oil Comes of Age: Walk, Run, Sprint: Positioning for the Marathon,” Raymond James Global Research: Transportation and Energy Industry Report (March 25, 2013): 5.
5 Steven P. Hansen, CMA, CFA, Patrick Tyler Brown CFA, Arthur W. Hatfield, CFA, et al., “Crude Oil Comes of Age: Walk, Run, Sprint: Positioning for the Marathon,” 5.
6 Steven P. Hansen, CMA, CFA, Patrick Tyler Brown CFA, Arthur W. Hatfield, CFA, et al., ., “Crude Oil Comes of Age: Walk, Run, Sprint: Positioning for the Marathon,” 6.
7 Steven P. Hansen, CMA, CFA, Patrick Tyler Brown CFA, Arthur W. Hatfield, CFA, et al., “Crude Oil Comes of Age: Walk, Run, Sprint: Positioning for the Marathon,” 31.
8 Steven P. Hansen, CMA, CFA, Patrick Tyler Brown CFA, Arthur W. Hatfield, CFA, et al., “Crude Oil Comes of Age: Walk, Run, Sprint: Positioning for the Marathon,” 14.


Disclaimer: Asset Allocation & Management Company, LLC (AAM) is an investment adviser registered with the Securities and Exchange Commission, specializing in fixed-income asset management services for insurance companies. This information was developed using publicly available information, internally developed data and outside sources believed to be reliable. While all reasonable care has been taken to ensure that the facts stated and the opinions given are accurate, complete and reasonable, liability is expressly disclaimed by AAM and any affiliates (collectively known as “AAM”), and their representative officers and employees. This report has been prepared for informational purposes only and does not purport to represent a complete analysis of any security, company or industry discussed. Any opinions and/or recommendations expressed are subject to change without notice and should be considered only as part of a diversified portfolio. A complete list of investment recommendations made during the past year is available upon request. Past performance is not an indication of future returns.

This information is distributed to recipients including AAM, any of which may have acted on the basis of the information, or may have an ownership interest in securities to which the information relates. It may also be distributed to clients of AAM, as well as to other recipients with whom no such client relationship exists. Providing this information does not, in and of itself, constitute a recommendation by AAM, nor does it imply that the purchase or sale of any security is suitable for the recipient. Investing in the bond market is subject to certain risks including market, interest-rate, issuer, credit, inflation, liquidity, valuation, volatility, prepayment and extension. No part of this material may be reproduced in any form, or referred to in any other publication, without express written permission.

April 9, 2013 by

The US banking sector is currently characterized by good credit fundamentals and supportive technicals. A key risk offsetting this credit strength is the prospect of a new bank resolution regime (Orderly Liquidation Authority) imposed by regulators. Of particular interest to bank creditors is the possibility that a resolution regime imposes mandatory bail-in requirements on bank capital structures and mandates minimum levels of bank bond issuance. This article will examine the potential form of such a regime, direct implications for bank bond investors and a review of how we are positioning insurance portfolios in advance of a formal proposal from regulators.


What is Orderly Liquidation Authority?

Orderly Liquidation Authority (“OLA”) was created by the Dodd-Frank Wall Street Reform and Consumer Protection Act of 2010 (the “Act”).  OLA authorizes the creation of a resolution regime for the purpose of receivership and orderly liquidation of a failing financial institution(s) whose collapse would endanger the US economy.  The Act explicitly prohibits the use of taxpayer funds to prevent such liquidation, and instead mandates liquidation of any institution placed into receivership.  The Act delegates responsibility for creation and administration of a resolution regime to the US financial regulators.

At its heart, OLA is meant to provide regulators the means to wind-down systemically important financial institutions that are in danger of failing in a disorderly manner such that the broader economy is damaged (i.e., another Lehman).  The goal of OLA is to maintain the stability of the financial system while removing the perceived moral hazard that was created by the government bail-outs that occurred during the 2008 global financial crisis (TARP /AIG bail-out).

OLA Details? (You’ll have to be patient…)

When OLA became the law of the land in July 2010, it authorized financial regulators (Federal Reserve, SEC, FDIC, and the Federal Insurance Office) to create a detailed resolution regime which would be proposed to the Secretary of the Treasury.  Nearly three years later, we continue to wait for a proposal.  However, over the past year, regulators have begun to float trial balloons in the form of public speeches and investor outreach meetings, leading us to believe that a Notice of Proposed Rulemaking (NPR) is likely to be issued later this year.

While many details of the emerging OLA regime remain to be disclosed (formulated?), key aspects that have been shared include the regulators’ preference for single-entry receivership at the bank holding company level and the use of capital structure bail-in (write-down of the capital structure) as an alternative to tax-payer funded bail-outs.

Single-entry receivership is the concept of taking control of a failing financial institution at the bank holding company level while allowing the operating subsidiaries to continue normal operations.  Under this approach, the capital structure of the holding company is impaired, potentially all the way up to senior unsecured creditor level, in order to re-capitalize the operating subsidiaries (See Exhibits 1 and 2).  Interim subsidiary operations would be funded by a secured line of credit from the Treasury.  And importantly, the process would benefit from a bankruptcy stay, preventing creditors and trading counterparties from accelerating bank liabilities or seizing collateral.

Source: Wells Fargo Securities and FDIC Presentation – Title II Strategy Overview


Source: Wells Fargo Securities and FDIC Presentation – Title II Strategy Overview

The secured liquidity and bankruptcy stay are critical aspects of the single-entry process.  The liquidity facility allows the distressed institution to continue operations (market making/collateral posting) in the normal course of business.  At the same time, preventing counterparties from breaking derivatives contracts (no default/change of control) or creditors from declaring default (bankruptcy stay) allows the institution to continue as a “going concern.”  These assumptions are theoretical, however, and it remains to be seen whether an institution taken into receivership would be able to maintain franchise value or whether it would face a rapid loss of business.

Unanswered Questions Regarding OLA

Key uncertainties that remain to be determined in any prospective OLA regime include:

  • Which institutions will be subject to OLA? – At a minimum, we expect the four large money center banks (Bank of America, Citigroup, JPMorgan, and Wells Fargo), the two largest broker/dealers (Goldman Sachs, Morgan Stanley) and the two largest custody banks (Bank of New York, State Street) to be included.  Of particular interest is whether the next tier of banks fall within the scope of OLA (US Bancorp, PNC Financial, SunTrust) or even all banks regulated by the Fed (those exceeding $50 billion in assets).
  • What is the trigger for OLA? – Understanding the criteria that regulators would use to implement the OLA regime with a subject financial institution and the discretion they have in implementing the regime will be critical to analyzing the sector going forward.  Minimum capitalization levels have been used as triggers for contingent capital instruments issued in the European Union (i.e., Conversion/write-down triggered when Tier I capital falls below 7%), but clarity on solvency/liquidity driven triggers will be needed as well (After all, Lehman was “well capitalized” when it failed in September 2008).
  • Which parts of the capital structure will be subject to bail-in? – Other jurisdictions that are contemplating resolution regimes (United Kingdom, Switzerland, Germany and the European Union) have taken different approaches to bail-in.  Some countries have designated certain levels of the capital structure as being subject to impairment if a financial institution approaches failure (i.e., Swiss Contingent Convertible Notes or the UK’s Primary Loss Absorbing Capital) while others have stated that the entire capital structure is subject to “hair-cut” (Germany/Denmark).  Which approach the US takes will have material implications for both cross-sector and intra-capital structure relative value.

As envisioned, bail-in of bank bonds would transform that portion of the capital structure from a funding instrument into a capital instrument.  While subordinated bonds, hybrids and preferred securities have always fallen on a spectrum between funding and capital, the imposition of bail-in on senior unsecured would be a fundamental change.  Bank bond spreads have tightened to parity vs. comparable quality industrials over the past six months, after trading wide the previous five years (Exhibit 3).  The main risk to bank bond investors from the imposition of a bail-in regime is that the market adds a risk premium to all bonds in the sector to reflect the changed regulatory event risk, which would result in widening bond spreads.

Source: Barclays
Source: Barclays

Further, moving the decision to bail-in the capital structure into the scope of regulator discretion (and the associated bankruptcy stay) would also raise uncertainty surrounding a credit as it fell into distress. This raises the probability of investors running for the exit at the first sign of trouble; an issue that we are uncertain the regulators fully appreciate. Bank bonds have clearly been more volatile than the Barclays Corporate Index since the 2008 financial crisis, but the prospect of bail-in would likely prolong and possibly exacerbate this phenomenon.

Related to the risk associated with imposing bail-in, regulators have also pondered imposing minimum bank holding company debt levels. A minimum debt requirement would assure that a bank’s capital structure is of sufficient size to absorb the impairment necessary to re-capitalize its operating subsidiaries in a bail-in scenario. A key factor in the outperformance of bank bonds over the past three years has been the technical benefit from a shrinking overall universe of bank bonds as maturing issues were funded by deposits rather than refinanced (Exhibit 4). The prospect of increased issuance (as well as increased holding company debt leverage) imposed by OLA would likely set a floor for bank bond spreads, if not resulting in outright spread widening.

Source: Barclays
Source: Barclays

How Are We Positioning for OLA

Although many of the critical details will not be available until the Fed releases its Notice of Proposed Rulemaking, there are a number of ways to position clients within the bank sector.  This positioning is based on the assumption that an OLA regime including some form of bail-in is a certainty.  We cannot justify dis-investing in the sector on the basis of the possibility of a bail-in regime which raises the possibility of spread widening.  However, there are three concrete steps we can take:

  1. Avoid holding company subordinated debt – This insulates our portfolios against the possibility that bail-in applies only to subordinated portion of the capital structure, as well as the possibility that additional issuance is mandated.
  1. Favor bank level issuance over holding company issuance – Under single-entry receivership, only holding company bonds should be eligible for bail-in (in order to avoid broader financial system dislocation).  As such, even bank level subordinated paper should be insulated from bail-in under an OLA regime, offering a reasonable relative value alternative to holding company senior unsecured bonds.
  1. Avoid bank capital securities – It has become clear that the junior portion of the capital structure is viewed as “bail-in eligible” by regulators, even before Dodd-Frank Act introduced the concept of OLA (recall Citigroup’s 2009 exchange).  However, it appears that capital securities still trade based on cost of funds (as opposed to cost of capital) as demonstrated by the clear correlation between senior unsecured and subordinated debt.
Source: Barclays
Source: Barclays

Conclusion

The expected announcement of OLA details is the most prominent domestic event risk for the bank sector over the near-term.  However, until a formal proposal is released by the regulators, the ultimate impact of OLA on bank fundamentals and relative value is tough to discern.  It is also possible the bank spreads already reflect the potential negative impacts of OLA, and the formal proposal will serve as a catalyst for further tightening.  We continue to position our clients in holding company senior unsecured and bank level subordinated bonds which we believe offer the best combination of relative value and defensiveness within the sector.  Ultimately, we believe strong underlying fundamentals and the likelihood of an extended adoption period should offset credit impact of OLA, but investors should be prepared for the possibility of near-term volatility.

N. Sebastian Bacchus, CFA
Vice President, Corporate Credit


For more information, contact:

Colin T. Dowdall, CFA
Director of Marketing and Business Development
colin.dowdall@aamcompany.com


Disclaimer: Asset Allocation & Management Company, LLC (AAM) is an investment adviser registered with the Securities and Exchange Commission, specializing in fixed-income asset management services for insurance companies. This information was developed using publicly available information, internally developed data and outside sources believed to be reliable.  While all reasonable care has been taken to ensure that the facts stated and the opinions given are accurate, complete and reasonable, liability is expressly disclaimed by AAM and any affiliates (collectively known as “AAM”), and their representative officers and employees.  This report has been prepared for informational purposes only and does not purport to represent a complete analysis of any security, company or industry discussed. Any opinions and/or recommendations expressed are subject to change without notice and should be considered only as part of a diversified portfolio. A complete list of investment recommendations made during the past year is available upon request. Past performance is not an indication of future returns.

This information is distributed to recipients including AAM, any of which may have acted on the basis of the information, or may have an ownership interest in securities to which the information relates.  It may also be distributed to clients of AAM, as well as to other recipients with whom no such client relationship exists.  Providing this information does not, in and of itself, constitute a recommendation by AAM, nor does it imply that the purchase or sale of any security is suitable for the recipient. Investing in the bond market is subject to certain risks including market, interest-rate, issuer, credit, inflation, liquidity, valuation, volatility, prepayment and extension. No part of this material may be reproduced in any form, or referred to in any other publication, without express written permission. 

  • « Go to Previous Page
  • Page 1
  • Interim pages omitted …
  • Page 5
  • Page 6
  • Page 7
  • Page 8
  • Page 9
  • Go to Next Page »

Get updates in your inbox.

  • Investment Strategies
    • Investment Grade Fixed Income
    • Specialty Asset Classes
  • Our Clients
    • Client Experience
    • Sample RFP Download
  • Insights
    • Video
    • Webinar
    • News
    • Podcasts
  • About
    • Our Team
    • Contact
    • Client Login

Disclaimer: Asset Allocation & Management Company, LLC (AAM) is an investment adviser registered with the Securities and Exchange Commission, specializing in fixed-income asset management services for insurance companies. Registration does not imply a certain level of skill or training. This information was developed using publicly available information, internally developed data and outside sources believed to be reliable. While all reasonable care has been taken to ensure that the facts stated and the opinions given are accurate, complete and reasonable, liability is expressly disclaimed by AAM and any affiliates (collectively known as “AAM”), and their representative officers and employees. This report has been prepared for informational purposes only and does not purport to represent a complete analysis of any security, company or industry discussed. Any opinions and/or recommendations expressed are subject to change without notice and should be considered only as part of a diversified portfolio. A complete list of investment recommendations made during the past year is available upon request. Past performance is not an indication of future returns. This information is distributed to recipients including AAM, any of which may have acted on the basis of the information, or may have an ownership interest in securities to which the information relates. It may also be distributed to clients of AAM, as well as to other recipients with whom no such client relationship exists. Providing this information does not, in and of itself, constitute a recommendation by AAM, nor does it imply that the purchase or sale of any security is suitable for the recipient. Investing in the bond market is subject to certain risks including market, interest-rate, issuer, credit, inflation, liquidity, valuation, volatility, prepayment and extension. No part of this material may be reproduced in any form, or referred to in any other publication, without express written permission. *All figures shown are approximate and subject to change from quarter to quarter. **The accolades and awards highlighted herein are not statements of any advisory client and do not describe any experience with or endorsement of AAM as an investment adviser by any such client.

Copyright © 2024 AAM | Privacy and Disclosures

  • LinkedIn
  • YouTube