• Skip to primary navigation
  • Skip to main content
  • Skip to footer
AAM CompanyTransparent Logo

AAM Company

AAM Company Website

  • Investment Strategies
    • Investment Grade Fixed Income
    • Specialty Asset Classes
  • Clients
    • Our Clients
    • Client Experience
    • Download Sample RFP
  • Insights
    • Video
    • Webinars
    • Podcasts
    • News
  • About
    • Our Team
    • Events
  • Login
  • Contact Us
Contact

Sector Commentary

November 20, 2012 by

Thanksgiving is here and Christmas is right around the corner. This is a very important time of year for the retailers as up to 40% of annual revenues are realized during the holiday season. The retail industry has performed well this year despite concerns stemming from the fiscal cliff situation and continued low growth in the U.S.  Various analysts and trade organizations predict that holiday sales will be up anywhere from 2% to 4%. We believe that sales for this year will come in at the upper end of that range. The following article explores some of the more important drivers of our analysis.


The Consumer’s Economic Position Is Improving but Big Issues Remain

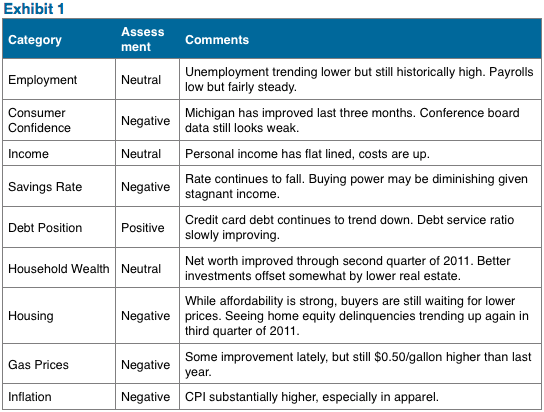
The most important driver of retail sales is linked to the strength of the consumer. The following table (Exhibit 1) summarizes our analysis of nine different factors which illustrate the typical consumer’s economic position. We make an assessment of the individual factors based on a comparison to last year and to a longer term history.

Source: AAM
Source: AAM

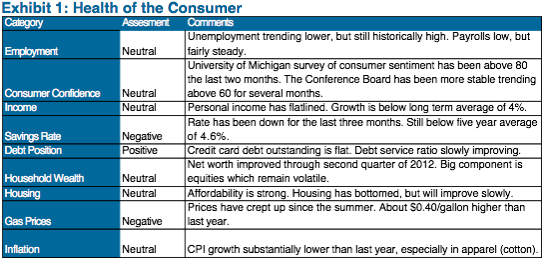
These factors are more positive than last year. We moved from “negative” to “neutral” positions in consumer confidence, housing, and the inflation categories. Looking ahead to developments in Washington, DC, the prospect of lower income from the expiration of the payroll tax cut and jobless benefits are key issues on the minds of consumers. A resolution, in the near term, could impact retail sales. In addition, GDP in the U.S. has tapered off throughout the year and is not expected to be significantly better in 2013.

Statistical Analysis – Purely Quantitative But Continues to Support the Case

Looking back at data over the last twenty years reveals a significant correlation (73%) between “Back to School” retail sales (August and September) and “Holiday” sales (November and December). To complete this analysis, we used the Bloomberg Same Store Sales Composite Index which includes a variety of retailers in the department store, discounter, and specialty subsectors. The model predicts “Holiday” sales of 4.3% when using 5.2% for the “Back to School” sales observed in 2012. This would be significantly better than the average, which was 3.0% over those twenty years.

Seasonal Hiring Resembles Last Year

The National Retail Federation predicts that between 585,000 and 626,000 seasonal workers will be hired this year. This compares to 607,500 last year and is well below the pre-recession numbers which were closing in on 700,000. According to another survey, 39% of employees plan to make some of their seasonal hiring permanent which is up from 30% last year.

Better Inventory and Margins Create Pricing Flexibility

Consumer shopping patterns are not expected to be significantly different this year. Consumers are focused on finding good values/deals which will result in significant promotion activities from stores. We expect a similar buzz around “door busters” and late night/early morning shopping. This year, we believe that retailers are in a better inventory position than last year. We take a look at inventory growth (year/year) in the second quarter and third quarter for the largest retailers in the U.S. over the past three years (Exhibit 2). As you can see, the average growth is significantly down from the last couple of years.

Source: AAM, Bloomberg

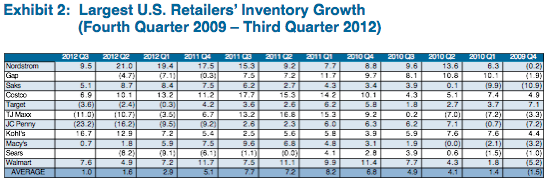
As a result, we expect retailers will need to price competitively, but may not have to resort to “fire sale” pricing versus last year. We expect retail margins to be stronger going into the end of year as overall costs have come down. In particular, retailers were able to benefit from lower cotton prices earlier in the year when orders for holiday merchandise were made. All in all, it does not appear that retailers are increasing volume to drive sales as was the case last year. If the retailers get the sense that sales are trending below expectations, they have the ability to adjust pricing given a stronger margin position this year versus last year.

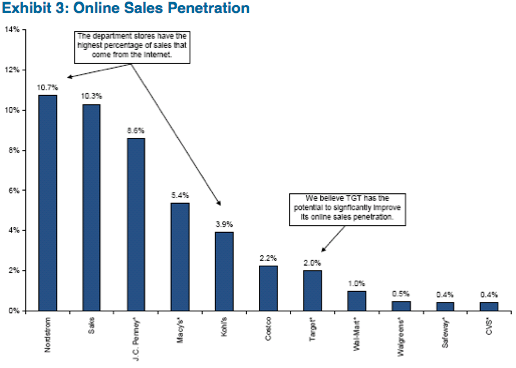
Online Shopping Continues to Gain Importance

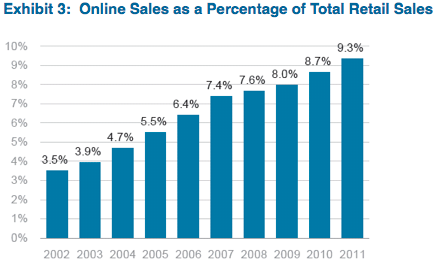
Cyber-shopping will, once again, be very important this year. We continue to see the push from brick and mortar retailers to enhance their online shopping capabilities. This year, we have heard retailers will match online pricing from retail websites, including pure online retailers such as Amazon.com. Wal-Mart has a new system that checks online pricing every 20 minutes. Last year, online sales were up 14% in November and December. According to a survey by the National Retail Federation, 51.8% of consumers are expected to shop online the year compared to 46.7% last year. The importance of having a strong online interface for retailers is increasing. Exhibit 3 shows that online sales as a percent of total retail sales are growing.

Source: US Census Bureau Retail Sales; comScore eCommerce Sales

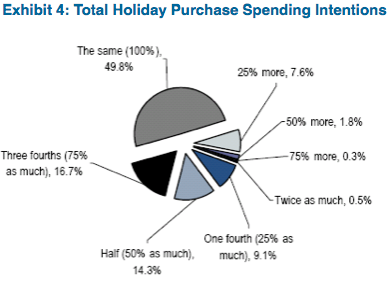
NPD Survey Is Positive for 2012 Holiday Sales

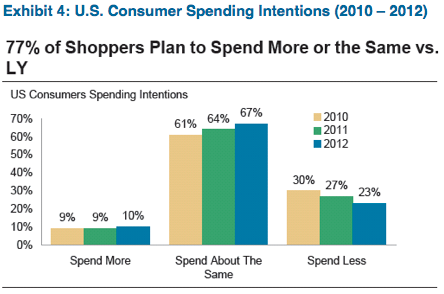
According to a recent survey by the NPD Group, consumers are expected to spend more this holiday season. An estimated 77% of shoppers are expected to spend more or the same this year, compared to 73% last year and 70% in 2010. These findings represent over 3,600 completed surveys.

Screen Shot 2016-01-27 at 11.10.08
Source: NPD Group; Morgan Stanley Research

Weather and Nuances of the Holiday Calendar Should Help

Weather and the changing calendar are always important factors for holiday spending. Last year was one the warmest holiday shopping seasons on record which impacted seasonal items (i.e., coats, scarfs), which are more important to the department store segment. This year, November is expected to be similar to last year, and December is expected to be significantly colder. This should be a positive driver, assuming that a heavier than normal amount of snow does not keep shoppers from driving.

While very unpredictable, a serious weather event can dramatically impact retail sales. We saw this in the first week of November in the Northeast with Hurricane Sandy. Citigroup estimates that same store sales for the department stores will be negatively impacted by 1.5% to 2.5%.  While discounters could experience a slight benefit as much as 1.0%, as stock-up and restocking trips offset the lost traffic during the storm. There should be enough time until the end of the year for retailers to recapture those lost sales as homeowners in those areas receive insurance and begin to rebuild. Having said that, it is still very early in that process to know how spending will ultimately be impacted. It’s not unreasonable to assume that many families in those areas will spend less this holiday season.

The days between Thanksgiving and Christmas are key shopping days. This year, those days total 32 versus 30 last year. In addition, this year Christmas falls on Tuesday (It was on Sunday last year), which gives shoppers an extra day to shop on the weekend. We expect the changing calendar will positively affect the retailers.

Summary

The above analysis helps to support a more optimistic opinion on retail sales for this year.  We recognize there are some major issues that are coming to a head in the near term including the fiscal cliff, which could have a dramatic impact on consumer spending. Our analysis is based on our assumption that the fiscal cliff issues will be diluted by “kicking the can down the road.” In addition, if the issue goes to the 11th hour (end of December) as we expect, then holiday sales will have already happened. While this is a major issue on consumers’ minds, it doesn’t appear that spending is being held back today. This issue becomes more of a concern for consumer spending if it does not appear that some type of resolution will be met as we head to the end of the year. Finally, we may see downward pressure on sales in the northeast as those areas recover from Hurricane Sandy. This could have a significant impact on spending this holiday season.

Michael J. Ashley
Vice President, Corporate Credit


For more information, contact:

Colin T. Dowdall, CFA
Director Marketing and Business Development
colin.dowdall@amcompany.com


1 NRF’s 2012 Holiday Survival Kit: Holiday Forecasts, Consumer Trends and Historical Retail Sales Data, National Retail Foundation, page 6
2 Adams, Susan. “Who’s Hiring The Most This Holiday Season,” Forbes, November 6, 2012, https://www.forbes.com/sites/susanadams/2012/11/06/whos-hiring-the-most-this-holiday-season-2/
3 Lorriane Hutchinson, Robert Ohmes, and Denise Chai, “2012 Holday preview: The Grinch may not steal Christmas,” Bank of America Merrill Lynch Industry Overview – Retailing, October 16, 2012, page 16.
4 Liz Dunn and Laurent Vasilescu, “Holiday Preview: O’Christmas Trade, O’Christmas Trade, the Year Can Still Be Salvaged,” Macquaire Capital (USA) The Equities Research Specialist, October 22, 2012, page 3.
5 Deborah Weinswig, Nathan Rich, Tifany Kanaga, and Ashley Hartigan, October Same Store Sales Review, Citi Research-Equities, November 2, 2012, page 4.


Disclaimer: Asset Allocation & Management Company, LLC (AAM) is an investment adviser registered with the Securities and Exchange Commission, specializing in fixed-income asset management services for insurance companies. This information was developed using publicly available information, internally developed data and outside sources believed to be reliable.  While all reasonable care has been taken to ensure that the facts stated and the opinions given are accurate, complete and reasonable, liability is expressly disclaimed by AAM and any affiliates (collectively known as “AAM”), and their representative officers and employees.  This report has been prepared for informational purposes only and does not purport to represent a complete analysis of any security, company or industry discussed. Any opinions and/or recommendations expressed are subject to change without notice and should be considered only as part of a diversified portfolio. A complete list of investment recommendations made during the past year is available upon request. Past performance is not an indication of future returns.

This information is distributed to recipients including AAM, any of which may have acted on the basis of the information, or may have an ownership interest in securities to which the information relates.  It may also be distributed to clients of AAM, as well as to other recipients with whom no such client relationship exists.  Providing this information does not, in and of itself, constitute a recommendation by AAM, nor does it imply that the purchase or sale of any security is suitable for the recipient. Investing in the bond market is subject to certain risks including market, interest-rate, issuer, credit, inflation, liquidity, valuation, volatility, prepayment and extension. No part of this material may be reproduced in any form, or referred to in any other publication, without express written permission. 

May 9, 2012 by

In 1827, the Baltimore and Ohio (B&O) Rail Road Company, now part of CSX Corporation, was capitalized with just $5 million. The railroad would stretch from the port of Baltimore to the Ohio River in Virginia. The B&O Rail Road moved goods from the Midwest to the East coast, putting it in competition with the transportation of goods to New York by way of the Erie Canal. The first “locomotives” were powered by a horse that walked on a treadmill which drove a series of gears and wheels. In the early 1800’s, this was considered a major advancement in technology. Today, the industry is a lot more complicated and the focus on technology and efficiency has intensified. As the world continues to grow, so will the demand for a better and more cost effective transportation system. We will explore how the North American rails have performed in recent history and will give some examples of how the industry is preparing for the future. If history is any indication of the future, we expect the railroad industry will continue to shape the development of the North American economy.


The freight railroads in North America form an integrated system with over 140,000 miles of track. Rails transport almost everything including the things that we, as consumers, rely on daily including food products that end up on our kitchen tables, coal used to generate electricity, and lumber used to build our homes. The rail system has become one of the most reliable, safest, and productive in the world. As the economy grows and goods in the U.S. become more global, the demand for cost efficient transport will increase. According to the Federal Highway Commission, U.S. freight shipments will increase from 16.9 billion tons in 2010 to 27.1 billion tons in 2040. In order to compete with other modes of transportation, including pipelines and trucks, rails will need to spend a tremendous amount of money on new and existing infrastructure. Over time, these investments have led to improved service levels which is a key ingredient for more favorable pricing.

The rails spend between 17%-20% of their revenues on capital expenditures, which is higher than most other industries. For the six largest rails in North America, this totals to about $14 billion per year. Similar to most other industries, it’s necessary for the rails to always strive to improve their competitive position and look forward to capitalize on budding opportunities. Given the industry’s financial results and other important measures of productivity/efficiency, we believe the large amount of money the industry has invested has been well spent. These business improvements can be accomplished in a number of different ways. We will start off by reviewing some specific measures of productivity and efficiency. Then we will provide some real examples of how dollars are being spent. We believe this will help explain the progress of the industry and why we continue to believe the rail industry will perform well.

Operational Performance

The major railroads report important financial and operational data on a regular basis which makes it easy to track the progress of the industry. We will explore some of this data in the next couple of pages.

Source: Bloomberg Data

Exhibit 1 shows three measures of performance for the railroad industry. The first is average train velocity (higher velocity is better). The second is dwell time, or time a railcar resides at a terminal (lower is better). The final is the average of the daily online inventory of freight cars (lower is better). As shown in Exhibit 1, for the last 40 weeks you can see that all of these measures have been going in the right direction. Better performance typically results in lower costs and higher profitability.

Source: Bloomberg Data

The graph in Exhibit 2 illustrates the industry’s attention to improving safety and minimizing the number of accidents, which is a direct result of enhanced employee training and applied leading edge technology. The personal injury frequency index is the number of reportable injuries per 200,000 man hours and the FRA (Federal Railroad Administration) train accident rate is the number of reportable train accidents per million train miles. A continued focus on safety should result in a more fluid rail network, less personal liability, lower cost structure, and the ability to maintain/enhance a high quality base of employees.

Source: Bloomberg Data

Fuel is a large portion of a railroad’s total costs. The ratio of fuel costs to revenue is about 10%. Over the last five years, the amount of revenue ton miles (RTM) per gallon of fuel consumed has trended up (shown Exhibit 3). One of the ways rails have been able to manage this cost is by investing in new locomotives which are much more energy efficient. In addition, one of the most important financial measures to focus on for the rail industry is the operating ratio (Exhibit 3). That ratio is calculated by taking operating expenses (includes labor, materials, fuel, and equipment) divided by revenues. We want to see this ratio getting smaller, which tells us that revenues are growing more quickly than the expenses.

Advancements in Technology

Now it’s time to give some examples of how the rails have been able to get these impressive results. One would not typically expect an age-old industry like the railroad industry to develop and implement the advanced technology that they use on a day-to-day basis.

One of those technologies is an acoustic detector system. Sensors placed on a railway help detect distinct sounds which might be the result of excess wear and tear on a specific piece of equipment. If that piece of equipment can be taken off-line and repaired before it creates a problem, like a derailment, a lot of time and money can be saved. Union Pacific uses special predictive software which analyzes data from acoustic and visual sensors. This kind of technology gives Union Pacific days or weeks notice before something is expected to go wrong. Major derailments can cost $20 – $40 million.

Another important technology uses ground penetrating radar (GPR) to look below the railway track substructure (rocks). Feedback from the radar and sensors is used to check for conditions which might compromise track stability, including excessive water and deteriorating terrain.

Canadian National Railway recently announced that the company will buy 200 super-insulated EcoTherm containers. These containers are specially insulated and eliminate the need for diesel engine powered heaters, which keep temperature sensitive products at a normal temperature for up to ten days. Goods shipped in one of these containers consume 8-11% less fuel than the traditional choice.

There have also been major developments in the area of locomotives. One technology uses special locomotives called distributed power units. These units operate in the middle and/or at the end of a line. This creates less force on the train which results in less wear and tear and higher fuel efficiency. Another new technology, GenSet locomotives, replace older traditional yard locomotives. GenSet uses several smaller engines as opposed to one large engine. This locomotive only uses the required amount of engines for specific tasks, resulting in better fuel efficiency. In the yard, these GenSet’s are expected to reduce fuel consumption by 37%. Some of these locomotives use remote control technology and have no cab.

These are just a few examples of ways that new technology has improved operational efficiency. Technology to look for in the future includes aerodynamic design improvements, rail lubrication processes, laser-based rail inspection systems, and the use of special metals which better resist wear and tear.

Growth Projects

The rail industry is not only spending a lot of money to modernize and improve its existing structure but it’s also spending billions of dollars a year to grow its current network. Expansion projects and the re-working of existing rail lines are key opportunities for growth and provide operational efficiencies.

One major project is called the Chicago Region Environmental and Transportation Efficiency Program (CREATE). This is a major collaboration between the City of Chicago, the State of Illinois, Metra, Amtrak, the U.S. Department of Transportation, and the major railroads. The project is expected to be completed in 2030 and cost $3 billion. The project will involve the construction of new overpasses/underpasses, upgrades to tracks, switches, signals, and improvements to crossing safety. The main goals are to improve service, reduce congestion, promote economic development, and improve the environment. Chicago handles about one quarter of North America’s freight rail traffic. Chicago has become a major bottleneck as the infrastructure was not built for the kind of volume experienced today. In the next 30 years, freight rail traffic is expected to double.  Without this project, $1-$7 billion could be lost in economic production on an annual basis.

The Crescent Corridor project is a partnership between Norfolk Southern and 13 states. It’s a rail infrastructure project stretching from the Gulf Coast to the East Coast, which is expected to be completed by 2020 and cost around $2.5 billion. Norfolk Southern will make changes that will enable the line to add more freight. These enhancements include the building of new track, straightening curves, adding signals, and building and expanding terminals. The project is expected to create 73,000 jobs by 2030, and is expected to save 170 million gallons of fuel while taking 1.3 million trucks off the highways annually.

Union Pacific is expected to spend about $400 million on a project to build a new rail facility in Santa Teresa, New Mexico. The project is expected to be completed by 2015. When the project is complete, the facility will include 200 miles of track and 26 buildings for yard operations including intermodal and fueling capabilities. This project should enhance the movement of goods throughout the southwestern United States and position Southern New Mexico as a critical component of the “Sunset Route”, as shown in the map in Exhibit 4 .

Source: Union Pacific

Investment in new and existing infrastructure and dedication to innovative technology are some of the most important ways that the railroad industry has been able to improve productivity and enhance profitability. As the economy expands and the demand for the cost efficient transportation of goods increases, we expect the rails to continue to find ways to respond to network demands while joining the vast global transportation network.

Michael J. Ashley
Vice President, Corporate Credit


For more information, contact:

Greg Curran, CFA
Vice President, Business Development
greg.curran@aamcompany.com


1 “An Overview of America’s Freight Railroads”, Association of American Railroads (October 2011):1.
2“An Overview of America’s Freight Railroads”, Association of American Railroads (October 2011): 3.
3 Michael Hickins, “Union Pacific Using Predictive Software to Reduce Train Derailments”, Wall Street Journal, March 30, 2012. Accessed April 17, 2012, https://blogs.wsj.com/cio/2012/03/30/union-pacific-using-predictive-software-to-reduce-train-derailments/
4 Michael Hickins, “Union Pacific Using Predictive Software to Reduce Train Derailments”, Wall Street Journal, March 30, 2012. Accessed April 17, 2012, https://blogs.wsj.com/cio/2012/03/30/union-pacific-using-predictive-software-to-reduce-train-derailments/
5 “CN Buys 200 EcoTherm Containers”, Environmental Leader (October 19, 2011):1, accessed April 27, 2012, https://www.environmentalleader.com/2011/10/19/cn-buys-200-ecotherm-containers/
6 “CN Buys 200 EcoTherm Containers”, Environmental Leader (October 19, 2011):1, accessed April 27, 2012, https://www.environmentalleader.com/2011/10/19/cn-buys-200-ecotherm-containers/
7 “Innovation and Employee Education Save Fuel,” Union Pacific (March 2012): 1
8 “Chicago: America’s Rail Hub,” Chicago Region Environmental and Transportation Efficiency (CREATE) Program, accessed April 17, 2012, https://www.createprogram.org/about.htm#need
9 “Chicago: America’s Rail Hub,” Chicago Region Environmental and Transportation Efficiency (CREATE) Program, accessed April 17, 2012, https://www.createprogram.org/about.htm#need
10 “Chicago: America’s Rail Hub,” Chicago Region Environmental and Transportation Efficiency (CREATE) Program, accessed April 17, 2012, https://www.createprogram.org/benefits.htm
11 “ Railroad Investment Projects Create Jobs, Stimulate Economy,” Freight Rail Works, accessed on April 17, 2012, https://freightrailworks.org/#economy/partners
12 “Union Pacific Railroad Begins Construction of $400 Million Rail Facility in New Mexico,” Union Pacific, accessed April 25, 2012, https://www.uprr.com/newsinfo/releases/capital_investment/2011/0808_santa_teresa.shtml


Disclaimer: Asset Allocation & Management Company, LLC (AAM) is an investment adviser registered with the Securities and Exchange Commission, specializing in fixed-income asset management services for insurance companies. This information was developed using publicly available information, internally developed data and outside sources believed to be reliable. While all reasonable care has been taken to ensure that the facts stated and the opinions given are accurate, complete and reasonable, liability is expressly disclaimed by AAM and any affiliates (collectively known as “AAM”), and their representative officers and employees. This report has been prepared for informational purposes only and does not purport to represent a complete analysis of any security, company or industry discussed. Any opinions and/or recommendations expressed are subject to change without notice and should be considered only as part of a diversified portfolio. A complete list of investment recommendations made during the past year is available upon request. Past performance is not an indication of future returns.

This information is distributed to recipients including AAM, any of which may have acted on the basis of the information, or may have an ownership interest in securities to which the information relates. It may also be distributed to clients of AAM, as well as to other recipients with whom no such client relationship exists. Providing this information does not, in and of itself, constitute a recommendation by AAM, nor does it imply that the purchase or sale of any security is suitable for the recipient. Investing in the bond market is subject to certain risks including market, interest-rate, issuer, credit, inflation, liquidity, valuation, volatility, prepayment and extension. No part of this material may be reproduced in any form, or referred to in any other publication, without express written permission.

April 18, 2012 by

Spain has come under pressure due to investor concerns about its worsening fiscal profile and struggling banking system. While the country is pursuing a program of fiscal consolidation, it will likely struggle to reignite economic growth and is expected fall into recession during 2012. As a result of twin funding pressures facing both the sovereign and the banking system, we believe Spain will need to turn to the European Union and the European Central Bank for support.


Spain is in the headlines again due to rising capital markets concerns about the country’s fiscal sustainability and the soundness of its banking system.  Spanish sovereign ten year bond yields, which had fallen as low 4.85% in February following the completion of emergency liquidity operations by the European Central Bank, have since risen above 6.00% (Exhibit 1).  This raises the risk that Spain’s economic problems will be compounded by unsustainably high funding costs, or even potentially a sovereign investors’ buyers strike.

Source: Bloomberg
Source: Bloomberg

In this “white paper,” we contemplate Spain’s fiscal profile, its banking system and the support mechanisms available to address a funding shortfall in the event Spain loses access to the capital markets.  We will conclude with a credit view on the impact on corporate bond markets should Spain be forced to turn to the European Union (EU), the European Central Bank (ECB), or the International Monetary Fund (IMF) for further support.

Sizing the Problem

Risking a much overused cliché, Spain really is “too big to fail” within the European context.  With a GDP of €1.07 trillion, Spain is the Eurozone’s fourth largest economy representing 11% of consolidated €9.4 trillion GDP (Greece, by contrast, accounted for 3%).

The inherent imbalances in the Euro system (common monetary policy/divergent fiscal policies) resulted in a real estate bubble in Spain over the past decade and a material increase in leverage at the government level, in the private sector and by the households.  As a result, Spain finds itself with unsustainable (and growing) government debt levels, a banking sector that is struggling to de-lever in the face of a burst real estate bubble and an economy that is expected to slip again into recession in 2012.

Spain’s Fiscal Profile

The economic recession that followed the global financial crisis in 2008 accelerated the fiscal imbalances within Spain.  A persistent structural budget deficit was aggravated by the recession (Exhibit 2), resulting in a rapid growth of Spain’s debt/GDP measure (Exhibit 3).

Source: Eurostat (Official Statistical Repository of the European Commission)


Source: Eurostat (Official Statistical Repository of the European Commission)

While successive Spanish governments have committed to reducing the structural budget deficit through austerity measures, the slowing economy has frustrated these efforts.  As a result, the  budget deficit which stood at -9.3% in fiscal year 2010 missed its fiscal year 2011 target of  -6.0% by a material margin, coming in at -8.5%.  The newly elected government reignited fears about fiscal sustainability in February 2012 when it announced Spain would miss its fiscal year 2012 deficit target of -4.4%.  And investors are generally skeptical about the revised target of -5.3%, which appears politically expedient, but economically difficult to achieve (Exhibit 4).

Source: Banco de Espana

Impediments to Growth

While Spain’s current debt/GDP level actually compares favorably to most of its Eurozone peers, the country’s lack of economic growth, as well as the potential need to support its banking system (more on this below) are the primary drivers of the capital market concerns that threaten its ability to refinance its substantial external debts.  While a resumption of economic growth will be key to ultimately reversing the deterioration in Spain’s fiscal profile, there are a number of factors impeding such growth.

The biggest challenge is Spain’s inflexible labor system, which makes it very difficult for employers to adjust their labor force through lay-offs.  The result has been persistently high unemployment, which spiked as a result of the 2009/2010 recession, but made companies reluctant to hire new employees as the country emerged from recession in 2011 (Exhibit 6).  Unemployment was also aggravated by the high proportion of the population involved in the Spanish construction industry, which has collapsed following the bursting of the country’s real estate bubble.  The imposition of successive austerity programs in an effort to close the budget deficit has further hurt employment in the public sector.  As a result, Spain has the highest unemployment rate in the Eurozone at 23%, and unemployment among those under 30 is nearly 45% (Exhibit 5).

Source: Eurostat (Official Statistical Repository of the European Commission)


Source: Eurostat (Official Statistical Repository of the European Commission)

The Spanish Banking System

Beyond the impact on employment levels, the collapse of the real estate bubble has left the Spanish banks with an outsized real estate loan book that is suffering from deteriorating asset quality due to the factors discussed above (recession/high unemployment).  Just to size the problem, the Spanish banking system had a total loan book of €1.8 trillion (equivalent to 180%  of GDP) at year end 2012 and non-performing loans (NPL) were €136 billion (7.6% of loans).  Against this, the Spanish banking system has loan loss provisions (LLP) of €108 billion and tangible common equity of €203 billion.

If the economy slips back into recession in 2012, NPLs across all loan classes are likely to grow, but real estate is of particular concern.  While the Spanish real estate bubble burst in 2008, real estate prices have fallen far less (down approximately 20-25%) than in other countries with collapsed real estate bubbles (i.e., United States, Ireland).  Residential mortgage loans stood at €657 billion (2.8% NPL) while corporate real estate (commercial real estate/real estate development companies) stood at €397 billion (20.1% NPL).  Estimates vary, but under the assumption that asset quality continues to worsen in the face of renewed recession and continued decrease in real estate prices, additional provisions required by the banks could range from €100 to €200 billion.  With a pre-provision profit generating capacity estimated in the €40-45 billion range, even an increase of provision expense of €100 billion would begin to erode the capital of the banking system.  As shown in Exhibit 7, Spanish banks already have a high proportion of NPL to LLP+ Tangible Common Equity (informally known as the Texas Ratio – as it approaches 100% the likelihood of bank failure also approaches 100%).

Source: Banco de Espana

Regulators have pushed for a consolidation within the banking sector, with stronger banks absorbing weaker banks. But, as we demonstrated with the consolidated bank system ratios above (and the experience of Japan during the ‘90s), such a strategy can only be taken so far before it cripples the entire system.  Spanish regulators have attempted to pre-empt this issue by changing bank provisioning standards to require a provision build of approximately €100 billion within the banking system.  However, given the limited capacity of the Spanish banks to generate capital organically or through private market capital increases, it is likely that a large portion of this increase will have to come from public sources.  To this end, the Spanish government has established the Fund for Orderly Bank Restructuring (FROB) which can provide public capital injections for struggling banks and has injected €14 billion in public capital to date.

However, given the persistent budget deficit and growing debt/GDP ratio, Spain can ill afford to inject a further €50-150 billion in capital.  With outstanding sovereign debt of €735 billion and a debt/GDP ratio that officially stood at 68% at year end 2011, every additional €50 billion of capital injected into the bank sector raises the ratio by five percentage points (and this is before contemplating the budget deficit and GDP contraction).

Spain’s Dual Liquidity Crunches (Squeezes/Crises?)

As a result of its fiscal and banking challenges, Spain faces dual liquidity squeezes on its access to sovereign funding in the bond market and bank funding in the deposit and wholesale markets.

Within the sovereign debt markets, this is reflected in Spain’s debt costs, with yields on existing debt rising above a 6% yield, reflecting sovereign investors’ unease over Spain’s fiscal sustainability.  Yields substantially above the country’s own GDP growth rate raise the question of long-term sustainability of the country’s debt load and aggravates the growing debt/GDP ratio.  At the extreme, the rising yields reflect growing unwillingness of sovereign debt investors to support Spanish debt.  With issuance needs of approximately €185 billion for 2012 (including €100 billion of short-term bills that must be refinanced), the potential that investors decline to purchase Spanish sovereign issuance raises the real prospect of a sovereign default.

The Spanish banking system has already effectively lost access to the wholesale funding markets and investors have pulled away from Spanish bank bonds on fears about the system’s solvency in the face of rising credit costs.  At the same time, retail and institutional deposits have been migrating from the Spanish banking system and into banking systems viewed as more stable (Germany/Netherlands/France).  A funding crisis has been averted only through reliance on the European Central Bank’s (ECB) emergency lending programs.  However, ECB liquidity is only a temporary solution, and its requirement for collateral against funding advanced is rapidly encumbering Spanish bank balance sheets (and effectively subordinating unsecured bond holders, thus further reducing the likelihood that they resume funding the banks).  Furthermore, while ECB liquidity stems concerns about an immediate bank failure,  it does nothing to address market concerns about the solvency of the Spanish banking system.

Crisis Fighting Options for Spain

While Spain would ideally prefer to address its sovereign funding and bank funding/solvency issues internally, it already appears that this option is not available.  At a minimum, the need for the banking system to access ECB liquidity is a tacit admission that Spain is unable to provide support.  There appear to be two options that Spain and the EU can utilize to tackle the current crisis:

  1. European Central Bank Liquidity – As noted above, the Spanish banking system is already accessing ECB emergency liquidity through the Longer-term Refinancing Operation (LTRO), through which the ECB provides unlimited three year loans to banks in return for collateral (paradoxically, the LTRO liquidity provided to the banks has largely been reinvested in Spanish sovereign debt, temporarily lowering Spanish sovereign yields, although this effect is temporary).  Additionally, the ECB has provided indirect liquidity support to struggling Eurozone sovereigns through its Security Market Purchase (SMP) program which purchases sovereign debt in the secondary market with the goal of reducing yields.  While the ECB has theoretically unlimited capacity to provide liquidity at both the banking and sovereign levels, practically these measures amount to a stopgap.  Regarding bank funding, we have already noted that the LTRO funding for banks is limited by the stock of eligible collateral, and cannot provide capital infusions to address solvency concerns.  And on the sovereign funding level, SMP has been highly controversial in the EU, with some nations (especially Germany) opposing it as a backdoor quantitative easing that could ultimately stoke inflation.  Because the SMP is not a formal support program that imposes fiscal conditions on borrowers, but rather an open market program, it is a temporary liquidity stopgap, rather than a formal tool for addressing fiscal imbalances.  To this end, the ECB Board has explicitly warned that the SMP should not be viewed as unlimited, and that addressing the fiscal challenges of the Eurozone must be undertaken at the governmental/fiscal level rather than being tackled by the monetary authority (ECB).
  1. EU Crisis Programs – Since the advent of the Eurozone crisis in mid-2010, the EU has established two separate funds to aid struggling sovereigns as they undertake fiscal consolidation.  The European Fiscal Stability Fund (EFSF) was intended as a temporary €440 billion fund.  The European Stability Mechanism (ESM) was established by treaty in 2011 as a €500 billion permanent replacement to the EFSF.  In an attempt to add credibility in the face of multiple sovereign crises during 2011, the EU agreed to accelerate the advent of the ESM to July 2012 (although the ESM has yet to be ratified by all EU members).  To date, three countries (Greece, Ireland and Portugal) have entered a fiscal consolidation plan with support from the EFSF/ESM programs (with varying success).  The use of EFSF/ESM programs to aid Spain through its sovereign and banking crises has several pros including: (a) flexibility to fund a defined program of fiscal consolidation, and (b) the ability to provide direct recapitalization of the Spanish banking sector, thus taking pressure off the sovereign.  However, there are also several hurdles to such an approach.  First, it would require an explicit Spanish request for assistance, and any program Spain entered into would require it to surrender a degree of sovereignty to the EU administrators of the program (and the new government has already expressed reservations about encroachment on Spanish sovereignty).  More practically, the EFSF/ESM programs are “committed” but unfunded, and would require substantial issuance of bonds jointly and severally guaranteed by all EU members.  This raises questions both of the market’s capacity for absorbing such funding needs (above and beyond what has already been committed to Greece/Ireland/Portugal).  Furthermore, the creditworthiness of the EFSF/ESM relies entirely on the credit of the underlying members, of which Spain is one of the larger members, raising questions about the creditworthiness of the EU as a whole.  Ultimately, the credibility of the EFSF/ESM rests in large part on the willingness and capacity of the EU’s strongest member, Germany, to support weaker EU members.  This appears ultimately to be political rather than financial question, and subject to domestic political and economic considerations.  We believe Germany will ultimately decide that it is in its own best interest to support its fellow EU members, but this outcome is by no means a certainty.

Conclusion: Expectations and Credit Implications

We believe that Spain likely will need to request formal support from the EU/ECB/IMF sometime during 2012 or 2013 (and potentially much sooner).  The likely form of support is via a negotiated program utilizing the EFSF/ESM (rather than continued ad hoc support through the ECB).  The most likely driver of the request in the near-term would be a continued rise in sovereign funding costs beyond the point of sustainability.  However, even in the event that funding pressures ease, Spain is likely to face increased pressure to enter a formal program, either from the ECB which is unlikely to provide permanent open ended funding for its banking system, or from the EU if it slips behind schedule on its fiscal consolidation program (which we believe is likely).

The resolution of Spain’s fiscal and banking challenges has credit implications for both Spain and the broader EU.  Failure to address Spain’s economy (and all of the struggling Euro area’s economies) in an orderly manner would ultimately threaten the existence of single currency, and could result in serious disruption to the European economy and financial system.  We believe that the most likely outcome is a collective agreement by EU members to preserve the currency while working through fiscal consolidation of the weaker economies.  Ultimately, this likely results in a greater degree of fiscal integration within the EU (a necessity if the single currency is to survive) and we do NOT rule out the possibility of further sovereign restructurings (in the mold of Greece) although that is not our default expectation with Spain (given their relatively stronger fiscal profile).  However, the challenge of achieving political consensus among the seventeen Euro currency members and the twenty seven European Union members has already made itself evident in the manner in which the EU has stumbled from crisis to crisis.  We expect this approach to continue, and as such, believe that the investment grade corporate bond markets will be subject to recurring episodes of volatility surrounding fiscal/political developments in the Eurozone.

Consequently, we remain very cautious on corporate issuers with direct exposure to the weaker EU sovereigns (Telefonica/Iberdrola) and have also reduced our exposure to all European banks (given the interconnectedness of European bank funding of EU sovereign debt issuance).  We are also cognizant of the impact of EU credit volatility on the U.S. money center bank sector, although fundamentally the U.S. banks have very manageable direct exposures to Europe.

N. Sebastian Bacchus, CFA
Vice President, Corporate Credit


For more information, contact:

Greg Curran, CFA
Vice President, Business Development
greg.curran@aamcompany.com


Disclaimer: Asset Allocation & Management Company, LLC (AAM) is an investment adviser registered with the Securities and Exchange Commission, specializing in fixed-income asset management services for insurance companies. This information was developed using publicly available information, internally developed data and outside sources believed to be reliable.  While all reasonable care has been taken to ensure that the facts stated and the opinions given are accurate, complete and reasonable, liability is expressly disclaimed by AAM and any affiliates (collectively known as “AAM”), and their representative officers and employees.  This report has been prepared for informational purposes only and does not purport to represent a complete analysis of any security, company or industry discussed. Any opinions and/or recommendations expressed are subject to change without notice and should be considered only as part of a diversified portfolio. A complete list of investment recommendations made during the past year is available upon request. Past performance is not an indication of future returns.

This information is distributed to recipients including AAM, any of which may have acted on the basis of the information, or may have an ownership interest in securities to which the information relates.  It may also be distributed to clients of AAM, as well as to other recipients with whom no such client relationship exists.  Providing this information does not, in and of itself, constitute a recommendation by AAM, nor does it imply that the purchase or sale of any security is suitable for the recipient. Investing in the bond market is subject to certain risks including market, interest-rate, issuer, credit, inflation, liquidity, valuation, volatility, prepayment and extension. No part of this material may be reproduced in any form, or referred to in any other publication, without express written permission.

November 18, 2011 by

This is an important time of year for the retail industry. We make our prediction for holiday sales using a variety of indicators, trends, and statistical analysis. This will be an interesting holiday given all of the volatility in the capital markets. The results could ultimately set the tone for consumers in the new year.


With Thanksgiving approaching, we thought it prudent to release our outlook for holiday retail sales. This is an especially important time of year for retailers as holiday sales account for 25% to 40% of annual sales. The economic rollercoaster of 2011 is sure to make this year’s forecast a difficult one. Various retail trade associations and Wall Street analysts predict retail sales will be up 2% to 5%. We expect holiday sales will be slower than the 5.2% growth we saw in 2010 and closer to the ten year average of 2.6%. In this report, we touch on important retail trends and explore some of the most influential drivers of retail sales.

Economic Backdrop is an Important Factor for Consideration

Perhaps the most important driver of retail sales is the willingness of the consumer to spend. To do this, we focused on nine categories which help us gauge the overall health of the consumer. We analyzed the most recent economic data points for each category and made a simple assessment for each category relative to data posted in November/December of last year (Exhibit 1).

Source: AAM
Source: AAM

An average of all the categories returned a score that was halfway between “Neutral” and “Negative”. Looking forward, we think household wealth could turn negative when third quarter data is released from the Federal Reserve given the significant drop in the stock market. An offset might be more favorable gasoline prices if the trend towards cheaper gas continues through the end of the year.  In summary, we believe that the consumer is in a slightly weaker position today versus the holiday months of 2010. Recently, better economic data resulted in third quarter GDP of 2.5% coming in better than expected thus reducing the risk of a double-dip recession.  However, we acknowledge this was largely as a result of consumers spending more, but using savings to do so.

Statistical Analysis Indicates a Stronger Season

Looking back on data over the last fifteen years reveals a strong relationship between “Back to School” retail sales (August and September) and “Holiday” sales (November and December). Strong “back to school” sales tend to lead to strong “holiday” sales and vice versa. To complete this analysis, we used the Bloomberg Same Store Sales Composite Index which includes a variety of retailers in the department store, discounter, and specialty subsectors. The regression model returned an R-squared statistic of 64% which means that “Back to School” sales explain 64% of the variability in “Holiday” sales. The model predicts “Holiday” sales of 5.0% when using 5.4% for the “Back to School” sales observed in 2011. This would be significantly better than the average which was 2.7% over those fifteen years. We recognize that this is strictly a mathematical analysis and does not include any qualitative data as inputs.

Seasonal Hiring is Weaker than Last Year

The National Retail Federation (NRF) predicts the retail industry will hire between 480,000 and 500,000 seasonal workers this holiday. That compares to 496,000 workers hired in 2010. In addition, Challenger, Gray, & Christmas thinks seasonal hiring will be about flat to slightly lower than last year. The Hay Group reported that about two-thirds of retailers expect to bring the same amount of workers back this holiday season while about 25% said they will bring back fewer workers. All of these various estimates reflect a muted tone from retailers for this holiday season.

Price Increases are Necessary for Sales Growth

Historically, retailers have not been able to pass on the full effect of rising costs on to the consumer for fear of losing volumes and market share. This is illustrated in Exhibit 2 as the positive difference between apparel Producer Price Index (PPI) or producer costs and Consumer Price Index (CPI) or consumer costs. We expect price increases to be the main driver of sales for retailers this holiday season. CPI has been above 3% for the last six months. CPI is estimated to be up 3.4% year over year in the fourth quarter of 2011.

Source: Bloomberg
Source: Bloomberg

Retailers are always trying to balance lower margins and higher sales. This will be a bigger problem for those retailers that focus on basic items as opposed to those that have more fashion forward (inelastic) products. Going into the holidays, department stores and discounters are expected to be running inventories at relatively conservative levels. This should help to keep margins in check. In addition, we expect promotions to pick up as we haven’t heard much about “must have” new gift items. In the past, those kind of items have included TVs, cell phones, e-tablets. We don’t believe price increases will follow an increase in costs this holiday season. In addition, retailers are expected to increase promotions in an attempt to avoid lower volumes. In summary, there’s limited ability for retailers to drive same-store-sales with increased prices above what we expect from inflation.

Cyber Shopping is Expected to be Strong

Online shopping has become so popular that the industry has coined the Monday following Thanksgiving as “Cyber Monday.” Most retailers have recognized the importance of online commerce as more than two thirds expect sales to be up 15% or more compared to last year. Many retailers have enhanced their web sites and have already starting promoting the holiday season on social platforms such as Facebook and Twitter. Ease of use, convenience, ability to compare prices, and free shipping offers are some of the main reasons why consumers shop online. A survey by the NRF showed that the average shopper plans to do about 36% of his or her shopping online in 2011, compared to 33% last year. While this trend is positive for the industry, there are still a lot of other important factors to consider as online sales typically represent only about 5% of total retail sales. As shown in Exhibit 3, some retailers are more focused on e-commerce than others. In particular, the department stores have done a better job penetrating this market than others. We expect the growing popularity of e-commerce to help sales this holiday season.

Source: Company Reports, Citi Investment Research and Analysis

Inventory Management has Improved the Sales Process

Another important trend for the retail industry has been the improvement in inventory management. Controlling inventory is one of the most critical operating activities for a retailer. It is a delicate balance between having enough inventory, so sales aren’t lost and having too much, so the product doesn’t have to get discounted. Since the last economic recession, companies have invested a lot of capital into technology that integrates inventory across all channels, including the entire store base and central warehouses, which support the online business. Inventory has become more transparent to the shopper and the sales associate who is trying to win a sale. A customer who is searching for a product on a retailer’s web site can either order the product online to be shipped to the home or to a local store. A very convenient feature for the customer is the ability to see if a particular product is in stock at a nearby store. Behind the scenes, inventory moves from store-to-store, from warehouse-to-store, or directly to the customer’s home. Also, retailers have become more localized in their merchandise decision making process. With better inventory systems, retailers have the ability to more closely monitor inventory so product that is not selling well in a particular region can be moved to a different location.  Some retailers have equipped their sales associates with mobile devices with real-time access to inventories and the ability to complete a sale on the spot. At the end of the day, inventory management has become more productive and the customer receives a better service experience. We expect these improvements to improve sales and margins as fresh product reaches shelves more quickly and markdowns are reduced. In addition, retailers are also investing in their supply chain. Shorter cycle times and improved reorder capabilities are resulting in better product success and more conservative inventory positions.

Survey Results Indicate Consumers will Spend Prudently

Exhibit 4 shows the results of a survey conducted by the Citigroup retail group. The survey was an online holiday survey which included more than one thousand responses for consumers between the ages of 18 and 65. About half of the respondents plan to spend the same as last year. That’s up from 45% last year and 41% the year before. And 10.2% said they would spend more in 2011 which was the same as last year. The survey reveals a slightly more optimistic consumer. Other interesting observations were: more consumers are looking for discounts, more consumers will shop online this year, and consumers are most concerned with the economy this year versus job status/income last year.

Source: CIRA Holiday Survey, Citi Investment Research and Analysis

Summary

In summary, we see no reason for retail sales this holiday season to be much different from the average year over year growth of 2.6%. The tone of the typical consumer and the drivers of their spending patterns are a bit weaker now than when compared to last year. A lack of exciting items along with discount hungry shoppers will make it difficult for retailers to push up prices without sacrificing significant volume. Having said that, we believe retail sales will end up slightly better than the average helped by some important trends in the retail industry. Forced by the perils of the latest economic recession, retailers have become much smarter and more conservative. This has been helped through the addition of better inventory and supply chain systems. We expect e-commerce to continue to grow and become a larger proportion of total sales. We believe it will continue to help drive overall retail sales in the future. Finally, our regression analysis based on ‘back to school” sales returned a holiday sales number closer to last year’s 4.6%.

Credit Selection

We continue to be very selective when considering opportunities in the retail space. The economy remains very sensitive while news flow concerning the European debt crisis has kept global capital markets incredibly volatile. In addition, the retail landscape continues to evolve and competition has never been more cutthroat. We favor those credits that either benefit from a positive secular trend (e.g., CVS) or have proven their ability to succeed in a particular niche (e.g., Home Depot, Nordstrom). For higher quality focused investors, Wal-Mart and Target continue to be very strong operators. Both have taken market share away from traditional grocery stores and middle-market department stores.

Michael J. Ashley
Vice President, Corporate Credit


Disclaimer: Asset Allocation & Management Company, LLC (AAM) is an investment adviser registered with the Securities and Exchange Commission, specializing in fixed-income asset management services for insurance companies. This information was developed using publicly available information, internally developed data and outside sources believed to be reliable.  While all reasonable care has been taken to ensure that the facts stated and the opinions given are accurate, complete and reasonable, liability is expressly disclaimed by AAM and any affiliates (collectively known as “AAM”), and their representative officers and employees.  This report has been prepared for informational purposes only and does not purport to represent a complete analysis of any security, company or industry discussed. Any opinions and/or recommendations expressed are subject to change without notice and should be considered only as part of a diversified portfolio. A complete list of investment recommendations made during the past year is available upon request. Past performance is not an indication of future returns.

This information is distributed to recipients including AAM, any of which may have acted on the basis of the information, or may have an ownership interest in securities to which the information relates.  It may also be distributed to clients of AAM, as well as to other recipients with whom no such client relationship exists.  Providing this information does not, in and of itself, constitute a recommendation by AAM, nor does it imply that the purchase or sale of any security is suitable for the recipient. Investing in the bond market is subject to certain risks including market, interest-rate, issuer, credit, inflation, liquidity, valuation, volatility, prepayment and extension. No part of this material may be reproduced in any form, or referred to in any other publication, without express written permission.

July 13, 2011 by

The Interim Report of the UK Independent Commission on Banking proposes a number of potentially material changes to the structure of the UK banking system. We review the proposals and discuss the implications, both positive and negative, for investors in UK bank bonds.


During the 2007/2008 financial crisis, the United Kingdom (UK) government was forced to take material ownership stakes in the Royal Bank of Scotland (approximately 80%) and Lloyds (approximately 40%), nationalize Northern Rock (following a bank run), facilitate the sales of Halifax – Bank of Scotland (HBOS), Alliance & Leicester and Bradford & Bingley, and establish both liquidity and credit back-stop programs for the broader banking sector.

Coming out of the crisis, the government established the UK Independent Commission on Banking (ICB) to explore structural reforms to the UK financial services sector that would prevent future downturns from endangering the financial stability of the UK and assure that future crises do not result in taxpayer funded bailouts to the financial sector. The ICB was officially launched in June 2010 and was tasked with providing recommendations to the UK government in an Interim Report in March 2011 and a Final Report by September 2011.

The Interim Report released in March 2011 described a number of possible structural changes that the Commission was contemplating including:

  • Additional Capital Buffers – The report discussed a 10% equity Tier 1 requirement for Systemically Important Financial Institutions (SIFIs) as well as an additional buffer of 3% to be met through the issuance of contingent capital (CoCos). This closely mirrors the subsequent recommendation of a 2.5% SIFI buffer by the Basel Committee and is therefore likely to be adopted.
  • Resolution Regime – In line with many other jurisdictions (US, Germany, Denmark), the clamor for “no more taxpayer funded bailouts” is the key driver. The likely upshot is legislation that explicitly prohibits government support for financial institutions and requires a “living will” that would provide for an orderly wind-down of the institution should it become distressed/insolvent.
  • Secured Bail-in – The idea of converting debt into equity or simply writing it down at the point of non-viability in order to prevent an institution’s collapse has been proposed. However, the practical implications of such a proposal, as well as details, are to be determined (i.e., triggers, mechanism, bankruptcy regime, seniority, grandfathering of existing debt instruments).
  • Ringfencing of Retail Business – The concept of “Ringfencing” denotes creation of a legally and operationally remote entity within a broader corporate structure in order to protect said entity. Driven by the view that maintaining the safety of retail and non-financial depositors is a key goal of reform, the ICB has tacitly endorsed some form of ringfencing  the retail banking operations of UK universal banks. However, the specific details of such a transformation are to be determined. This stands in contrast to an explicit separation of retail and wholesale businesses that had been entertained.
  • Reduced Industry Concentration – The Interim Report highlighted “too big to fail” risk that corresponds to a highly concentrated banking sector and commented on the desirability of a less concentrated domestic banking sector with additional strong competitors (We note most other national regulators have failed to address this issue, such a contemplation was notably absent from the Dodd-Frank process in the US). This applies primarily to Lloyds (with a 30% deposit share) and RBS to a lesser extent.

Subsequent to the release of the Interim report, UK Chancellor of the Exchequer George Osborne gave a major policy speech on June 15, 2011 strongly endorsing the (Interim) findings of the ICB and promising to take up the recommendations, particularly with regard to increased capital buffers and ring-fencing. During his speech, he was at pains to emphasize the “British dilemma” whereby the financial sector constitutes an important and outsized component of the UK economy, but at the same time puts it at risk, given the size of UK banks relative to the economy (roughly 4.0x GDP).

Implications of UK Bank Reforms for Credit Investors

It is currently difficult to opine on the credit implications of banking sector reform in the UK, given that the Final Report (with detailed recommendations) is not due until September 2011, and timing of adoption and implementation by the UK government is uncertain (the Chancellor’s comments notwithstanding). However, it makes sense to address the potential benefits and drawbacks of the proposed regulatory changes.

Positive Implications

The focus on Capital Buffers well above and beyond the 7% minimum common equity Tier 1 ratios mandated by Basel III is an unequivocal positive. Additional capital, especially if it comes in the form of common equity, serves both as a direct layer of protection for fixed income investors, and as a deterrent to marginal activities that require high amounts of leverage (many of which got the UK banks into hot water in the first place). In light of the Basel Committee on Banking Supervision (BCBS) recommendation on capital buffers up to 2.5% above the 7% minimum that was recommended subsequent to the release of the Interim Report, we view the likelihood of implementation as highly likely.

Negative Implications

While the practical approach to Ringfencing are not yet detailed by the ICB, we view this as a potentially negative development, as the truly “universal” nature of UK banks has always been a source of credit strength for bondholders. The fact that bonds and deposits were pari passu (i.e., having equal rights of payment), and that both represented obligations of the “Bank PLC” entity served as a source of stability and funding strength for creditors. Further, the direct link between the bonds and the deposit taking entity raised the systemic importance of the issuers, and hence, the likelihood of support. However, the practical implication of the government being obligated to support the bondholders as a consequence of supporting the depository institution resonates both with the government and the broader (taxpaying) public. The Interim Report contemplated a separate subsidiary containing the retail banking businesses (which are not clearly defined; assumed to mean the deposit taking businesses at a minimum) with higher capital requirements and restrictions on the ability to upstream capital to the consolidated entity. Presumably such ringfencing would reduce external risks to the retail banking business and also make it easier for regulators to support just this portion of the bank while allowing other parts to fail “in an orderly manner” (see discussion on Resolution Regimes below). From a creditor’s perspective, the trapping of capital and stable liquidity within a subsidiary would represent an explicit structural subordination of senior unsecured bonds that would presumably remain at the “holding company” level. While the issue of depositor funding of non-consumer activities (i.e., Barclays Capital) were not discussed, we presume such application of deposits would run counter to the spirit of ringfencing. While such an arrangement is already de facto for most US bank bonds (the majority of which are issued out of the holding company and are explicitly subordinate to bank-level depositors), this would represent a negative development for existing UK bank bonds. Conversely, however, the ICB expressly ruled out the possibility of explicitly breaking up the universal banks into separate wholesale and retail banking entities. From a rating perspective, we would expect an explicit differentiation between bonds issued by an entity within the ringfence and those issued outside of that entity (although the magnitude of notching is uncertain).

Uncertain Implications

The concept of Resolution Regimes has been widely touted by regulators and politicians the world over as a way to end moral hazard associated with an implicit government guarantee of individual banks. Generically, a resolution regime would mandate that universal banks provide a “living will” to regulators that would provide for orderly wind-down of non-essential operations and transfer of deposit taking subsidiaries to other banks, thus absolving the government of needing to support the entire entity (as was the case in 2008). By legislatively prohibiting extraordinary assistance to banks, the theory holds that banks will no longer be incented to “swing for the fences” on risk-taking decisions and that a truer cost of capital would emerge as the presumption of government support fell away, and banks would be forced to become both more transparent and more conservative. In practice, however, it is difficult to see a removal of government support so long as the “too big to fail” issue remains unresolved. Theoretically, the concept of ringfencing could insulate those portions of troubled banks that are deemed critically important to the health of the broader UK financial system (the ICB has highlighted the deposit/retail business).

However, in institutions the size and complexity of the UK’s universal banks (HSBC Holdings PLC (HSBC), Barclays PLC (BACR), Royal Bank of Scotland Group PLC (RBS), Lloyds Banking Group PLC (LLOYD)), it is difficult to see: a) how such a complex institution could be wound down in an “orderly” manner and b) how the failure/wind-down of such an institution’s wholesale businesses would not have a disproportionately negative impact on the broader financial system (Lehman Brothers, after all, had almost no retail/depository business). As a result, it is not necessarily credible that the UK government would not provide support for a troubled universal bank, although the imposition of a resolution regime would likely restrict the government’s options for the same, and predicting the form and direction of such support is very difficult. The push for resolution regimes (even in a more regulated/presumably less risky financial sector) would not necessarily be an outright negative development for creditors, but would make bank bond investors more risk averse going forward. From a ratings perspective, the lower likelihood of government support would likely remove at least a portion of the ratings uplift that currently benefit the universal banks (although, all of the agencies have mentioned the still high likelihood of some form of support given the systemic importance of these institutions). Finally, from a spread perspective, bank bonds are unlikely to return to their historic trading levels inside the trading levels of comparably rated non-financial corporates. However, bank bonds should eventually trade at comparable levels to similarly rated non-financials as the uncertainty surrounding financial reform and credit recovery recedes.

Senior Unsecured Bail-in falls somewhere between the concepts of Resolutions Regime and Capital Buffers. Conceptually, the ability to either write-down or convert into equity a portion of senior unsecured bonds of a troubled bank would serve both to re-capitalize a troubled institution and would also satisfy the Resolution Regime purpose of avoiding a “taxpayer bail-out” of the bondholders similar to what occurred with RBS and Lloyds in 2008. Still to be determined are whether such a bail-in concept would apply retroactively to outstanding senior unsecured debt, whether all senior unsecured bonds going forward would have a bail-in feature, what the trigger for a bail-in would be, and whether such bonds would be appropriate (or even investable) for insurance accounts.

Reduced Industry Concentration at least begins to contemplate the “too big to fail” issue within the UK’s highly concentrated banking sector. Particularly with the failure/exit of numerous smaller institutions, the Interim Report was focused on the desirability of increased competition by well capitalized competitors. To that end, they recommend the sale of approximately 600 branches and associated deposits by the Lloyds Banking Group to reduce that institution’s 30% deposit market share. The growth of such second tier competitors as Santander UK and National Australia Bank, both of which had entered the UK bank market with previous acquisitions, and the possible entry of Virgin Money were explicitly encouraged. While the branch sale by Lloyds (as well as the commercial banking business sale by RBS to Santander UK) should both be credit neutral to those specific institutions, it is hard to see any of these actions materially reducing the concentration risk within the sector. As a practical matter, bank sectors within all of the G-7 markets have been consolidating for thirty years, and neither regulators nor politicians appear willing to reverse this trend. Even in countries where further consolidation is explicitly prohibited (Australia/Canada), the failure of any of the countries’ major banks would threaten the broader financial system. Furthermore, in the absence of a global consensus (which appears unlikely), no individual country is likely to break-up its largest banks, and thus put its domestic banks at a disadvantage to other countries. As a result, a move toward a higher level of regulation and higher capital levels appears the most likely path. To the extent that this results in a more utility-like banking sector, such an outcome should be positive for bondholders.

Final Credit Thoughts and Broader Implications

The process of the ICB in the UK mirrors a global attempt to better regulate and de-risk the financial sector (Dodd-Frank in the US, Bank Restructuring Act in Germany, Basel III). All of these efforts include elements of increased capital, reduced complexity and removal of moral hazard (taxpayer liability) through implicit/extraordinary support. To the extent that these varied efforts result in a better capitalized and simpler banking system, we would view the outcome as fundamentally positive for creditors. However, the failure to directly address “too big to fail” (even if higher capital requirements encourage reduced size) leaves considerable interdependence between the credit of the systemically important banks in each jurisdiction and the credit of the overall sovereign. As creditors, however, we would welcome a shift to a more utility-like banking sector with more capital and lower risk, even if it came at the cost of somewhat reduced profitability.

N. Sebastian Bacchus, CFA
Vice President, Corporate Credit


For more information, contact:

Joel B. Cramer, CFA
Director of Sales and Marketing
joel.cramer@aamcompany.com

Greg Curran, CFA
Vice President, Business Development
greg.curran@aamcompany.com


Disclaimer: Asset Allocation & Management Company, LLC (AAM) is an investment adviser registered with the Securities and Exchange Commission, specializing in fixed-income asset management services for insurance companies. This information was developed using publicly available information, internally developed data and outside sources believed to be reliable.  While all reasonable care has been taken to ensure that the facts stated and the opinions given are accurate, complete and reasonable, liability is expressly disclaimed by AAM and any affiliates (collectively known as “AAM”), and their representative officers and employees.  This report has been prepared for informational purposes only and does not purport to represent a complete analysis of any security, company or industry discussed. Any opinions and/or recommendations expressed are subject to change without notice and should be considered only as part of a diversified portfolio. A complete list of investment recommendations made during the past year is available upon request. Past performance is not an indication of future returns.

This information is distributed to recipients including AAM, any of which may have acted on the basis of the information, or may have an ownership interest in securities to which the information relates.  It may also be distributed to clients of AAM, as well as to other recipients with whom no such client relationship exists.  Providing this information does not, in and of itself, constitute a recommendation by AAM, nor does it imply that the purchase or sale of any security is suitable for the recipient. Investing in the bond market is subject to certain risks including market, interest-rate, issuer, credit, inflation, liquidity, valuation, volatility, prepayment and extension. No part of this material may be reproduced in any form, or referred to in any other publication, without express written permission.

June 6, 2011 by

In this thought leadership piece, we analyze the home improvement sector of the retail industry. The two largest competitors in this segment, Home Depot and Lowe’s, have been battling it out for years. Given the size of the U.S. home improvement market (estimated as $570 billion1), they are also two of the largest retailers in the world. Also, we will review the current and expected prospects for the industry, compare and contrast the two companies, and finally, disclose which company we believe is the better opportunity for corporate bond investors.

Industry Overview

One thing is for sure, home improvement retailers have been impacted by the downturn in the housing market. In addition to a bad real estate market, credit is tight, consumer confidence is historically low, and unemployment is high. Management at both Home Depot and Lowe’s agree that their companies’ growth has decoupled from the housing market and is now more reliant on GDP growth. These retailers’ allocation of sales to more expensive, discretionary type purchases (major remodel projects) has come down to about 30% of the total. The Cost vs. Value survey conducted by Remodeling Magazine, which estimates the return of remodeling projects, continues to show a downward trend (Exhibit 1). One good sign is that remodeling costs are beginning to come down, as contractors become more competitive and consumers look to scale down on quality and/or options. Unfortunately, home values continue to fall, making it less attractive and/or financially feasible for home owners to remodel. This should keep the ratio low for the foreseeable future since we believe that it will be years before we experience a sustained recovery in home prices.

Exhibit 1
Exhibit 1 — Source: “Cost vs. Value Report” https://www.remodeling.hw.net

Smaller scale replacement projects, like putting in a new garage door or adding a wood deck, are expected to be the primary source of growth until we see the housing market return in the U.S.. After all, for most Americans, our house is our largest asset. It needs to be kept up and it’s fairly easy, these days, for the typical homeowner to take on a small to intermediate sized project. In addition, consumers will continue to spend on maintenance items including light bulbs and garbage bags.

While Home Depot and Lowe’s have struggled through the recession, there are some signs that home improvement spending has, at least, stabilized. Various economic indicators, while weak, are off the lows seen in early 2009. A look at Bloomberg’s survey of Real GDP growth shows a gradual increase to 3% over the next couple of years for the U.S. The Remodeling Market Index (RMI), created by The National Association of Home Builders, shows a slow improvement in remodelers’ perception of the current and future market for residential projects (Exhibit 2). The RMI is created through a combination of current remodeling activity and indications of future activity.

Lowe’s 10-K, December 31, 2010 (pg. 5)

An RMI of under 50 still means that more remodelers report market activity is lower than report it is higher, compared to the previous quarter.


Exhibit 2
Exhibit 2 — Source: “Remodeling Market Index” https://www.nahb.org

A historically high share of homeownership, an increasing age of housing stock, improving demographics (i.e., growth strong in the 55+ age of households, gen-Xers are reaching peak earning years, female home ownership is up), along with the expectation of improving household income bode well for home improvement spending in the future.

Store Results

The trends in the economy are evident in the same store sales numbers for Home Depot and Lowe’s. Home Depot has outperformed Lowe’s for the last eight quarters (Exhibit 3). Home Depot has done this mostly through increased traffic. One of Home Depot’s big initiatives was to improve the look and layout of its stores and to increase its customer service. Home Depot has a reputation for lower prices and more pro-friendly atmosphere where Lowe’s is trying to capture the traditional do-it-yourself customer. Lowe’s tries to attract the female customer, who the company claims, is responsible for 80% of home improvement decisions.


Exhibit 3 — Source: Christopher Horvers, "What We Learned from J.P. Morgan"
Exhibit 3 — Source: Christopher Horvers, “What We Learned from J.P. Morgan” May 17, 2011, page 10 (Lowes) page 11 (Home Depot)

Big ticket item sales for both have been weak. This makes sense given the slowdown in major renovation activity that we wrote about earlier. Having said that, there have been some signs of life. In the fourth quarter of 2010, Home Depot’s big ticket category was up 10% from a year ago (Exhibit 4). Consumers took advantage of tax credits in higher efficiency products including appliances, windows, and HVAC. This is not a trend we expect to continue as evidenced by First Quarter 2011 results.


Exhibit 4 — Source: Matthew Fasler, "Living to Find Another Day; Still Perfer Goldman Sachs", May 17,2011, page 6
Exhibit 4 — Source: Matthew Fasler, “Living to Find Another Day; Still Perfer Goldman Sachs”, May 17,2011, page 6

Home Depot or Lowe’s

In terms of financial performance, Home Depot has outperformed. Operationally, Home Depot has followed through on its initiatives to improve its supply chain logistics and merchandising efforts. While both companies have improved margins and growth, Home Depot has executed at a higher rate (Exhibits 5 and 6). Not only is Home Depot improving the bottom line because of operational enhancements, but it is also increasing market share given efforts to drive the top line.

Exhibit 4
Exhibit 5
Exhibit 6
Exhibit 6

Leverage (adjusted for rental expense) and coverage have been steady for both Home Depot and Lowe’s. Over the past five years both companies have decided to add leverage to their balance sheets to benefit shareholders via sizable share buybacks. Home Depot has had a more dramatic change in credit profile, as exemplified by credit ratings which fell from low double-A to high triple-B in 2007. Home Depot announced

a $22.5 billion share repurchase plan and sold its HD Supply business. Home Depot decided to put the share repurchase plan on hold as management became concerned with the economic landscape. A leverage target of 2.0 – 2.5 times (X) was put in place. At the end of 2010, Home Depot had approximately $10 billion still available under its share repurchase plan. In the first quarter of 2011, the company issued $2 billion of senior unsecured bonds. Of that issue, $1 billion was used to repay upcoming debt and the other $1 billion was used to repurchase stock. We would expect Home Depot to continue to use debt to buyback stock so long as the company stays within its leverage guidelines. Lowe’s recently increased its leverage target to 1.8X from 1.5X. In the first quarter of 2011, Lowe’s repurchased $1 billion of stock. The company has $1.4 billion available under the current repurchase plan. When you compare adjusted leverage and coverage for both companies, Lowe’s has been operating with a more moderate balance sheet. Through the economic recession both companies managed their cash flow in a very conservative manner by halting new store openings and freezing share repurchase plans.

As shown in Exhibit 7, both companies demonstrate strong liquidity.


Exhibit 7
Exhibit 7 — Source: Capital IQ and Company

Lowe’s $1.75 billion credit facility matures in June 2012. Lowe’s next debt maturity is not until 9/15/12 ($550 million). Home Depot’s $2.0 billion credit facility matures in July 2013. Home Depot’s next debt maturity is not until 12/16/13 ($1.25 billion). Also, both companies own a large percentage of their stores/real estate with very limited secured financing in place. Lowe’s owned about 89% of its stores with a net book value of $22.1 billion at the end of 2010. Home Depot owned 89% of its stores with a net book value of $25.1 billion at the end of 2010. This is an important asset for bondholders, although we have seen with other retailers (e.g., Target) that real estate ownership can attract active shareholders who want to monetize the assets. Having said that, Home Depot is in a better defensive position given its already large debt position, triple-B credit rating, and large market value.

Both companies are very well diversified across the U.S. with a presence outside of the US as well.

Exhibit 8
Exhibit 8
Exhibit 9
Exhibit 9

Home Depot has a larger footprint than Lowe’s except for the Southwest region (see exhibits 8 & 9). Home Depot has a significantly larger presence in major metropolitan markets in California, Illinois, Minnesota, New York, Massachusetts, and Florida. California and Florida are two of the states most adversely impacted by the housing crises. Home Depot has 10% (231 stores) of its stores in California and 7% (153) of its stores in Florida while Lowe’s has 6% (109) in California and 7% (118) in Florida. We expect that Home Depot’s larger exposure to these markets will, at some point, provide a bigger uplift to Home Depot’s results. Also, in an effort to catch up with Home Depot, Lowe’s will need to be more aggressive in terms of new store openings which will be a larger drag on free cash flow.

Home Depot is currently rated Baa1/BBB+/BBB+ and Lowe’s is rated A1/A/A. Based on our analysis we believe these credit ratings are too far apart. We would expect the ratings to converge somewhere around low to mid single-A as the overall retail environment improves. Given the current operational momentum at

Home Depot and our expectation that leverage stays within guidelines, we believe ratings will get upgraded into the single-A category. Management at Lowe’s says they want to keep their A1/P1 commercial paper rating which would equate to a A2/A long term rating. We think Lowe’s leverage target will continue to be loosened, as equity holders push for more share buybacks and leverage.

All financial data from Capital IQ and Company 10-K Reports

Home Depot 10-year bonds (HD 4.4% 4/1/21) are offered at a spread of +118/10 year. Lowe’s 10-year bonds (LOW 3.75% 4/15/21) are offered at a spread of +80/10-year. Over time we believe that this 38 basis points difference between the two credits will shrink to 10 basis points or so. One interesting thing to note is that both credits trade on top of each other in the credit default swap (CDS) market, which reflects only credit risk. After analyzing these two retail giants, we believe that Home Depot offers the better opportunity for bondholders.

Written by:
Michael J. Ashley
Vice President, Corporate Credit


Disclaimer: Asset Allocation & Management Company, LLC (AAM) is an investment adviser registered with the Securities and Exchange Commission, specializing in fixed-income asset management services for insurance companies. This information was developed using publicly available information, internally developed data and outside sources believed to be reliable. While all reasonable care has been taken to ensure that the facts stated and the opinions given are accurate, complete and reasonable, liability is expressly disclaimed by AAM and any affiliates (collectively known as “AAM”), and their representative officers and employees. This report has been prepared for informational purposes only and does not purport to represent a complete analysis of any security, company or industry discussed. Any opinions and/or recommendations expressed are subject to change without notice and should be considered only as part of a diversified portfolio. A complete list of investment recommendations made during the past year is available upon request. Past performance is not an indication of future returns.

This information is distributed to recipients including AAM, any of which may have acted on the basis of the information, or may have an ownership interest in securities to which the information relates. It may also be distributed to clients of AAM, as well as to other recipients with whom no such client relationship exists. Providing this information does not, in and of itself, constitute a recommendation by AAM, nor does it imply that the purchase or sale of any security is suitable for the recipient. Investing in the bond market is subject to certain risks including market, interest-rate, issuer, credit, inflation, liquidity, valuation, volatility, prepayment and extension. No part of this material may be reproduced in any form, or referred to in any other publication, without express written permission.

  • « Go to Previous Page
  • Page 1
  • Interim pages omitted …
  • Page 6
  • Page 7
  • Page 8
  • Page 9
  • Go to Next Page »

Get updates in your inbox.

  • Investment Strategies
    • Investment Grade Fixed Income
    • Specialty Asset Classes
  • Our Clients
    • Client Experience
    • Sample RFP Download
  • Insights
    • Video
    • Webinar
    • News
    • Podcasts
  • About
    • Our Team
    • Contact
    • Client Login

Disclaimer: Asset Allocation & Management Company, LLC (AAM) is an investment adviser registered with the Securities and Exchange Commission, specializing in fixed-income asset management services for insurance companies. Registration does not imply a certain level of skill or training. This information was developed using publicly available information, internally developed data and outside sources believed to be reliable. While all reasonable care has been taken to ensure that the facts stated and the opinions given are accurate, complete and reasonable, liability is expressly disclaimed by AAM and any affiliates (collectively known as “AAM”), and their representative officers and employees. This report has been prepared for informational purposes only and does not purport to represent a complete analysis of any security, company or industry discussed. Any opinions and/or recommendations expressed are subject to change without notice and should be considered only as part of a diversified portfolio. A complete list of investment recommendations made during the past year is available upon request. Past performance is not an indication of future returns. This information is distributed to recipients including AAM, any of which may have acted on the basis of the information, or may have an ownership interest in securities to which the information relates. It may also be distributed to clients of AAM, as well as to other recipients with whom no such client relationship exists. Providing this information does not, in and of itself, constitute a recommendation by AAM, nor does it imply that the purchase or sale of any security is suitable for the recipient. Investing in the bond market is subject to certain risks including market, interest-rate, issuer, credit, inflation, liquidity, valuation, volatility, prepayment and extension. No part of this material may be reproduced in any form, or referred to in any other publication, without express written permission. *All figures shown are approximate and subject to change from quarter to quarter. **The accolades and awards highlighted herein are not statements of any advisory client and do not describe any experience with or endorsement of AAM as an investment adviser by any such client.

Copyright © 2024 AAM | Privacy and Disclosures

  • LinkedIn
  • YouTube