Structured Products performed well in 2024 lead by robust returns in the CMBS and ABS markets. While spreads tightened relative to Treasuries over the course of the year, they remain at or near 5-year historical averages. Other risk assets by comparison trade at the tightest spread levels seen in a decade or more. As we look to 2025 we see more opportunities in the Structured Products market than we have seen in years. Our outlook for each sub-sector follows.
Agency MBS
The Agency MBS market lagged other fixed income sectors for most of 2024, before playing catch up following the election in November. Optimism that 2025 would bring a steeper yield curve and lower volatility as the Fed lowers interest rates helped attract demand. Domestic banks have traditionally been large purchasers of Agency MBS but were largely absent from the market last year. With the prospect for lower interest rates and fewer mark to market losses, we expect banks to be major participants in the passthrough market in 2025.
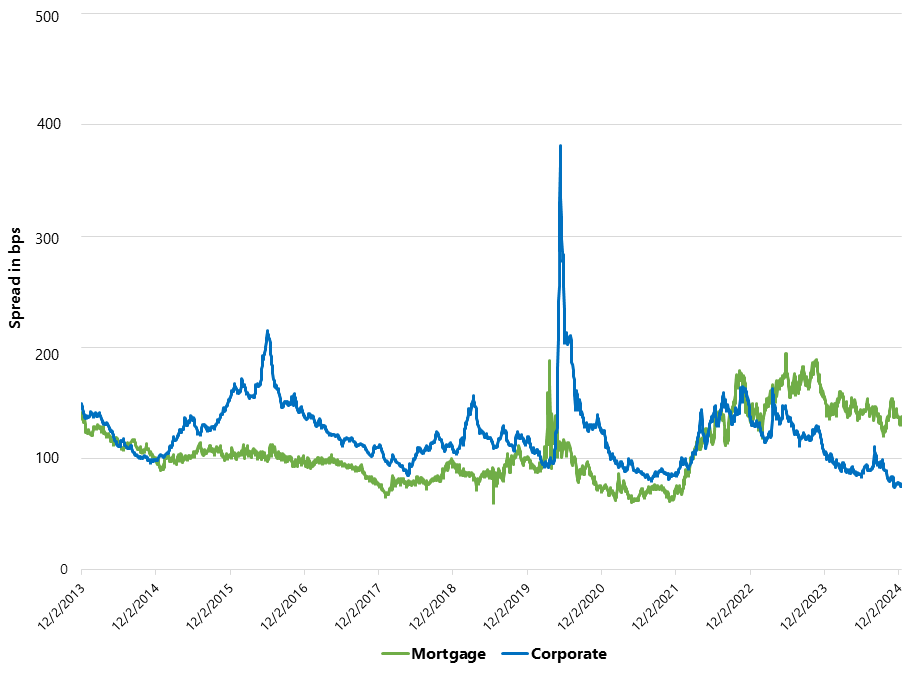
Net supply of mortgages is expected to be similar in 2025 as it was in 20241. Supply continues to be constrained by low purchase activity and lower housing turnover particularly with regard to younger families upgrading to larger more expensive homes. The relative lack of supply sets the market up in a favorable technical position and if bank demand does materialize as expected, we should see tighter mortgage spreads in 2025. Current coupon spreads of 140 bps compares favorably to their historical average of 106 bps2, as well as to corporate bonds (Exhibit 1) which can make Agency MBS an attractive investment option as we enter the new year.
Exhibit 1: Agency MBS vs Corp OAS
When selecting mortgage securities for investment, targeting pools with characteristics that carry attractive prepayment profiles can account for the majority of the expected excess return. We do expect call risk and prepayment activity to be relatively low in the first half of the year, however, rates could be more volatile later in the year as new policies on tariffs, immigration, and spending create unforeseen difficulties. Most Agency MBS are trading at a steep discount to par, so choosing mortgage pools with the right characteristics generating above market prepayments will be exceedingly important.
ABS
ABS continue to anchor our portfolios at the short end of the yield curve. High credit quality and stable cash flows can make them a valuable alternative to callable, high coupon mortgage passthroughs and low yielding Taxable Municipals. ABS performed well in 2024 with esoteric sectors such as aircraft, whole business (franchise), unsecured consumer loans, and subprime auto posting the highest excess returns. Solar and data center deals underperformed due to credit rating downgrades3.
We expect marginal spread tightening of about 5-10 basis points in 2025. Much like Agency MBS, ABS are broadly trading in line with 5-year averages which can make them a more attractive alternative to other risk assets trading at much tighter spreads. Credit performance metrics may moderate somewhat from prior years but both consumer and commercial balance sheets remain in good shape which should alleviate the risk of credit deterioration negatively impacting spreads in the coming year. ABS issuance was record-breaking in 2024, and in 2025, issuance is expected to remain high. Total ABS issuance is projected to be around $340 billion but we don’t believe that supply will deter spreads from tightening during 20254. We believe higher yielding, esoteric issues will continue to deliver much better performance than lower yielding generic ABS securities and shorter maturity corporate bonds.
CMBS
The CMBS market generated some of the highest excess returns among spread sectors in 2024 despite ongoing concerns about exposure to office properties. We expect the key to 2025 performance will be the extent to which a broad array of commercial properties can refinance their current loans or negotiate maturity extensions to avoid default. Current lending rates exceed the average outstanding loan rate by 230bp5. With the increase in the 10-year Treasury rate since September, loan refinancing will remain a challenge for the foreseeable future.
Despite these challenges, there is an increasing sense of optimism in the market based largely on two things. First, most special servicers have been reluctant to force defaulted properties into liquidation, granting borrowers multiple extensions to improve property performance and more importantly prevent properties from being liquidated at fire sale prices. Secondly for those properties demonstrating more long-term viability, deep pocketed borrowers have been willing to contribute additional equity capital in exchange for maturity extensions to increase the likelihood of being able to refinance loans at more favorable rates. We expect well positioned properties in attractive markets to survive and even prosper while many B and C quality properties will continue to generate headlines.
Much like other sub-sectors of the Structured Products market, spreads remain quite attractive on a historical basis. We believe as property valuations stabilize, albeit at lower levels, CMBS securities will continue to tighten in 2025, with spreads compressing closer to those of corporate bonds. New issuance is expected to be a quite manageable $110-$130 billion6 and shouldn’t be an obstacle to further spread compression.
CLOs
CLOs generated the highest nominal return this past year among Structured Product securities as well as most other investment grade alternatives. CLOs pay interest at a variable rate that declines as the Federal Reserve reduces the Funds rate. Despite the Fed lowering rates by 100bp in 2024, they still managed to outperform other fixed rate options due to their higher overall yields. In 2025, we anticipate a more difficult environment for CLOs as further rate cuts and a steeper yield curve should favor other fixed rate alternatives. Even with those head winds, the ongoing yield advantage of CLOs still makes them a very attractive short duration option and they could provide another year of robust returns should the Fed deliver fewer rate cuts than the market currently expects.
We believe spreads will continue to narrow in 2025 as the asset class continues to appeal to a broad array of investors. Banks and insurance companies have been steadily increasing portfolio allocations over the past few years and have become some of the largest holders of the more senior classes. CLOs have also seen more interest from individual investors as well through the growth of ETFs that offer investors exposure to multiple layers of the credit stack. With Issuance expected to remain near $180 billion which should be easily absorbed in a broad and growing market, we believe CLOs are positioned to deliver another year of very competitive returns7.
1 Bank of America
2 Bloomberg
3 Bloomberg
4 Bank of America
5 Bank of America
6 Bank of America
7 JP Morgan