Recession avoided, election completed, inflation stifled. While these milestones are considered positive for consumers, we still need to contemplate other important factors which may influence spending this holiday season. The one thing I can say about the American shopper is they consistently show up for important occasions. This year, we expect record spending with year over year growth of around 4%.
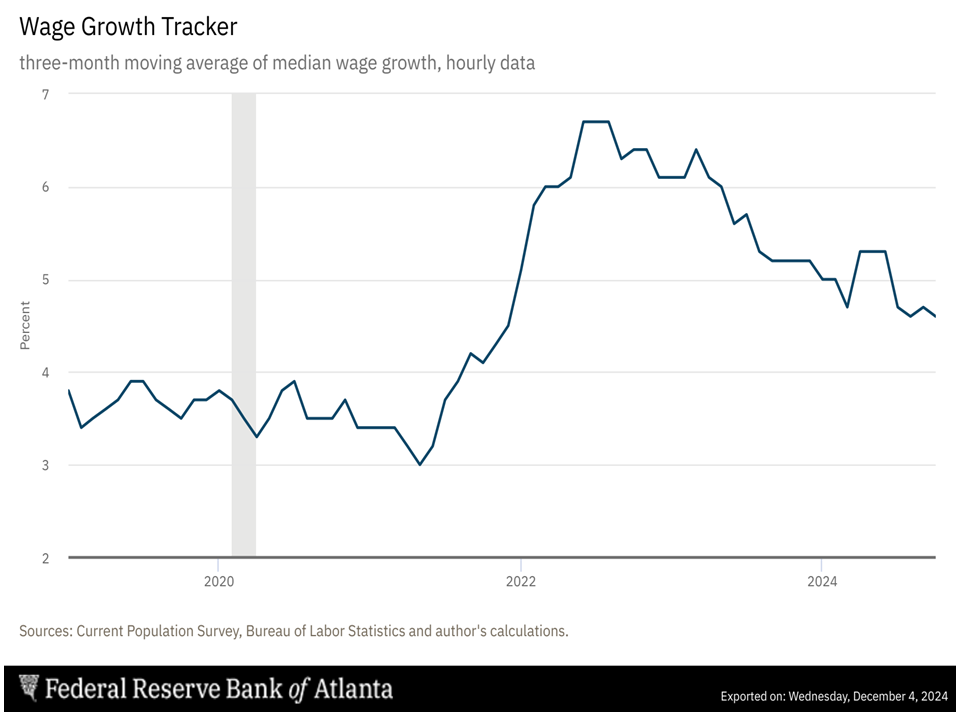
One of the few positive economic surprises these past couple of years has been consumer spending, which accounts for about 70% of GDP. COVID turned spending upside down for a relatively brief part of history. Four years later and we are finally getting back to a normal pace of growth. There are a few things that I wanted to highlight that look more positive today than they did back in 2019. The first is wage growth as calculated by the Federal Reserve Bank of Atlanta. Strong wage growth is a direct reflection of a solid labor market. As you see below, the current wage growth of 4.6% is well above where we were pre-COVID.
The second is net worth. Net worth is the total value of personal assets minus what you owe on those assets. This includes the value of your home, stock portfolio, and cash held in savings/checking accounts. Household net worth has increased more than 40% from $117 trillion at the end of 2019 to $164 trillion at the end of June 2024.
The following are a few highlights from a recent survey by Morgan Stanley. According to the survey, 36% of respondents plan to spend more this holiday season than last year. Of that amount, 12% plan to spend “a lot more”. That compares to last year’s response which totaled 30% including 10% that plan to spend “a lot more”. Higher incomes and improved access to credit were cited as key reasons for the shift.
Weather and the unique characteristics of the holiday calendar are both interesting factors to consider when predicting the upcoming holiday sales. Obviously, the weather is very difficult to predict. Typically, retailers want cold, but not too cold, and dry weather conditions. In terms of the calendar, there are 27 shopping days between Black Friday and Christmas this year. That is the least number of days possible for any holiday season and compares to 32 days in 2023. This could impact overall sales given less opportunity to shop either online or in person.
We have been tracking the relationship between “Back to School” sales (BTS), which occur in August and September, and “Holiday Sales”, which occur in November and December. Over the last 20 years we have calculated an 85% correlation between these two data points. Please see the graph below.
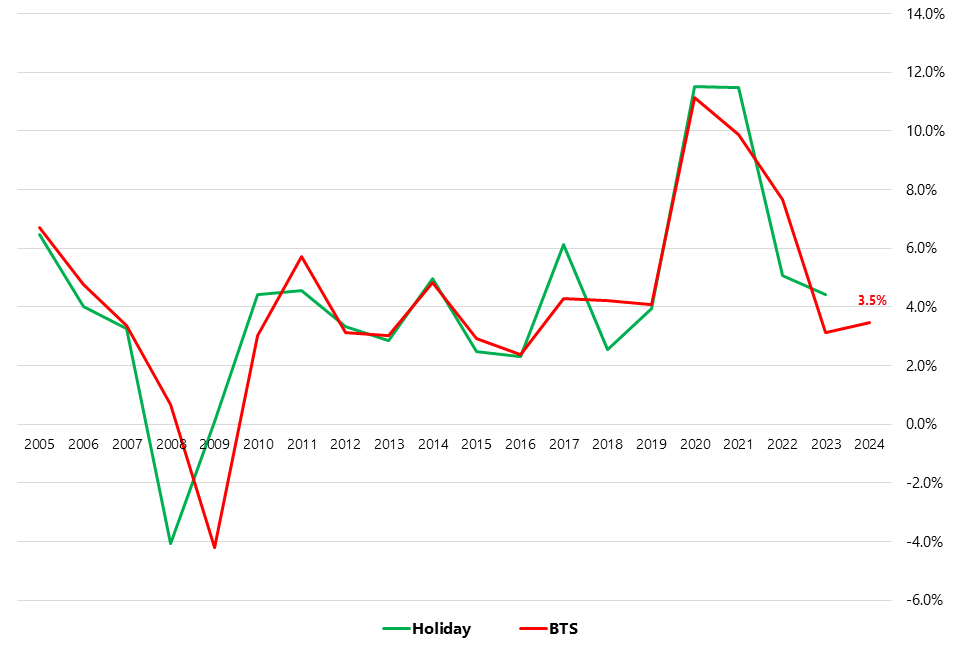
In 2023, BTS sales were up 3.1% and holiday sales increased to 4.4%. This year, BTS came in better than last year at 3.5%.
We have covered just a handful of factors to consider when developing our retail holiday sales prediction for this year. Overall, our impression is that the typical holiday shopper is in a pretty good economic position and that willingness to spend is strong. The average growth in holiday spending over the past 20 years is around 4.3%. It only makes sense that we get close to that number in 2024 as several other economic indicators and spending statistics are heading closer to long-term averages. After the disruptions of recent years, a return to “normal” feels not only welcome but extraordinary.