• Skip to primary navigation
  • Skip to main content
  • Skip to footer
AAM CompanyTransparent Logo

AAM Company

AAM Company Website

  • Investment Strategies
    • Investment Grade Fixed Income
    • Specialty Asset Classes
  • Clients
    • Our Clients
    • Client Experience
    • Download Sample RFP
  • Insights
    • Video
    • Webinars
    • Podcasts
    • News
  • About
    • Our Team
    • Events
  • Login
  • Contact Us
Contact

Asset Allocation Strategies

May 17, 2021 by

2020 was a lively year for investors, and insurers were no exception. It saw dramatic down-and-up volatility in equity markets and other risk assets, the return of ultra-low rates (including lows never before seen at the long end of the yield curve), and a head-spinning round trip in credit spreads. In this paper we summarize data we’ve collected on investment holdings and returns for the P&C and Life insurance industries including both 2020 and the prior 4 years. To add additional perspective we’ve broken each industry out into companies with total invested assets <$100 million, companies with assets from $100M – $1 billion, and companies >$1 billion, since company size is a significant factor driving how insurers invest. We’ve included only companies with at least 3 years of operating history as of 12/31/20, as startup insurers may have temporarily conservative investment allocations that aren’t representative of their longer-term investment targets. We summarize key observations and conclusions below, and follow with graphs detailing the data we reviewed.

P&C Industry

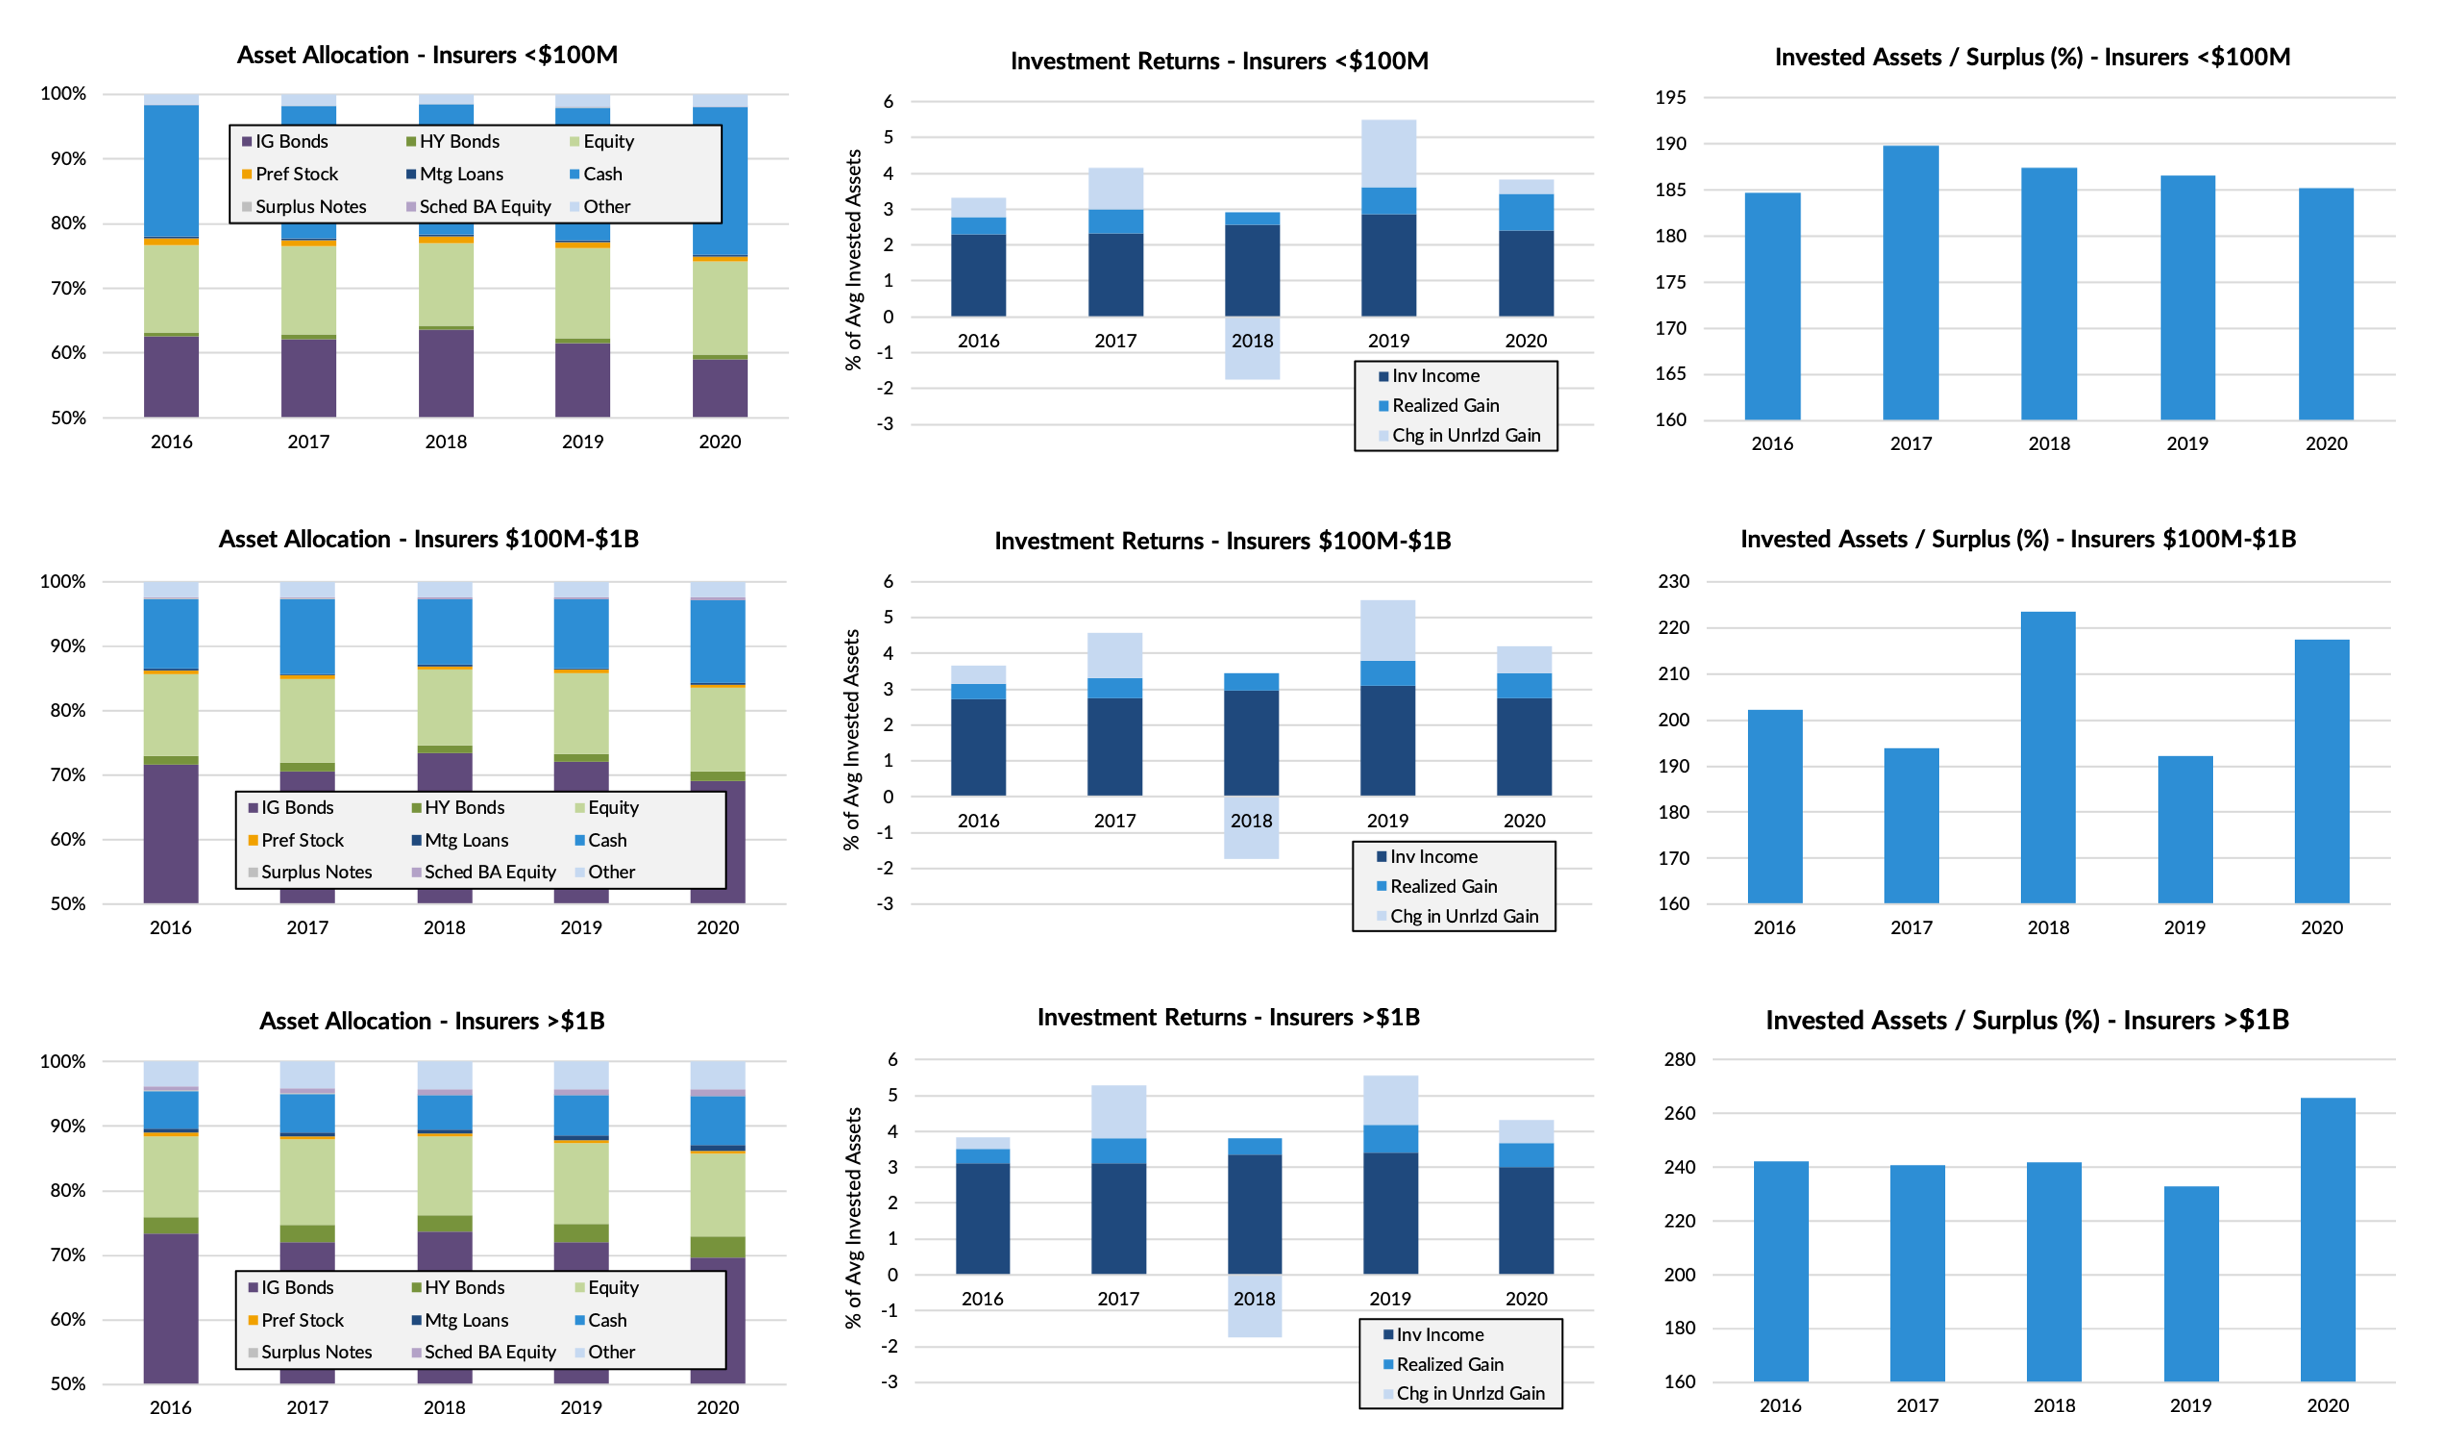
A few generalizations can be made about P&C insurance investors based on the data we observed:

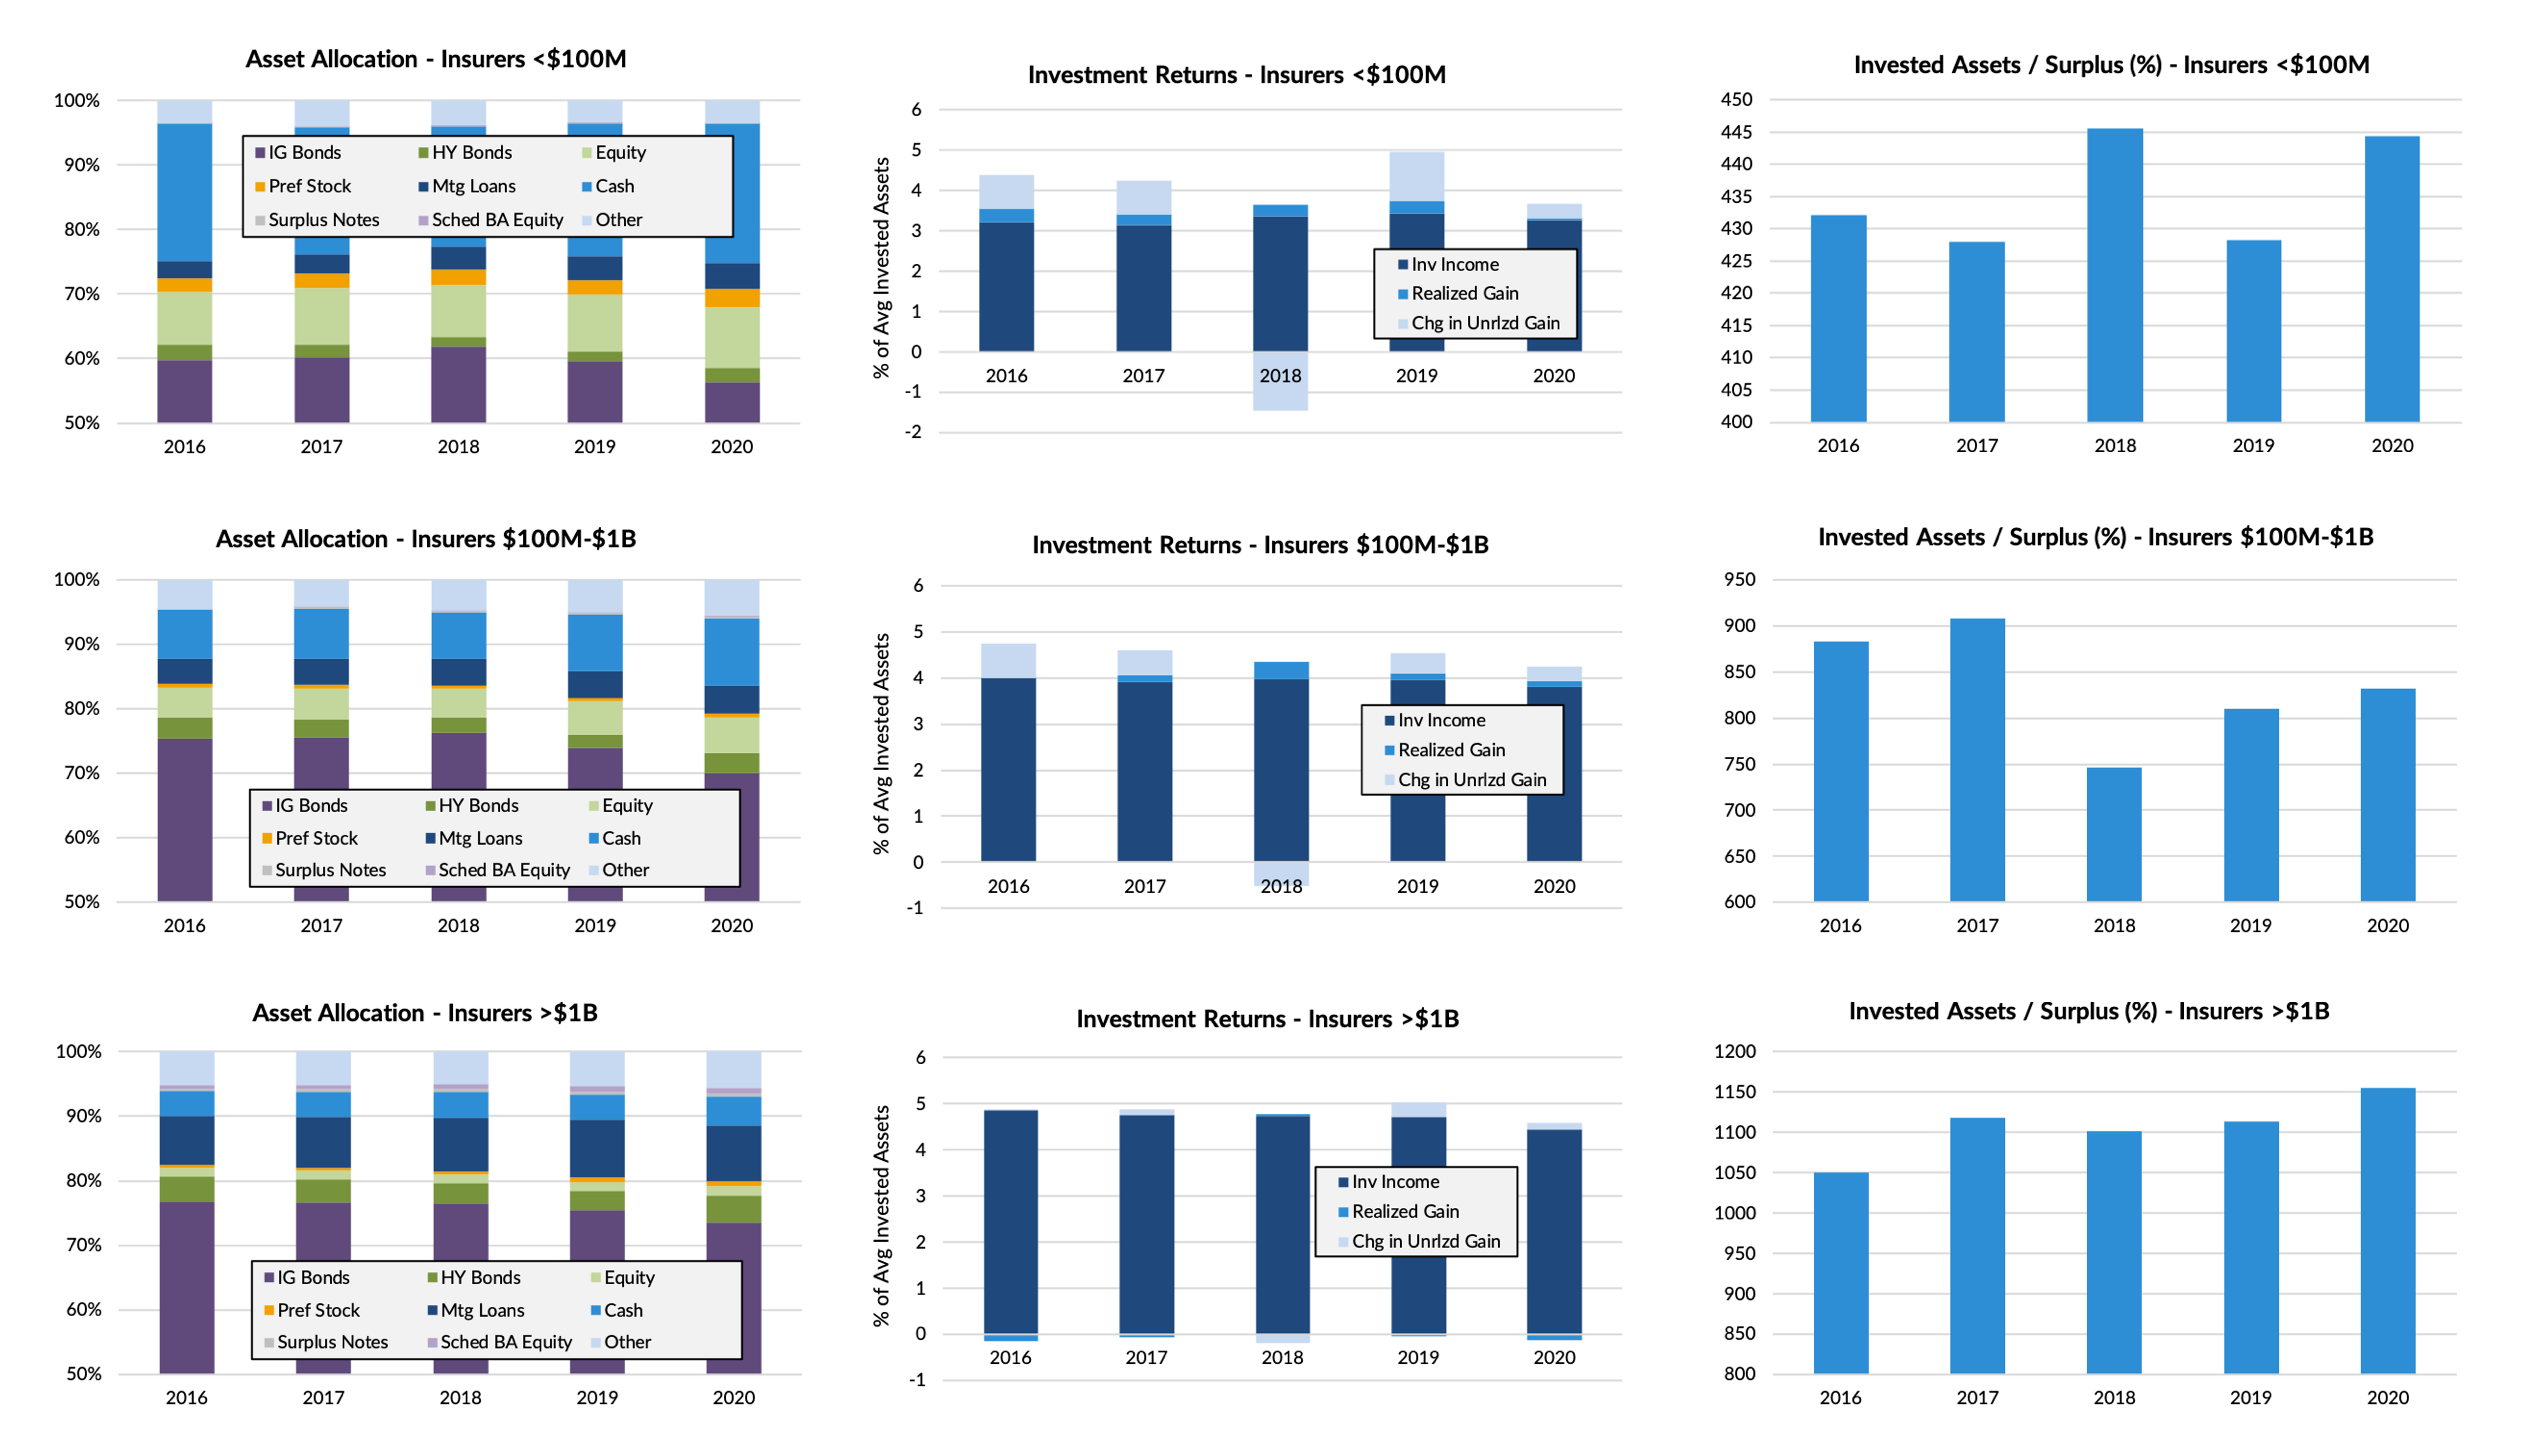
  • P&C insurers invest primarily in IG bonds and equity, with small allocations to other assets. The larger P&C insurers get, the less cash and equity they tend to hold, and the more other assets (IG bonds, HY bonds, mortgage loans, Schedule BA assets) they allocate to. For reference, the asset marked as “Other” on the graphs primarily consists of Real Estate, much of which is not held for investment purposes.
  • Across all P&C insurers, IG bond holdings have modestly decreased in the past several years, with the largest share of the balance going into cash (especially in 2020). To the extent there’s been an increase in risky assets since 2016, it is very modest.
  • Larger insurers tend to have higher balance sheet leverage than smaller ones. Average leverage has fluctuated from year to year but without a clear trend.
  • Most Schedule BA assets held by P&C insurers are classed as having equity characteristics, likely constituting a mix of private equity, venture capital, and hedge fund holdings. Relatively few insurers with <$1 billion in assets allocate to Schedule BA assets, in part due to the complexity and high minimum investment sizes of these assets.
  • After enjoying a rise in investment income in 2018 and 2019 as rates gradually rose, insurers saw their portfolio yields drop notably in 2020 as the yield curve plummeted. Prospects for near-term improvement on this front appear dim.
  • Year-to-year trends in realized gains and mark-to-market surplus gains are primarily driven by annual equity market performance, which has been positive in all recent years except 2018.

Life Industry

Life companies have significant differences in how they invest based on the data we observed:

  • Life companies also hold core allocations to IG bonds, with additional holdings in cash, equity, HY bonds, and mortgage loans. Once again, Schedule BA holdings are mostly concentrated among the largest insurers.
  • As with P&C companies, larger Life insurers tend to hold significantly less cash and a broader mix of assets. For the largest insurers, mortgage loans represent the 2nd largest category of holdings, whereas equity holds this position for small- and medium-sized companies. Smaller companies also tend to hold more preferred stock than larger ones, perhaps due to the small size of the sector and the challenges larger insurers face in building diversified allocations.
  • As with P&C companies, allocations to IG bonds have declined since 2016, though significant variability exists among which other sectors have benefited. For small and medium companies cash received the largest share (especially in 2020), but for the largest insurers mortgage loans were the largest beneficiary.
  • Large Life companies earn significantly higher investment yields, and receive less returns in the form of realized or mark-to-market gains. Yields for all insurers declined significantly in 2020.
  • There is a strong positive correlation between Life insurer size and balance sheet leverage.

Conclusions

The question of “are insurers increasing allocations to risk assets to offset low bond yields?” has been perennial in the recent years. Articles on this question often answer in the affirmative, though there’s little sign in the data of any broad movement towards increased risk exposure since 2016 (admittedly this period included a phase of improving bond yields). We believe a more accurate conclusion would be that insurer asset allocations are impressively stable from year to year, and it’s likely that small year-to-year fluctuations in e.g. equity exposure are mainly driven by organic changes in market value rather than strategic reallocations. The largest asset shift in recent years across all industries seemed to be the growth of cash in 2020, likely due to the challenging investment environment that prevailed at year-end of richly valued equities and record-low bond yields.

Overall, we believe  this suggests a commendable degree of investment discipline among insurers, reflecting neither aggressive overreach to offset declining bond yields, nor conservative de-risking in response to years of unprecedentedly rapid gains in risky assets. Ultimately regardless of size or business lines, we believe all insurers would be well advised to identify strategic asset allocations tied to their return objectives and tolerance for surplus volatility, and stay the course during periods of volatility rather than chasing strong returns after the fact, or selling at the bottom of a decline.

Note: All data sourced from S&P Global Market Intelligence, as of 12/31/20. P&C data based on 801 companies with minimum 3yrs operating history and invested assets >$10 million. Life data based on 283 insurers with minimum 3yrs operating history and invested assets >$10 million. Observations and conclusions are that of AAM and are subject to change should market conditions warrant. Please see attached data which is an integral part of the paper.

Appendix

Property and Casualty

Source: S&P Global Market Intelligence. Data as of 12/31/20

Life

Source: S&P Global Market Intelligence. Data as of 12/31/20

September 30, 2020 by

Recap on Leveraged Loans

Leveraged Loans are senior ranking floating rate debt instruments typically issued by companies with below investment grade credit ratings. A key advantage of loans is that 97% of the market is 1st lien senior secured debt which is higher seniority in the capital structure (1). In the event of default, this priority claim on assets has resulted in higher long-term average recovery rates of 67% (2). By comparison, most bonds are issued as senior unsecured debt which has long-term recovery rates of 38% (2).  

Most loan coupons reset referencing 3 month Libor.  But an important feature in today’s low short-term rate environment is that almost all loans have the benefit of Libor floors which limits how far coupons can drop and in turn helps to protect returns. 

Exhibit 1: Illustrative Corporate Capital Structure

Source: Based on our views and opinion, provided for illustrative purposes only, and not to be construed as investment advice. Source: Recovery rate Moody’s Annual Default Study, published January 30, 2020.

Exhibit 2: Loan Market Libor Floors

Source: Data as of June 30, 2020.  Source Bloomberg, JP Morgan and S&P Global Market Intelligence LCD.

Growth of the US Loan Market and Investor Base

The US loan market has grown significantly since the global financial crisis (GFC) and now stands at $1.27 trillion (3). The U.S. Collateralized Loan Obligation (CLO) market has been a significant driver of demand for loans accounting for as much as 60% of the investor base in recent years. In 2020, however, COVID related concerns reduced CLO issuance which temporarily tempered demand for loans. In addition, retail fund flows are generally correlated to interest rate expectations so recent flows to the loan market have been negative as US Treasury rates reached historic lows.

Exhibit 3: Annual US CLO Activity

Source: Data as of August 31, 2020. LCD, an offering of S&P Global Market Intelligence US CLO Stats and Trends Data. YTD 2019 refers to where CLO activity stood from January 1, 2019 to August 31, 2019.

Exhibit 4: Retail Fund Flows and 10 Year Treasury Yields

Source: Data as of August 31, 2020. JP Morgan High Yield Bond and Leveraged Loan Market Monitor. ICE BofA ML Current 10-Year US Treasury Index (GA10) yield to worst sourced from Bloomberg.

Current Valuations in Leveraged Loans

These technical headwinds, along with the recent repricing of risk valuations have caused leveraged loan credit spreads to remain at levels which we believe have historically been attractive entry points for the sector. While trailing 12-month default rates have increased to 4%, we believe that rate should peak in the high single digit percentages in 2020 followed by a decline in 2021 (4). Accordingly, loan spreads over Libor (discount margins) remain elevated, while we believe the average discounted dollar price offers a pull to par opportunity to capture returns as we seek to manage opportunities prudently through the credit cycle. In addition, a recent resurgence in CLO issuance as well as the potential return of retail fund flows could be a catalyst for improving demand. 

Exhibit 5: Weighted Average Bid Price ($)

Source: Credit Suisse Leveraged Loan Index. Monthly data as of August 31, 2020.

Exhibit 6: Discount Margin – 3 Year Life (bps)

Source: Credit Suisse Leveraged Loan Index. Monthly data as of August 31, 2020.

Where Should Leveraged Loans Sit in Insurance Portfolios?

Leveraged loans typically compete for shelf space with high yield in investors’ portfolios. While both products are sub-investment grade lending at heart, there are some significant differences between the products that complement each other well and could provide diversification benefits to an investor’s overall below investment grade exposure. In contrast to high yield bonds, loans are a floating rate product, callable at any time, and typically exhibit lower volatility due to the almost exclusively institutional nature of the investor base. Loans sit higher in the corporate capital structure than high yield bonds, providing different risk considerations. While both asset classes may suffer defaults in a recession, loan recovery rates should be higher than high yield given their senior secured position in borrowers’ capital structure. Finally, loans can offer some additional sector diversity. Of particular relevance this year has been the fact that the loan market had an energy sector exposure of 3% at the end of February 2020, versus 12% for high yield (5).

Regulatory Considerations for Insurance Companies

Leveraged loans are schedule D assets with Risk Based Capital charges similar to below investment grade bonds. Almost 90% of the loan market is rated either BB (NAIC 3 equivalent) or B (NAIC 4 equivalent) so we’ve highlighted those corresponding capital charges in the table below (6).

Exhibit 7

Source: NAIC Investment RBC Charges 3/12/18.

Conclusion

In our view, the loan market today is possibly nearing the trough of an economic cycle and should be well positioned for the recovery, both fundamentally and technically. We believe this should create opportunities for investors who can look beyond the headlines. If rates rise again, then retail investors will most likely return to the market in anticipation of this. CLOs, which paused their issuance at the market wides, are being created again, and in the short term demand for loans is likely to outstrip thin supply.

The convergence of global interest rates around zero once again also removes one of the major obstacles for international investors looking at US syndicated loans as hedging costs for buying USD assets have come down substantially. We can also expect to see more international flows into the US syndicated loan market in the coming months seeking to take advantage of the enhanced return opportunity.

We believe loans represent an appealing investment opportunity as a lower volatility source of carry for insurance investors, coupled with some upside potential through the pull to par opportunity in the current market. 

In our opinion, insurance investors seeking to minimize defaults might consider an allocation to loans through an actively managed strategy with a focus on higher quality issuers.

Index Definitions and Sources

CS Leveraged Loan Index – The CS Leveraged Loan Index is designed to mirror the investable universe of US dollar denominated leveraged loan market. The index is rebalanced monthly on the last business day of the month instead of daily. Qualifying loans must have a minimum outstanding balance of $100 million for all facilities except TL A facilities (TL A facilities need a minimum outstanding balance of $1 billion), issuers domiciled in developed countries, at least one year long tenor, be rated “5B” or lower, fully funded and priced by a third party vendor at month-end.

GA10 – The ICE BofA ML Current 10-Year US Treasury Index is a one-security index comprised of the most recently issued 10-year US Treasury note.

LIBOR – LIBOR is a benchmark rate that represents the interest rate at which banks offer to lend funds to one another in the international interbank market for short-term loans. LIBOR is an average value of the interest-rate which is calculated from estimates submitted by the leading global banks, on a daily basis.

Sources

(1) Credit Suisse Leveraged Loan Index as of August 31, 2020.

(2) Recovery rate Moody’s Annual Default Study, published January 30, 2020.  Issuer weighed recoveries 1983-2019. 

(3) Credit Suisse Leveraged Loan Index as of August 31, 2020.

(4) S&P Leveraged Commentary and Data (LCD) index review as of 8/31/2020.

(5) Credit Suisse Leveraged Loan Index (CSLL) and the ICE BofA ML US High Yield Index (H0A0) as of June 30th, 2020.

(6) Credit Suisse Leveraged Loan Index as of 8/31/2020.

Authors

Sam McGairl joined Muzinich in 2016.  He is a Portfolio Manager focusing on syndicated loans. Prior to joining Muzinich, Sam was with ECM Asset Management Limited, where he was a Portfolio Manager responsible for loan and high yield investments in the firm’s pooled loan programmes, as well as being responsible for loan trading across all ECM portfolios. Sam started his career at Bank of Scotland and BNP Paribas before ECM. He is a graduate of the University of Newcastle upon Tyne.

Scott Skowronski, CFA is a Principal, Vice President, and Senior Portfolio Manager at AAM. He has 24 years of investment experience, 19 of which have been dedicated to fixed income. Scott is responsible for constructing portfolios based on client-specific objectives, constraints, and risk preferences.  He is also responsible for communicating market developments and portfolio updates to clients. In addition to this, Scott is a member of AAM’s ‘Outsourced CIO’ Committee. Immediately prior to joining AAM, Scott worked as a Portfolio Manager and Senior Analyst at Brandes Investment Partners. He is a member of the CFA Institute. Scott earned a BA in Risk Management from Illinois Wesleyan University.

September 8, 2020 by

It’s been an active year for markets. At AAM our asset allocation philosophy remains unchanged: that tolerance for investment risk should be periodically defined through a rigorous ERM process, and targeted to levels that will allow an insurer to weather stress events without forced sales and realized losses. Price volatility on risky assets should be viewed as part of an ordinary market cycle, even when prompted by unpredictable events. Still, we draw a number of lessons from the experiences of the year:

Monetary and fiscal easing have compressed market risk, not eliminated it

Since mid 2019 the Federal Reserve’s balance sheet has nearly doubled amid escalating rounds of asset purchases, rising from $3.8 trillion to $7 trillion. Aggressive stimulus programs have caused US Federal debt outstanding to rise by 14% in just the first 6 months of 2020, even as US GDP fell by an annualized 5% in Q1 2020 and a further 32% in Q2, and unemployment rose from 3.5% at year-end to 10.2% at 7/31/20. Interest rates have also dropped to historic levels, with the 10yr Treasury rate currently at 0.63%, less than half the all-time low pre-COVID.

Amid this challenging economic backdrop equities remain unfazed. After several weeks of sharp declines in the early stages of the crisis equities swiftly recaptured most of their losses (setting records for the fastest gains ever achieved within a recession), and in a scant few months had made new all-time highs despite persistent economic fragility and projections that the economy would take years to reach pre-COVID levels of employment and GDP. YTD through 8/31 the S&P 500 is up 9.7% and the tech-heavy NASDAQ is up a stunning 32.1% as mega-cap industry champions have come to dominate markets, with the 5 largest companies making up a remarkable and unprecedented 25% of S&P 500 total market cap. The small-cap Russell 2000 remains down 5.5% through 8/31, but such companies represent a shrinking share of the overall equity market.

This pattern of market declines being swiftly arrested and reversed after top-down interventions has become familiar. In late 2018 a slowing economy and inverted yield curve prompted a market selloff and led the Fed to abandon its rate-tightening program and resume easing, and equity roared back in 2019 to deliver the strongest annual return in decades. In late summer 2019 turmoil in repo markets shaved almost 200 points off the S&P 500, but these losses were quickly reversed once the Fed switched from shrinking its balance sheet to implementing a new round of asset purchases. While COVID has presented the largest crisis of investor confidence since the 2008 Great Recession, it appears the aggressive fiscal and monetary responses have once again succeeded in reigniting animal spirits and incentivizing investment risk-taking, albeit at the cost of a swollen Federal debt burden and Fed balance sheet.

This tendency of recent losses to be rapidly recaptured carries cautionary implications for investment risk management, the most important one being that investors should maintain robust risk discipline and not assume this pattern will persist forever or that market risk has been eliminated or indefinitely deferred. Interventions are capable of compressing risk, but to the extent that extraordinary debt levels, spending commitments, and money supply growth temporarily implemented to avert crises aren’t unwound during periods of calm, they represent a reduced capacity to support markets in subsequent periods of volatility. Investors should bear in mind that market history holds many periods of prolonged drawdowns between market peaks (the S&P 500 first reached the 1,500 level in 2000, but didn’t successfully hold it until 2013), and not assume that losses must inevitably be recouped within months or weeks. A risk asset allocation that can’t be maintained if losses aren’t swiftly recovered, is an allocation that’s too large.

Diversification is important, but not easy to come by in a downturn

Diversification across issuers, sectors, and asset classes is one of the most powerful tools investors hold for mitigating investment risks. Insurers typically hold a core portfolio of investment-grade bonds, and a “risk portfolio” of equities, convertible bonds, high yield bonds, and other assets. While some of these risk asset classes may appear to offer meaningful diversification against each other during normal market conditions, the COVID volatility this spring reinforced another lesson last observed during 2008: that relatively risky assets tend to all suffer stress losses simultaneously regardless of their behavior during other periods. Comparing historical monthly returns of assets including Domestic Equity, EAFE Equity, Emerging Market Equity, Ba-B High Yield Bonds, Bank Loans, and CLO Equity, we find correlations ranging from 50-75%. This would seem to represent a material degree of diversification, but we also find that all of these assets had their worst two 30-day returns of the past two decades in the same periods of fall 2008 and spring 2020. Insofar as we seek to measure asset volatility primarily so we can limit it to manageable levels during stress scenarios, we conclude that these assets offer little “real” diversification when it’s needed most. Asset modeling designed to measure and limit stress-case declines (as AAM’s does) must take care to reflect that “normal” market correlations may overstate the diversification benefits of holding multiple risky assets during periods of systemic stress.

That said, the largest diversification benefit we find remains the longstanding relationship between IG bonds and equities (or equity-like assets like convertible bonds). The long-term correlation of monthly returns between the Barclays Aggregate and the S&P 500 is just 1.7%, offering an impressive degree of true diversification across market cycles. Holding the Barclays Aggregate since 1992 would’ve provided an annualized return of 5.56% and standard deviation of 3.53%, but moving 10% of your investment into the S&P 500 at the start of that period would’ve increased returns to 6.08% with no increase in volatility of returns. This phenomenon has been referred to for years as the “only free lunch in investing”.

On a final note, when it comes to assets that provide a real hedge against market volatility it’s hard to do better than long Treasury bonds; we calculate that the iShares >20yr Treasury Bond ETF has a long-term -33% correlation of monthly returns with the S&P 500 (though this spiked to -68% during the first 6 months of 2020). However, long Treasuries also bring considerable duration risk and price volatility, and may underperform for long periods during relatively unstressed market conditions, especially given the very low yields currently prevailing. I mention this not to necessarily recommend this asset as risk management tool (again, right-sized risk exposures are a better risk mitigation strategy), but as an example of what especially strong diversification actually looks like, in contrast to assets that show ~60% correlation under ordinary conditions and higher correlation during volatility.

The best protection in periods of volatility is already having a plan in place, and sticking to it

This spring saw the largest 30-day decline in equity markets in history. Daily headlines proclaimed new cities shutting down, new industries facing evaporating demand, new layoffs, and of course new COVID case and death counts. It was an unnerving time to be exposed to fixed income and equity markets, and the natural human inclination during such periods is to wonder whether to change one’s strategy, whether by sharply reducing risk exposures during the selloff, or even potentially by adding assets at distressed levels that may not persist for long.

This is natural to think about, but we don’t recommend doing it. “Changing horses in midstream” is one of the canonical ways psychology leads investors to underperform. The takeaway from COVID is not that risk should’ve been reduced in January (when it was far from clear that COVID was a material risk), or that it should’ve been increased in mid March (when no one knew just how bad the economic disruption would get). The lesson is instead that investment guidelines and strategy should already reflect the potential for periods of volatility, and describe how the investment manager should respond (if at all; patiently holding existing exposures is often the correct choice). Risk asset exposures should be sized to levels where stress-case volatility is bearable, and portfolios should include assets (like Agency MBS) likely to preserve their market value and liquidity during periods of economic stress.

Such periods do frequently represent opportunities to add assets and sectors at highly attractive entry points, insofar as price declines are excessive relative to companies’ underlying financial strength. Once again, it’s best to use periods of market calm to approve opportunistic allocations (high yield bonds are one example of an asset where capitalizing on an attractive entry point can lead to years of strong returns), so that the manager can take action swiftly when volatility inevitably arrives. Such approaches should clearly define what constitutes an “attractive entry point”, and try to make the process as automatic as possible to reduce the potential for ambiguity during high-stress (in every sense of the word) market environments.

Of course, in many cases the right approach will simply be to hold one’s pre-defined risk asset exposure all through volatile periods (subject to defined and regular rebalancing), recognizing that whether or not losses are quickly recouped, attempts to time tops and bottoms tend to be driven by emotion rather than rational calculation, and are a notorious source of underperformance. Having a clearly defined plan in advance provides strong psychological support to maintaining good investment discipline when it is needed most.

Conclusion

At this writing, COVID’s impact on risk assets has been more comparable to the ephemeral late-2018 dip than the 2000 or 2008 declines that took years to recover from (however, interest rates remain close to the lows of the spring, and look like they’ll have a more gradual recovery). This is a bright spot in a year that has been painfully short on them. We recommend that insurers use this period of market recovery to ensure their investment guidelines and asset allocation strategies are clearly defined, integrated into their internal ERM programs, and equipped to successfully respond to periods of market stress. Sooner or later another one will come, but with proper preparation they can bring prudent investors opportunities to lock in strong returns while containing losses within tolerable limits. 

Data Sources

All index, investment return, and diversification impact data sourced from Bloomberg

Unemployment statistics from Bureau of Labor Statistics

GDP data from Bureau of Economic Analysis

Federal Reserve balance sheet data from Federal Reserve

All data as of 7/31/20 except as noted in the text

August 20, 2019 by

Given the persistent low interest rate environment, investment managers require flexibility to employ strategies that maximize a portfolio’s income within the constraints of their clients’ mandates. A segment of the market that is often overly constrained is 144A private placement issues. While not all investors are qualified to purchase 144A issues, the expanded opportunity set in these issues makes a compelling case for increasing 144A limits for those that do. 

What are 144A securities?

When a bond issuer offers a security to the investing public, the Securities Act of 1933 requires that the issuer register the bonds with the Securities and Exchange Commission (SEC). This process entails extensive documentation, review, and recurring disclosures. However, there is an exception for bonds issued under Rule 144A, which allows privately placed securities to be sold and traded to Qualified Institutional Buyers (QIBs) without SEC registration. QIBs are defined as institutions (not individuals), deemed to be an “accredited investor” under Rule 501 of the SEC’s Regulation D. To qualify as a QIB under Rule 144A, an insurance company must have a minimum of $100 million in unaffiliated invested assets on a discretionary basis. The exception for QIBs is made because they are viewed as having more resources and access to information versus smaller institutions. As such, it is inferred that they can make sound investment decisions despite potentially having less information and ongoing required reporting provided by securities registered with the SEC.

144A securities can be issued with or without registration rights. For those issued with registration rights, the issuer hasn’t filed for registration with the SEC but intends to do so within a specified time period after issuance. Once they are registered, the 144A securities are subsequently exchanged for newly created public securities. For those issued without registration rights, the securities will remain unregistered until maturity.

What are the benefits for an issuer of 144A securities?

From an issuer’s perspective, there are a number of advantages to issue bonds under Rule 144A. First, there is no required public disclosure of sensitive information, no SEC review process, and ongoing reporting requirements are reduced. Second, 144A issuance decreases the potential for liability under the Securities Act. Third, issuers can access the market more quickly since the process of registering a bond with the SEC can delay the timing of an issue. Finally, the issuers’ costs are lower as they are able to forgo pre-issuance registration, significant underwriting fees, and ongoing reporting post-issuance.

What are the benefits of buying 144A securities for QIBs?

With the advantages to the issuer being fairly straight forward, the primary benefit to the investor is access to a greater supply of bonds. Over the past decade, the amount of 144A issuance has accelerated at a much faster rate than public bonds. The outstanding issuance of investment grade 144A (excluding structured sectors: asset backed securities, commercial mortgage backed securities, and non-agency residential mortgage securities) since 12/31/08 has increased from $341B to $1,637B (380% growth) versus the Barclays Aggregate increase of $11,430B to $20,836B (82% growth). 

In the structured sectors, the growth of 144A issuance since the financial crisis has been even more pronounced. In the Asset Backed and Commercial Mortgage Backed Sectors, over half of the bonds in 2018 were issued under Rule 144A (Exhibit 1). In the Non-Agency Residential Mortgage Backed Sector, almost all of the securitizations in the past few years have been issued under Rule 144A. 

Exhibit 1

Source: J.P. Morgan, Bloomberg

A greater supply of bonds is the primary benefit of 144A issues to investors, but it’s not the only one. Underwriters of 144A structured securities typically provide more granular loan level data, which isn’t made available for public issues. This feature allows investment management research teams to better understand the characteristics of the underlying collateral, model cash flows, and predict deal performance.

While some 144A issues may offer a yield benefit, increasing the limit on 144A issued securities is not necessarily a yield enhancement strategy. In an acknowledgement from the market that public issues versus 144A are nearly identical, there is very little or no yield premium for a given issuer whether they come with a 144A versus a public transaction. Increasing 144A limits is really about expanding the opportunity set, particularly in the ABS, CMBS, and Non-Agency RMBS sectors. For example, the entire single property CMBS market and nearly the entire ABS market outside of prime auto deals and credit card transactions are 144A. 

Given the pool of potential investors in 144A is limited to those with QIB status, it would be reasonable to assume that 144A issues are less liquid than public bonds. However, liquidity for both fully registered and 144A securities is impacted primarily by the specific issue characteristics which include issue size and credit quality. Bid side indications for similar tenor public and 144A bonds are generally the same. An example is shown in exhibit 2.

Exhibit 2

Source: Bloomberg, AAM

Conclusion

As 144A private placements become a larger component of the bond market, they warrant consideration as a greater percentage of portfolios for QIB investors. Constraining 144A to a small percentage of a portfolios’ holdings is an outdated restriction in today’s market, limits the investment options for managers, and doesn’t necessarily reduce a portfolio’s risk profile. If your investment guidelines have restrictions on the exposure to 144A issues, ask your investment manager about whether increasing those limits would benefit your portfolio’s diversification and opportunity set. 

March 19, 2019 by

This case study was written by Stephen Bard, Chief Operating Officer of Zazove Associates, AAM’s sub-advisor partner for convertible bonds, with contributing authorship belonging to AAM’s Tim Senechalle.

We are roughly nine years into a bull market with many indices having recently been at or near all-time highs. While timing the top of the market is tempting, academics agree that it is a difficult, if not impossible task. An allocation to convertible securities allows an investor to maintain equity exposure, while simultaneously reducing downside participation and risk.

The past decade has been one driven by synchronized worldwide Central Bank easing. The general result has been highly correlated positive returns with constrained volatility. The fourth quarter of 2018 provided a sharp contrast to that norm.

The end of an era

As markets struggle with the end of accommodative Fed policy, the likely outcome is less correlation and decidedly higher volatility. The Zazove convertible strategy is well-suited for this new environment. The combination of stock declines and robust new issuance has created a very attractive universe of balanced convertibles. This allows for the building of high-quality, properly diversified portfolios that can benefit from a market recovery yet be sheltered from continued declines and volatility. As illustrated in Figure 1, balanced convertibles provide investors with equity upside participation with downside protection.

Figure 1

Source: Zazove Associates. For illustrative purposes only.

The fourth quarter of 2018 provided an ideal environment for balanced convertibles to perform and for active managers like Zazove to rebalance portfolios. Given the backdrop of declining stock markets it is not surprising that the primary catalyst within the convertible universe during the quarter was equity sensitivity. While lower Treasury yields, widening credit spreads and spiking volatility also impacted valuations, it was the dramatic equity moves that mostly drove returns.

As expected, the more balanced portion of the convertible universe did an exceptional job of providing downside protection to often stunning equity declines. In contrast, the significant portion of the convertible market that was high delta and equity sensitive fell in lock step with underlying equities.

In it for the long run

The fourth quarter also presented an ideal environment for Zazove’s disciplined, active investment process. Convertible positions that moved down the curve became sell candidates and provided a source of funds to exploit the numerous opportunities created by stock weakness and volatility. As a result of 50%+ stock declines, previously equity-like convertibles became more balanced, valuations became more attractive and yields increased. Each of these factors allowed Zazove to reposition and optimize client portfolios in the balanced region. The traditionally quiet year-end was one of the most active in years and despite the volatility, trading and liquidity remained orderly.

Convertible issuance, combined with the fourth quarter equity market declines, allowed Zazove to counteract two fundamental risk factors associated with the convertible market today: sector concentration and equity sensitivity.

In the aggregate, balanced convertibles provided upside participation as equities climbed during the first three quarters of 2018, while delivering downside protection as markets fell in the fourth quarter. Over a complete market cycle – which has not been seen in nearly ten years – it is expected that the return profile provided by balanced convertibles will result in equity-like returns with less volatility.

Insurance companies, considering statutory accounting principles and regulatory capital requirements, witnessed additional benefits of balanced convertibles during 2018. Since convertibles are treated as bonds on the balance sheet, a significant portion of the economic volatility in the marketplace during Q4 had no impact on statutory capital. Over a market cycle, the long-term exposure to equities should produce realized capital gains while the interim price volatility is muted by the statutory treatment as bonds. Further, the required capital within regulatory and rating agency capital models is substantially lower for convertibles when compared to equities.

More volatility to come?

If the fourth quarter of 2018 foreshadows renewed 2019 market volatility that would be a positive development for investors in Zazove’s balanced convertible strategies. As an active manager, volatility provides abundant trading opportunities and allows for rebalancing, taking advantage of attractive valuations, and continuing to optimize portfolio risk/reward structure. In the long run, volatility increases the value of the embedded option of convertibles.

The supply of balanced convertibles is robust and the opportunity to construct portfolios with compelling risk/return structures is as healthy as it has been in more than a decade.

In summary

• Convertibles are unique and worthy of consideration as part of an asset allocation process;
• The risk/reward profile and low correlations of convertibles are an attractive use of risk budget;
• Insurance companies benefit from reduced potential volatility of capital and improved required regulatory capital relative to equity investments;
• Current market dynamics should prompt fiduciaries to assess the asset class, if they haven’t already.

The opportunity set and trading environment for convertibles is as strong as it has been in years and 2019 should be more of the same.

Please contact us if you would like to schedule a call or meeting with AAM or Zazove Associates to discuss how convertibles can be incorporated into your portfolio and risk budget.

Full length white paper

For access to Zazove Associate’s full length white paper on convertible bonds, please fill out the form provided below.

Access Form

Contact

At AAM:
Tim Senechalle – Senior Portfolio Manager
tim.senechalle@aamcompany.com

John Olvany – Vice President of Business Development
john.olvany@aamcompany.com

Neelm Hameer – Vice President of Business Development
neelm.hameer@aamcompany.com

At Zazove:
Stephen Bard – Chief Operating Officer
sbard@zazove.com

Götz Sennhenn – Director, Client Relations & Business Development
gsennhenn@zazove.com

About Zazove Associates
Zazove Associates, LLC is an independent, employee-owned institutional investment firm that specializes in convertible securities management. The firm was founded in 1971 and manages $2.5 billion in client assets. Zazove works with a range of institutional investors, including insurance companies, public and corporate pension plans, foundations, and family offices. The firm manages a broad range of convertible strategies and invests across the credit spectrum and around the globe. Zazove’s highly disciplined and repeatable approach to convertible investing has generated equity-like returns with significantly less risk over complete market cycles.

January 24, 2019 by

Economic Outlook

Following two strong quarters of economic activity, U.S. real GDP growth for Q4 2018 and for all of 2019 appears to be slowing towards the economy’s long-term trend rate. On a year-over-year basis (q4/q4), real GDP growth is forecasted to slow from a 3.1% pace for 2018 to 2.2% for 2019. Reduced impact from the tax cuts and fiscal stimulus are reasons for the forecasted slowdown. Consumer spending, which increased around 2.8% in 2018, is projected to moderate to 2.4% for 2019. A strong labor market and rising wages should continue to support spending. Also driving the slower growth projection for 2019 is weaker business spending/investment. Recent declines in business sentiment suggest manufacturers and service-sector businesses are becoming less confident with the economic outlook. Additional downside risks to growth include a Fed policy mistake, slowing global growth, trade tensions, and geopolitical risks. We are calling for below-consensus GDP growth in 2019 as we view the risks to growth as skewed to the downside. We do not expect the U.S. economy to fall into a recession in 2019.

The Federal Reserve seems to have become more dovish as downside risks to economic growth have increased. Recent comments from Fed officials suggest they will be more “patient” with future rate hikes, with Fed policy becoming more data dependent. We believe the Fed will be closely monitoring incoming data for signs of increasing inflation (CPI, core PCE), strengthening labor markets (unemployment rate, wages), increases in market based inflation expectations (forward breakeven rates), and increases in survey based measures of inflation (ISM prices paid, consumer inflation expectations). With economic growth slowing and inflation expected to remain near the Fed’s target of 2%, we expect them to increase the Fed Funds target range one time this year, or 25 basis points.

Treasury yields, according to consensus forecasts, are expected to move modestly higher from current levels. The benchmark 10-year Treasury yield is forecasted to end 2019 at 3.15% based on the median forecast among economists. The yield spread between the 10 year and 2 year Treasury notes is expected to remain in a tight range of 20bps. We are calling for the 10 year Treasury yield to end the year modestly higher but below 3%. Exhibit 1 lists our risks to U.S. GDP Growth, Inflation, and Treasury Yields.

Exhibit 1: GDP Growth, Inflation, and Treasury Yield Risks

Source: AAM

Fixed Income

2018 – Going into 2018 we anticipated the Fed to raise the Funds rate, causing the economy to slow and the yield curve to flatten. The Fed raised the Funds rate by 1.0% with the final nail in the coffin coming in December. We saw the economy slowing in Q4 which, when coupled with apparent Fed indifference to the current state of the economy and the market’s gyrations, caused a significant selloff. In December, equities fell, credit spreads widened, and we finished the year with losses and uncertainty across a number of sectors.

2019 – We expect that the Fed will have significantly less impact on the markets in 2019. Recently, they have indicated more of a “wait and see” approach while the market is pricing in zero rate hikes for 2019. Just as investors could only see bad news after the December 19th Fed meeting, it seems that there is nothing but roses since the new year.

Our expectation for interest rates is that the yield curve will not invert, and 10 year Treasury yields will stay below 3.0%. There are number of risks to this benign forecast that include but are not limited to: failed Chinese tariff negotiations, stalling economic growth in Europe, a hard Brexit, or a spike in wage driven inflation.

AAM expects that 2019 will be a positive environment for spread product and equities. However, given the potential impediments to growth, risk assets are NOT attractive enough to aggressively overweight. We recommend that risk allocations be maintained at a conservative level in order to allow flexibility to add should the markets stumble. Once again, we anticipate individual security selection and a focus on risk will prove to be the right call in 2019.

Exhibit 2: 2018 Returns by Asset Class

Source: Bloomberg Barclays Index Series, S&P 500, Barclays Global High Yield Index, VOA0 (Merrill Lynch Convertibles Ex-Mandatory)

Corporate Credit

2018 was a disappointing year for the markets despite record revenue and profit growth. After a period of credit creation in 2016-2017, the unwind of QE programs and higher rates caused a sharp slowdown in credit creation from both the private sector and central banks in 2018. The Investment Grade (IG) market also suffered from idiosyncratic events related to GE, Goldman Sachs, Comcast, PCG and the tobacco companies. The spread to Treasuries for the IG market (OAS) closed the year 60 basis points wider with BBBs and longer maturities underperforming.

Exhibit 3: Global central bank securities purchases, rolling 12 months ($T)

Source: National Central Banks, Citi Research

We expect revenue and EBITDA growth rates to decelerate in 2019 to approximately 5% and 8% respectively on average. Capital spending is also expected to decelerate to 2-3%. Debt leverage for IG companies on aggregate changed very little in 2018, but given the focus on debt by the equity community and rating agencies today, we expect companies with over-leveraged balance sheets to work more proactively to reduce debt leverage in 2019. However we do not expect this to be widespread since: (1) lower growth rates make it more difficult to reduce leverage organically, as the equity market has become accustomed to companies using the majority of their excess cash to repurchase stock, and (2) historically, the C-suite does not get more aggressive with credit improvement unless the cost of debt approaches the cost of equity, which has not yet occurred. Therefore, we believe material fundamental credit improvement will be challenging in 2019, with companies facing uncertain growth outlooks and higher costs (labor, transport, interest, trade).

From a technical or supply/demand perspective, we expect net supply of IG bonds to be down materially in 2019 due to the high level of debt maturing, and gross debt supply to be down modestly. This environment of uncertainty/volatility does not support increased M&A activity, and despite improved economics from year-end 2017 (i.e., the spread between earnings yield and the after tax cost of debt), we would not expect an acceleration of debt financed share repurchase activity. Therefore, net supply should be related to refinancing upcoming maturities and tendering others. We believe the demand for IG debt could be lackluster again in 2019 due to higher short term rates and the shape of the Treasury curve. Therefore, we expect another year of less supportive technicals.  

Valuations have improved with the IG OAS widening to a point at year end 2018 that reflects an approximate 25% probability of a recession, and the spread premium for BBBs vs. A/higher rated securities widening towards its historic average of 88 bps. Our credit cycle signals related to the shape of the Treasury curve and access to funding have weakened but do not flag the end of the credit cycle. However, given our economic outlook which has risks skewed to the downside, we do not consider current spreads to be “attractive.” Therefore, we would recommend maintaining a neutral position vs. a benchmark in the IG credit sector, investing cautiously in the asset class, preferring shorter duration bonds, sectors with stable cash flows through the economic cycle, and credits we consider to be higher quality from a balance sheet perspective. We have a constructive view on the following sectors: Banks, Pharmaceuticals, Midstream, Capital Goods, Food/Beverage, and Insurance. On the contrary, we are concerned with the fundamental performance of: Chemicals, Cable, Autos, Tobacco, Consumer Products, and lower quality Media credits. It is important to stress that security selection is critical at this late stage of the credit cycle.  

Our market and sector outlooks are supported by expectations of: (1) positive albeit lackluster economic growth in the US and EU (2) geopolitical events (i.e., trade talks with China, a hard Brexit, and Italy leaving the EU) remaining at a simmer point (3) Federal Reserve pausing its rate hike cycle.  If growth disappoints, the biggest upside surprise for all markets would be a reversal in the unwind of various QE programs to support and stimulate growth. We are not assigning a material probability to that in the US in 2019, since the labor market is far tighter than it was three years ago with unemployment below the natural rate.        

Structured Products

With the exception of shorter duration Asset Backed Securities (ABS), structured products performed relatively poorly in 2018.  The prospect of slowing domestic growth and dislocations in global trade caused risk assets to underperform less risky Agency and Treasury securities.  We’re cautiously optimistic that structured securities will perform better in 2019, although we do anticipate a fair amount of volatility over the course of the year.  We expect non-agency mortgage backed securities, Commercial Mortgage Backed Securities (CMBS), and consumer backed ABS securities to outperform lower risk assets.

Agency Residential Mortgage Backed Securities (RMBS) experienced their worst yearly performance relative to Treasuries since 2011 as spreads widened 25bps. Unlike in prior years when Federal Reserve asset purchases materially reduced the available supply of RMBS, balance sheet normalization which began in the second half of 2018, will provide an incremental $170b to $180B of supply which the market will struggle to absorb. Traditionally, domestic banks have been big purchasers of agency RMBS, but with the relaxation of liquidity rules for small and mid-sized banks and since money managers have generally been avoiding the sector, we don’t see the market being able to absorb the supply without some spread concession. In the most recent release of the FOMC minutes there was some discussion of selling securities from the mortgage portfolio, but we do not believe the Fed will follow through with any sales. Given the poor technical environment, we favor allocating investments elsewhere within structured products and to other spread sectors.  

Non-agency RMBS still represents an attractive investment option.  Credit fundamentals in the sector still look very good and since underwriting continues to be very conservative, we anticipate the sector outperforming agency RMBS and to a lesser extent Treasuries this year.  Housing price appreciation should slow to roughly 3.5% as compared to levels of 5% and 6% in prior years; however, we don’t anticipate that it will negatively impact the market. With the consumer being in such excellent financial shape due to low unemployment of 3.9% and wage growth of 3.2%, delinquency and default rates should remain at very low levels.

Commercial real estate fundamentals remain in relatively good shape following multiple years of property price appreciation and domestic economic strength. Conduit CMBS supply is estimated to be $70B this year which should prove to be very manageable including only $7.5B of maturing conduit loans in need of refinancing. Ordinarily this type of environment would lead us to conclude that CMBS spreads should tighten in 2019, however, we see more risk to the CMBS market from global economic risks and trade dislocations rather than technical and fundamental factors. Spreads of senior conduit CMBS securities tend to track single A rated corporate bonds fairly closely and we’re anticipating heightened volatility within the corporate sector this year. We expect spread levels to closely track corporate bond spreads but with slightly less volatility which should allow them to modestly outperform Treasuries and single A corporate bonds. Our investment of choice within the sector continues to be conservatively underwritten single asset transactions with low leverage. As in prior years we remain concerned about the retail sector, particularly regional malls in less populated areas, which must be carefully analyzed in any conduit securitization.

ABS was the only structured products sector to outperform Treasuries last year, and we believe they will outperform again in 2019. Healthy consumer balance sheets due to strong job growth and healthy wage gains will support credit performance. We’ll continue to maintain significant portfolio weightings in the asset class particularly in structures backed by consumer receivables. High credit quality and stable cash flows make ABS an attractive alternative to short Corporate Credit, Taxable municipals and Treasuries. Our favorite sub-sectors continue to be prime and some select subprime auto, credit card, and equipment transactions.

Municipal Market

We are maintaining a constructive bias for the tax-exempt sector. During the tumultuous level of volatility that stressed the capital markets during the latter half of 2018, the municipal sector held its ground and performed very well due to very favorable technical conditions. As we enter 2019, we remain constructive on the sector due to similar themes that are expected to see municipal relative valuations continue to improve, especially in the near term.

Tax-reform will once again play a large role in providing a solid technical environment for the tax-exempt sector. The Tax Cut and Jobs Act (TCJA) that passed late in 2017, eliminated the use of tax-exempt advanced refundings, which is a process that allowed issuers to effectively refinance their debt more than 90 days before the actual call date. Its absence resulted in a year-over-year decline in issuance of approximately $100 Billion during 2018 to $339 Billion and, in 2019, its repealed status will continue to suppress supply conditions. We expect to see only a 10% increase in new issuance to $375 Billion, and that level would be 14% below the average annual issuance produced in the three years before tax reform was implemented.

On the demand side, reinvestment flows of coupons/calls/maturities are expected to remain sizable during the year and provide ample support. The record level of refundings that were executed from 2015 to 2017 is expected to result in a large number of maturities during the year that will lead to net supply levels of negative $69 Billion. Although that’s not as extreme as the negative $121 Billion in net supply during 2018, it should remain as a major underpinning to the sector’s solid relative performance during the year.

In looking at the different market segments of demand, we expect that the muted investment behavior from institutional investors (primarily banks and insurance companies) in 2018 will continue to be in play during 2019. Municipal tax-adjusted yield levels at the new 21% corporate rate remain below that of Treasuries inside of 10 years and are well below that of taxable spread product across the yield curve. The Federal Reserve’s Flow of Funds data reported that banks reduced their exposure to municipals by approximately $40 Billion during the first three quarters of 2018, and we expect to see more right-sizing of institutional portfolios during the course of 2019.

However, we are also expecting the retail segment to remain fully engaged in the market. These investors will be flush with cash from reinvestment flows, and tax-adjusted yield levels for investors in the highest tax bracket of 40.8% (37% plus 3.8% Medicare surtax) look very compelling versus taxable alternatives. At the start of the year, grossed-up yields of tax-exempts were 116 basis points north of Treasuries in the 10 year maturity and were at comparable levels to corporates in maturities 10 years and shorter.

Additionally, we do not expect any headline risk to create selling pressure in the space, as we expect credit fundamentals to remain solid during the year. Individual and corporate tax revenues have been growing at a robust rate during 2018 and are expected to continue going forward. That should bode well for solid fiscal performance for state and local governments.

For our insurance portfolios, we believe that tax-adjusted yield levels remain unattractive versus taxable alternatives. However, the relative slope of the municipal curve remains steep from 2 to 20 years and we view the 11 to 20 year relative curve steepness as attractive. We will continue to look at underweighting the sector into any relative outperformance in favor of taxable alternatives that provide a better after-tax yield profile.

The risks to the upside include:

  • Stronger than consensus economic growth that would lead to even stronger tax revenue growth.

The risks to the downside include:

  • A continued downward move in oil prices could pressure the fiscal performance of the heavy oil-producing states.
  • Sharply higher Treasury rates could lead to heavy mutual fund outflows.  
  • Potential passage of federally-sponsored infrastructure spending that leads to higher-than-expected new issuance.

High Yield

After credit spreads fell to a post financial crisis low in early October, the high yield market re-priced significantly in Q4 2018 with spreads widening 223 basis points (bps). This resulted in returns of -2.08% for that year. To put that in perspective, 2018 marks only the 7th time in 35 calendar years of index data the high yield asset class experienced negative total returns. Broad market yields ended the year at 7.95% with credit spreads at +526 bps, both metrics exceeding their 5 year average. Valuations for the sector have become more attractive given the underlying fundamentals as 2019 default rates are expected to remain below the long-term average.

Exhibit 4: High Yield Market Credit Spreads

Source: Bloomberg Barclays US Corporate High Yield Index

Unlike the investment grade market, high yield issuers have generally deleveraged their balance sheets since 2015, as evidenced by a continued positive upgrade/downgrade ratio and the percentage of CCC rated issuers in the market, which has declined to a decade low at 13% of the index. Further, interest coverage ratios remain high, and the level of future debt maturities to be refinanced is manageable.

Exhibit 5: Default Rates

Note: 2018 data is through November 30.
Source: J.P. Morgan

Technicals for the asset class are supportive as the high yield market debt outstanding has been shrinking since 2016. New issue supply for High Yield was $187 billion or -43% year-over-year which was the lowest volume since 2009. In contrast, the loan market has been a funding alternative for high yield corporates, as issuance of $697 billion ranked as the second highest annual total on record despite a 28% drop from 2017. It bears watching that acquisition-related issuance has drifted higher to 21% of volume, but that level remains below the long-term average of 24% which is well below the highs of over 50% in 2007. Additional headwinds for the sector will likely persist if macroeconomic declines exceed expectations. Increased hedging costs have weighed on foreign demand as US monetary policy has diverged from global central banks, and further rate hikes would likely extend this trend. A recession could also impact valuations as BBB issuers are downgraded to high yield, increasing supply. However, higher yields and spreads overall improve break-evens and provide more downside protection around interest rate risks and potential credit concerns. We continue to believe credit risk is best managed with an active approach that emphasizes credit quality and diversification to reduce risk in portfolios. Long-term investors with the ability to act as liquidity providers to the market during periods of volatility are likely to be rewarded.

Convertibles

While convertibles outperformed most asset classes in 2018, the year is best viewed as two distinct periods – the first nine months of the year, and the last three months of the year.

First quarter 2018 through the third quarter saw a continuation of the longest equity bull market on record, and many convertibles moved further “up the curve” becoming ever more equity-like. However, the market capitulation in the fourth quarter highlighted the lack of downside protection afforded by equity-like convertibles. As some individual stocks dropped by a magnitude of 50% or more, equity-like convertibles linked to those shares fell virtually in lockstep with the underlying stock price.

Balanced convertible portfolios, on the other hand, offered downside protection during the fourth quarter as bond floors held up and provided support.

In the aggregate, balanced convertibles did their job in 2018, providing upside participation as equities climbed during the first three quarters, and delivering downside protection as markets fell in the fourth quarter. Over a complete market cycle – which we have not seen in nearly ten years – we expect the “ratchet” effect provided by balanced convertibles will result in equity-like returns with less volatility.

U.S. primary market activity was strong with convertible issuance of $53 billion during 2018. That made 2018 the biggest year for convertible issuance since 2008 (when issuance was $59 billion). The Technology and Healthcare sectors represented 60% of new issuance at 43% and 17%, respectively.

Convertible issuance combined with the fourth quarter equity market decline allowed us to counteract two fundamental issues associated with the convertible market today: technology sector concentration and equity sensitivity.

The sector breakdowns below highlight the Technology concentration in the broader market (using the V0A0 index as a proxy) versus a balanced convertible composite (using the Zazove Associates Blend Strategy Composite as a proxy).

Exhibit 6: V0A0 Sector Breakdown as of 12/31/18

Source: ICE BofAML Convertible Index Data

Exhibit 7: Zazove Associates Blend Composite Sector Breakdown as of 12/31/18

Source: Zazove Associates

Further, the weighted average investment premium (a measure of downside risk exposure) of the V0A0 Convertible Index is 49.4% versus 20.5% for the Zazove Blend Composite. For investors in convertibles, active management of portfolio investment premium mitigates downside risk and leads to superior risk-adjusted returns over market cycles.

To the extent interest rates continue to increase in 2019, the low duration of convertibles (~2 years or less) will insulate our portfolios from the headwinds typically associated with a rising interest rate environment.

Further, if the fourth quarter of 2018 portends renewed 2019 market volatility that would be a positive development for investors in AAM/Zazove balanced convertible strategies.  As an active manager of balanced convertible portfolios, volatility provides abundant trading opportunities and allows us to rebalance, take advantage of attractive valuations, and continue to optimize portfolios. As an aside, volatility increases the value of the embedded option of convertibles.

The opportunity set and trading environment for convertibles is as strong as it has been in years, and we are excited about the prospects for 2019.

Contributions by:
Greg Bell, CFA, CPA | Director of Municipal Bonds
Marco Bravo, CFA | Senior Portfolio Manager
Scott Edwards, CFA, CPA | Director of Structured Products
Elizabeth Henderson, CFA | Director of Corporate Credit
Reed Nuttall, CFA | Chief Investment Officer
Scott Skowronski, CFA | Senior Portfolio Manager
Stephen Bard, CFA | Chief Operating Officer, Zazove Associates
Gene Pretti | Chief Executive Officer, Zazove Associates

  • Page 1
  • Page 2
  • Go to Next Page »

Get updates in your inbox.

  • Investment Strategies
    • Investment Grade Fixed Income
    • Specialty Asset Classes
  • Our Clients
    • Client Experience
    • Sample RFP Download
  • Insights
    • Video
    • Webinar
    • News
    • Podcasts
  • About
    • Our Team
    • Contact
    • Client Login

Disclaimer: Asset Allocation & Management Company, LLC (AAM) is an investment adviser registered with the Securities and Exchange Commission, specializing in fixed-income asset management services for insurance companies. Registration does not imply a certain level of skill or training. This information was developed using publicly available information, internally developed data and outside sources believed to be reliable. While all reasonable care has been taken to ensure that the facts stated and the opinions given are accurate, complete and reasonable, liability is expressly disclaimed by AAM and any affiliates (collectively known as “AAM”), and their representative officers and employees. This report has been prepared for informational purposes only and does not purport to represent a complete analysis of any security, company or industry discussed. Any opinions and/or recommendations expressed are subject to change without notice and should be considered only as part of a diversified portfolio. A complete list of investment recommendations made during the past year is available upon request. Past performance is not an indication of future returns. This information is distributed to recipients including AAM, any of which may have acted on the basis of the information, or may have an ownership interest in securities to which the information relates. It may also be distributed to clients of AAM, as well as to other recipients with whom no such client relationship exists. Providing this information does not, in and of itself, constitute a recommendation by AAM, nor does it imply that the purchase or sale of any security is suitable for the recipient. Investing in the bond market is subject to certain risks including market, interest-rate, issuer, credit, inflation, liquidity, valuation, volatility, prepayment and extension. No part of this material may be reproduced in any form, or referred to in any other publication, without express written permission. *All figures shown are approximate and subject to change from quarter to quarter. **The accolades and awards highlighted herein are not statements of any advisory client and do not describe any experience with or endorsement of AAM as an investment adviser by any such client.

Copyright © 2024 AAM | Privacy and Disclosures

  • LinkedIn
  • YouTube