• Skip to primary navigation
  • Skip to main content
  • Skip to footer
AAM CompanyTransparent Logo

AAM Company

AAM Company Website

  • Investment Strategies
    • Investment Grade Fixed Income
    • Specialty Asset Classes
  • Clients
    • Our Clients
    • Client Experience
    • Download Sample RFP
  • Insights
    • Video
    • Webinars
    • Podcasts
    • News
  • About
    • Our Team
    • Events
  • Login
  • Contact Us
Contact

Asset Allocation Strategies

August 2, 2016 by

Within the investment grade fixed income market, there are four primary ways to enhance return: credit quality, liquidity, duration, or structure.  All of these strategies introduce additional risk to the insurer’s balance sheet. We believe that there is one more lever for a taxable P&C insurer to pull, the crossover trade between taxable and tax-exempt securities.  This trade does not involve adding incremental risk to the organization, rather it involves closely watching the spread relationship between taxable and tax-exempt securities, to exploit the opportunity as it presents itself.

Why an opportunistic strategy emphasizing average life, structure and liquidity is optimal.

Let’s begin by stating the obvious – the tax exempt municipal bond sector is illiquid and concentrated in high quality issues. From Exhibit 1 below, there are 49,372 issues in the Barclays’ Municipal Bond Index with a market value of $1.43 trillion.Muni Paper Exhibit 1

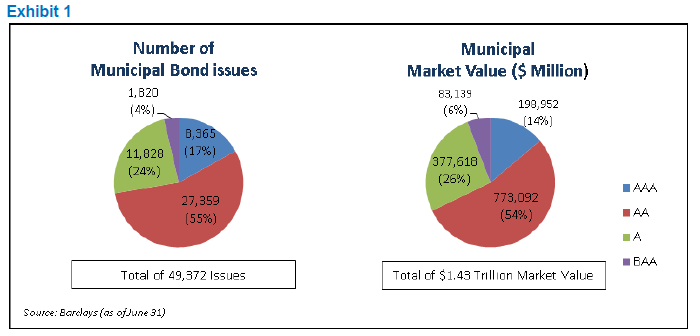
By comparison, there are 5,735 issues in the Barclays’ Corporate Index with a market value of $4.91 trillion as outlined in Exhibit 2. Thus, the Corporate Index has 11.6% of the number of issues and 3.4 times the market value of the Municipal Index.

Muni Paper Exhibit 2

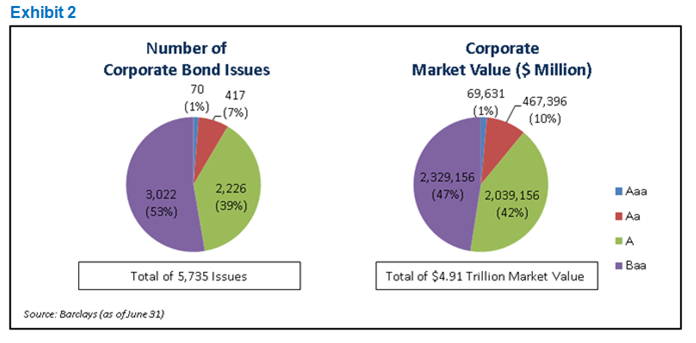
Also note that the Barclays’ Municipal Index (by market value) contains 26% and 6% of ‘A’ and ‘BAA’ rated issues, respectively.  By contrast, the Barclays’ Corporate Index contains 39% and 53% of ‘A’ and ‘BAA’ rated issues. To put the market value of the ‘A’ rated municipal bonds into perspective, it is slightly less than the market value of Exxon Mobil common stock.

To summarize, constructing diversified municipal bond portfolios with a down-in-credit, yield-oriented focus involves investing in a small corner of an illiquid municipal bond market. The constraints of the investable municipal universe preclude any ability to scale across a large asset base.

A Scalable Alternative

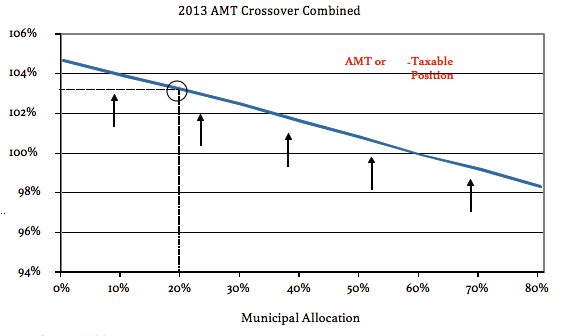
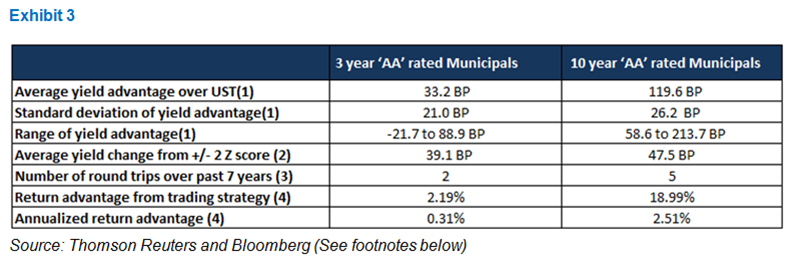
Taxable insurance companies seek to optimize after-tax yield and total return opportunities across the yield curve within the duration, quality and other constraints of their policy statement.  As outlined in Exhibit 3 below, the relative attractiveness of tax exempt municipal bond yields (relative to comparable maturity Treasury issues) varies greatly across the yield curve. Using seven year weekly averages, the yield spread advantage (pre-tax equivalent yield for insurance companies) of ten year municipal bonds is 86 basis points greater than in three year bonds. In addition, the range of yield spreads is far greater in the ten year area.

At AAM, we track spread relationships and Z scores on a daily basis. A trading strategy that involves purchasing ten year tax exempt municipal bonds when spreads (versus Treasury notes) are at a Z score of +2.0 and selling at -2.0 produced five round-trip opportunities for purchase and sale over the past seven years. Because both the average yield change and duration are much greater for the ten year municipal bond in comparison with the three year issue, the total return opportunity from the trading strategy is greater in the ten year part of the yield curve and produces a return advantage of 18.99% over the seven year period (2.51% on an annualized basis). Please see Exhibit 3 and the footnotes below for details.

Muni Paper Exhibit 3

One additional comment should be made about three year municipal bond yields. With an average spread over a three year Treasury bond of only 33 BP (based on seven years of data), there are much higher yielding opportunities in the taxable bond market. Thus, short municipal bonds should be viewed as a source of funds for yield enhancement opportunities in other taxable bond sectors.

A high quality approach leads to a stable credit profile

As of July 15, 2016 per Thomson Reuters, the average yield spread between ‘A’ and ‘AA’ rated tax exempt ten year municipal bonds is 29 basis points (114 basis points over the yield of a ten year U.S. Treasury bond). This yield differential is at the very narrow end of the range over the past 7 years and was as much as 106 basis points in July 2009.  A comparison of the 29 basis point yield advantage of ‘A’ rated issues (which will more likely be part of a buy and hold strategy due to the illiquidity of ‘A’ rated bonds) with the annualized total return from the trading strategy of 2.51% annually highlights why an opportunistic trading strategy is superior.

At AAM, we believe it is critically important to analyze relative value at each and every point along the yield curve.

An opportunistic trading strategy requires investing in liquid bonds, which generally leads to high quality credits.  Maintaining liquidity in municipal portfolios also requires a focus on coupon to avoid the negative tax consequences from a municipal bond trading at a discount price.  Lastly, liquidity and tradability are enhanced by avoiding certain call structures.

To be clear, there are select ‘A’ rated issuers that offer value.  But in our view, the opportunistic trading strategy that we have outlined is a better and more sustainable investment framework for managing taxable insurance company portfolios.

An important  consideration is that the ability to trade fixed income securities is challenged in today’s market.  This is especially  the case for tax exempt municipal bonds.  Investors looking to employ an opportunistic trading strategy must be large enough to fully participate in the primary market.  Conversely, investors must be small enough to meaningfully execute purchase and sale programs within the narrow time windows when these opportunities are available.  Due to these constraints, large municipal bond managers will likely have difficulty employing an opportunistic strategy.

We’ve discussed relative trading opportunities in tax exempt municipals, but it is important to point out that


Characteristics of An Opportunistic Trading Strategy

1. Focus on liquidity:  Liquidity allows for the portfolio to be repositioned without significant transaction costs.

2. Focus on 10 year durations: The ten year part of the yield curve provides the better total return opportunity.

3. Focus on high quality credits:  An opportunistic trading strategy requires investing in liquid bonds, generally leading to high quality credits.

insurance companies have other reasons to sell tax exempt bonds. With all credits, avoiding downgrades and impairment are critical factors for successful investing.

A high quality approach leads to a stable credit profile. This is very important in the municipal market as the availability of financial information is generally on an annual basis with a lag. In addition, the ability to fully benefit from the tax exemption of municipal income depends on underwriting profitability, which is subject to change based on each company’s underwriting experience. Maintaining a highly liquid municipal portfolio enables a company to reposition its portfolio without significant transaction costs (bid-offer spreads) when its tax situation changes.


Footnotes
The calculations are based on weekly yields from Thomson Reuters and Bloomberg over the seven year period ending July 15, 2016 using a 1.4577 tax adjustment factor on municipal yields to reflect the pre-tax equivalent yield of municipal bonds for insurance companies. This pre-tax equivalent yield on a ten year municipal bond is compared to comparable maturity Treasury yields to determine the yield spread. The standard deviation and range are also calculated from this relationship.
The Z score is calculated on a one year trailing basis using the pre-tax equivalent yield spread relationships outlined in (1) above.
The number of ‘round trips of going from -2.0 to +2.0 Z scores over this period and vice versa. This captures the number of round trip trading opportunities at extreme valuations.
The pre-tax return advantage from relative bond price movements versus comparable maturity Treasury notes over a seven year period is calculated by taking the nominal yield movements from purchases and sales when the municipal bond yield Z score is +2.0 and -2.0, respectively and calculating a price move based on the duration of three and ten year municipal bonds. The cumulative seven year number is annualized.

Written by:

GregoryABell
Gregory Bell, CFA
Director of Municipal Bonds, Principal

Joseph Borgmann
John Schaefer, CFA
President, Principal

Additional Contributor:
Daniel Nagode

Disclaimer: Asset Allocation & Management Company, LLC (AAM) is an investment adviser registered with the Securities and Exchange Commission, specializing in fixed-income asset management services for insurance companies. This information was developed using publicly available information, internally developed data and outside sources believed to be reliable. While all reasonable care has been taken to ensure that the facts stated and the opinions given are accurate, complete and reasonable, liability is expressly disclaimed by AAM and any affiliates (collectively known as “AAM”), and their representative officers and employees. This report has been prepared for informational purposes only and does not purport to represent a complete analysis of any security, company or industry discussed. Any opinions and/or recommendations expressed are subject to change without notice and should be considered only as part of a diversified portfolio. A complete list of investment recommendations made during the past year is available upon request. Past performance is not an indication of future returns.
This information is distributed to recipients including AAM, any of which may have acted on the basis of the information, or may have an ownership interest in securities to which the information relates. It may also be distributed to clients of AAM, as well as to other recipients with whom no such client relationship exists. Providing this information does not, in and of itself, constitute a recommendation by AAM, nor does it imply that the purchase or sale of any security is suitable for the recipient. Investing in the bond market is subject to certain risks including market, interest-rate, issuer, credit, inflation, liquidity, valuation, volatility, prepayment and extension. No part of this material may be reproduced in any form, or referred to in any other publication, without express written permission

October 24, 2013 by


Commercial mortgage whole loans currently provide insurance investors with an attractive yield advantage to investment grade bond alternatives.  Some of the features of the asset class for insurers include favorable risk based capital treatment, enhanced risk adjusted returns versus fixed income alternatives, and low correlation to other asset classes. The strong track record of this asset class, along with new loan terms and investment vehicles, warrants the attention of insurers of all types and sizes.

This paper will explore the value of commercial mortgage loans in an insurance company portfolio.


Privately placed first lien commercial mortgages, or commercial “whole loans,” have been a staple of U.S. insurance portfolios since the late 19th century. Insurance companies, and particularly life insurers, dominated the fixed rate whole loan market until the late 1980’s, when sloppy underwriting, bank deregulation, and excessive property valuations shook the market and resulted in insurers managing losses rather than growing whole loan portfolios. This released insurers’ stranglehold on new whole loan origination and, beginning in 1993, paved the way for investment bankers to seize market share and securitize private real estate debt in a new product – commercial mortgage backed securities (CMBS). This new entrant forced life insurance companies to learn from the self‐inflicted challenges of the late 1980’s and recalibrate their whole loan investment model to a more prudent, long‐term oriented approach.

The updated insurance whole loan lending model has focused on originating conservatively underwritten loans, secured by high quality assets and located in attractive markets. As such, delinquencies on loans originated by life insurance companies fell from a peak of 7.53% in 1992 to only 0.08% in the second quarter of 2013 (see Exhibit 1). In contrast, and as a result of CMBS lenders underwriting on unrealistic valuations, second quarter 2013 CMBS delinquency was 10.73%; falling into the same trap insurers experienced 20 years prior in the mid-1990’s.

Exhibit 1: Commercial Mortgage Delinquency Rates

Thought Leadership CML 1

Source: CMBS data Barclays Capital as of June 30, 2013.

Note: Life Insurance Companies as reported by ACLI as of June 30, 2013. CMBS delinquency represents securitized loans delinquent for 60 days or longer. ACLI represents total commercial property loan delinquency rates for life insurance company portfolios.

Over the past two decades, the reconfigured life insurance whole loan model has become a lower‐risk, profitable and easily replicated framework for many insurance investors for three reasons: 1) the spread focus and asset/liability duration matching mitigates interest rate risk; 2) whole loans offer enhanced risk‐adjusted returns versus public market alternatives, and 3) privately originated whole loans provide structural benefits versus CMBS. Insurance companies can benefit from duration matching assets to liabilities with fixed spreads. This offers insurers an opportunity for accretive income return and a profit margin for insurers for the entire life of such liabilities, thereby limiting the effect of fluctuating interest rates. This feature of conservative whole loans is especially valuable in today’s historically low interest rate environment.

Falling rates have created an increasingly difficult conundrum for fixed income investors. Although this environment has produced strong total return, investors are faced with the challenge of reinvesting capital at historically low rates. It appears likely that portfolio level cash flow generation will remain low in the intermediate term, so over‐weighting asset classes offering superior current cash flow and attractive risk‐adjusted yields is crucial.

Exhibit 2

U.S. Fixed Income Yields

(Approximately 7-7.5 year Mod. Duration)

Asset Yield (9/3013) 10-Year Total Return (Annualized) (9/30/13) 10-Year Standard Deviation (9/30/13) Credit Spread (bps) (9/30/13)

U.S. Treasury Notes

(Barclays UST, 7-10 Years Index)

2.36% 5.30% 6.58% N/A

Investment Grade Corporate Bonds

(Barclays Corporate Bond Index)

3.30% 5.27% 6.07% 142

BBB Industrial Corporate Bonds

(Barclays Corporate Bond Index)

3.90% 5.15%% 6.60% 115%
Commercial Mortgage Loans (2) 4.72% 5.21% 4.24% 236

Source: Barclays, Quadrant Real Estate Advisors.

Note: Commercial Mortgage Loans represent privately place whole loans (first mortgages). Total return and standard deviation calculations from the Giliberto-Levy index as of 6/30/2013. Commercial mortgage yields and spreads are based on market opportunities seen by Quadrant Real Estate Advisors. The yield represents the bond equivalent weighted spread across property types for 75% LTV loans.

As Exhibit 2 shows, U.S. private whole loans offer enhanced yields relative to public market alternatives. Whole loans also offer the following attributes:

  • Superior call protection relative to corporate bonds
  • Materially higher recoveries following default than both corporate bonds and CMBS
  • Significantly lower volatility as measured by the standard deviation of quarterly total returns over the past 10 years

Structurally, whole loans offer particular advantages over CMBS for buy‐and‐hold investors. Private whole loans afford lenders more control in structuring loans and in realizing a recovery in the unlikely event of default; whereas CMBS investors are subject to third party special servicers, which vary widely in competency and effectiveness as fiduciaries. This is due to conflicts of interest created by both the typical fee structures and the special servicers’ right to buy the assets they service at ‘fair market value.’ Also, CMBS pools must pay additional third‐party costs such as master servicing and trustee fees that total approximately 10 to 25 basis points more than comparable whole loan expenses. Put together, these structural benefits have produced much higher default recoveries for private whole loans than CMBS loans over time, and ultimately led to long-term loss rates that compare positively with investment grade corporate bonds (Exhibits 3 and 4).

Exhibit 3: Long-term Average Default Recoveries
Type %
Commercial Mortgage Whole Loans 80%
CBMS Conduit Loans 47%

Source: Commercial Mortgage Loans – American Council of Life Insurers 1998-2012, CMBS Conduit Loans – Bank of America Merrill Lynch 2004-2012

Exhibit 4: Long-term Average Annual Loss Rate
Type %
Commercial Mortgage Whole Loans 0.01%
Investment Grade Corporate Bonds 0.06%

Source: Commercial Mortgage Loans – ACLI 1998-2012, Investment Grade Corporate Bonds – Moody’s Global Corporate Default 1982-2012.

Property Underwriting Factors

Commercial whole loans secured by income‐producing properties, while highly defensive when conservatively underwritten at origination, are not 100% invulnerable to the commercial real estate cycle. The soaring incidence and severity of default rates in the late 1980’s to early 1990’s (insurance lenders) and, more recently, in the late 2000’s (CMBS lenders) were largely driven by lending based on unwarranted property valuations resulting in overleveraged assets once values eventually normalized. In both cases, valuations were artificially inflated by poor underwriting, unrealistic income growth projections, and excessive cash chasing ‘trophy’ assets. For this reason, realistic valuations should be a major focus of whole loan investors.

Unlike the aforementioned periods of overvaluation, income‐producing property values currently provide an appropriate basis for near‐term lending opportunities, because 1) elevated vacancies and low rents provide cash flow upside for well‐positioned properties as economic and property fundamentals improve, 2) the 2008 to 2009 credit crisis resulted in valuation normalization.

Non‐bank institutional lenders are in a position to very carefully underwrite loans and pick only the most attractive opportunities. Similarly, many of the most sophisticated borrowers have exhibited a clear preference for institutional, rather than CMBS lenders due to the greater flexibility institutional investors can offer in terms of rate, loan structure, prepayment options, and earn‐outs. Therefore, insurance company lenders have a distinct advantage in winning higher quality loan opportunities.

Considerations for Whole Loan Investing

Property fundamentals such as market, tenancy, and particular individual property characteristics support an asset’s valuation and differentiate the best whole loan investments. Institutional quality U.S. assets are most often found in in‐fill locations within top 25 markets (e.g., New York City, Washington D.C., Houston, and San Francisco) or in secondary markets (e.g., Austin, TX, and Portland, OR) with particularly attractive demographics and employment statistics. Among the most important considerations are population size, age, income, and educational attainment as well as dominant industries and drivers of job growth. Furthermore, an asset should present favorable supply constraints such as zoning issues for new construction, easements, or limited buildable land. Lastly, vacancy and rent growth trends should reflect market strengths via stable or improving metrics.

A property’s tenancy is the second major consideration in underwriting a whole loan opportunity. Investment grade tenants are always preferable, but a diverse and staggered rent roll is equally important. In the case of a single tenant or owner‐occupier, the lease term should ideally extend well beyond the loan maturity. Furthermore, either multi‐tenant or single‐tenant properties should exhibit advantages over the competitive set to support re‐leasing in the event of unplanned vacancy.

Such individual property characteristics include: location within a market, construction quality, vacancy and rent relative to market, borrower and property manager experience, and the property’s overall capital structure.

  • A building in an attractive submarket within an average secondary market might underwrite more favorably than a building located in a somewhat overbuilt or otherwise soft submarket within an attractive primary market. Strengths such as access to transportation nodes, submarket demographics, and area economic development initiatives can affect such a scenario.
  • Construction quality includes building materials, layout, and accessibility. The best buildings exhibit flexibility in terms of configuration and access.
  • Rents may be near or below market rates, and vacancy should be around the market level (or slightly below with demonstrable upside).
  • Highly experienced borrowers and property managers will be more apt to fill vacant space in a timely and cost effective manner than less‐seasoned operators.
  • Furthermore, well capitalized borrowers are often more likely to come out of pocket to cover unexpected leasing and tenant improvement expenses or interest shortfalls if reserve balances prove insufficient.
  • Since whole loans are senior in the property capital structure to the borrower’s equity, the lender’s primary concern is the borrower’s ability to service the first mortgage under a default scenario. However, given the conservative underwriting associated with whole loan origination, the probability of a senior note holder losing principal is remote.

From an overall portfolio perspective, insurance investors seeking to diversify their current holdings may also find that commercial mortgage loans have historically exhibited low correlation with other public market alternatives (Exhibit 5).

Exhibit 5: Diversification Benefits

Source: Bloomberg, Barclays, IPD/MSCI Giliberto-Levy Index, AAM. Note: Correlation of quarterly total returns 6/30/2003 – 6/30/2013.

How to Invest in U.S. Commercial Mortgage Whole Loans

Investing in commercial mortgage whole loans can be accomplished via two mechanisms:

  • Separate Single Client Account – Recommended for allocations $100 million and above
  • This vehicle is most appropriate for significant allocations to ensure appropriate portfolio diversification.
  • A single‐client account provides an investor with the most control over structuring the mandate, and controlling assets in foreclosure scenarios.
  • Statutory Investment Trust – Recommended for allocations $100 million and below
  • Statutory Investment Trusts are especially appropriate for smaller allocations to ensure proper diversification. This vehicle allows multiple investors to co‐invest in a pooled vehicle with a fully pre‐negotiated structure, while maintaining the favorable risk based capital treatment of the Separate Single-client Account

As shown in Exhibit 6, access to commercial mortgage loans has typically favored larger insurance companies with sufficient resources to build a diversified portfolio of loans. For instance, only 23% of life insurers with less than $300 million in assets owned direct commercial mortgages at the end of 2012 in comparison with 55% of companies between $300 million to $1 billion, and over 70% of those with assets over $1 billion. Accordingly, a Statutory Investment Trust vehicle is worth consideration for small and mid-sized insurers looking for diversified exposure to the asset class.

Exhibit 6: Insurance Company Commercial Mortgage Loans (CML) Holdings

Thought Leadership CML 6

Source: SNL
Note: Companies in which mortgage loans constituted >50% of total assets were eliminated as outliers.

As is indicated in Exhibit 6, life insurers have been a much larger investor in commercial whole loan mortgages given the typical fixed rate, longer duration nature of the loans. Recent trends in the ability to structure shorter-term as well as floating rate loans might be appealing to property & casualty or health insurers with shorter duration liabilities.

Typical terms of new original whole loans are currently:

  • Term: Between 3 and 15 years
  • Amortization: 20 to 30 year schedule; selectively Interest Only
  • Loan‐to‐Value: Maximum 75%
  • Debt Service Coverage: Minimum 20x on Net Cash Flow
  • Fixed Rate Spread to US Treasuries: 200+ basis points
  • Fixed Rate Coupon: 5% to 5.0%
  • Floating Rate Spreads: 200+ basis points
New Risk Based Capital Rules for Life Insurance Companies in 2013

The methodology used to determine risk based capital (RBC) for life insurance companies changed in 2013 to address the shortcomings of the previous approach. The mortgage experience adjustment factor has been eliminated in favor of establishing five risk cohorts with an assigned RBC charge for commercial mortgages in good standing. Each loan will be assigned to a risk cohort based on its debt service coverage (DSC) and loan-to-value (LTV). Exhibit 7 compares the RBC charges with those of corporate bonds and Exhibit 8 provides the DSC and LTV ranges which result in the RBC charges for commercial mortgages. The RBC factor for commercial mortgages held by property & casualty companies is simply 5%. It should also be noted that both Separate Account and Statutory Investment Trust investments in commercial mortgages are Schedule B assets subject to the same risk based capital rules.   In addition, conservative commercial mortgage whole loans will typically fall into either RBC Group 1 or 2.

Exhibit 7: RBC Charge for Life Insurance Companies
RBC Group Commercial Mortgages Corporate Bond
1 0.90% 0.40%
2 1.75% 1.30%
3 3.00% 4.60%
4 5.00% 10.0%
5 7.50% 23.0%

Source: NAIC, AAM

Exhibit 8: Commercial Mortgage RBC Charge Description
RBC Group RBC Charge Description
1 0.90% DSC=>1.50X and LTV<85%
2 1.75% 0.95 <= DSC < 1.50X / LTV<75%
3 3.00% DSC<0.95X and LTV<85%
4 5.00% DSC<1.15X and LTV=>100%
5 7.50% DSC<0.95X and LTV=>105%

Source: NAIC, AAM

An Attractive Investment Alternative Today

Commercial mortgages have been an essential component of U.S. insurance company portfolios for over 100 years. Barriers to entry, as well as loan structures have traditionally relegated ownership to large life insurance companies. New investment vehicles, loan terms, and risk based capital rules, however provide access to more subsets of the insurance industry. In the context of the current macroeconomic environment, core commercial whole loans originated with conservative underwriting parameters, offer compelling yields and competitive risk characteristics that are attractive for insurance companies today.

About Quadrant

Quadrant is a SEC Registered Investment Advisor and leader in Commercial Mortgages with $6.4 billion of commercial and multifamily real estate assets under management for institutional clients. Since 1998, Quadrant has originated over $9.6 billion of private debt investments.

Written by:

Scott Skowronski, CFA
Senior Portfolio Manager
AAM

Richard Sauerman
Head of Global Research
Quadrant Real Estate Advisors

For more information, contact:

Colin Dowdall, CFA, Director of Marketing and Business Development

colin.dowdall@aamcompany.com

John Olvany, Vice President of Business Development

john.olvany@aamcompany.com

Neelm Hameer, Vice President of Business Development

neelm.hameer@aamcompany.com

30 North LaSalle Street
Suite 3500
Chicago, IL 60602
312.263.2900

Disclaimer: Asset Allocation & Management Company, LLC (AAM) is an investment adviser registered with the Securities and Exchange Commission, specializing in fixed-income asset management services for insurance companies. This information was developed using publicly available information, internally developed data and outside sources believed to be reliable. While all reasonable care has been taken to ensure that the facts stated and the opinions given are accurate, complete and reasonable, liability is expressly disclaimed by AAM and any affiliates (collectively known as “AAM”), and their representative officers and employees. This report has been prepared for informational purposes only and does not purport to represent a complete analysis of any security, company or industry discussed. Any opinions and/or recommendations expressed are subject to change without notice and should be considered only as part of a diversified portfolio. A complete list of investment recommendations made during the past year is available upon request. Past performance is not an indication of future returns.

This information is distributed to recipients including AAM, any of which may have acted on the basis of the information, or may have an ownership interest in securities to which the information relates. It may also be distributed to clients of AAM, as well as to other recipients with whom no such client relationship exists. Providing this information does not, in and of itself, constitute a recommendation by AAM, nor does it imply that the purchase or sale of any security is suitable for the recipient. Investing in the bond market is subject to certain risks including market, interest-rate, issuer, credit, inflation, liquidity, valuation, volatility, prepayment and extension. No part of this material may be reproduced in any form, or referred to in any other publication, without express written permission.


September 19, 2013 by


With the expiring 833(b) tax deduction, the issue of taxability has entered the equation as a key consideration in the asset allocation process for many Blue Cross plans. Optimizing the allocation between taxable and tax-exempt fixed income securities can lead to maximizing after-tax returns. This paper discusses key considerations in the tax modeling process, and advocates for a dynamic approach to tax modeling, which takes into account the variability of operating results.


Tax-exempt municipal bonds can be a valuable source of incremental yield and portfolio diversification for an insurance company, especially in the context of a well-executed taxable/tax-exempt crossover strategy. This depends, however, on the company’s ability to take advantage of the income tax exemption on these bonds, without which their returns are significantly less attractive under normal market conditions. Municipal bond income is typically only tax-exempt for ordinary Federal Income Tax (FIT) purposes, so companies that pay the Alternative Minimum Tax (AMT) must treat it like any other investment income and apply the AMT tax rate (typically 20%), reducing the appeal of municipal bonds for these companies relative to sectors with higher nominal yields.

It is therefore critical to carefully analyze a company’s capacity to benefit from tax-exempt income and calculate an appropriate allocation before investing in this sector. This is especially true of Blue Cross Blue Shield (BCBS) insurance plans due to the existence of the 833(b) tax deduction, which allows eligible BCBS plans to deduct 25% of their claims and claim adjustment expenses over a calculated threshold in their FIT calculation. This deduction can be quite substantial, and almost always results in eligible companies paying the AMT (and accumulating AMT credits) in the years they use it. However, the limiting threshold of the deduction grows over time for companies with positive net income, such that after a number of profitable years these companies will eventually be “limited out” and lose their eligibility to use it. At this point, they are likely to have accumulated significant AMT credits that will enable them to pay the AMT rate of 20% rather than the 35% Federal rate for a number of subsequent years.

As a result, for purposes of investing in tax-exempt municipals, there are three broad categories a BCBS plan might find itself in:

  1. Companies currently using the 833(b) deduction, and expecting to do so for the foreseeable future: these companies are likely already paying the AMT every year, and thus are not in a position to benefit from the deductibility of municipal bond income.
  1. Companies that have recently stopped using the 833(b) deduction, or expect to stop soon, but still have a material AMT credit: these companies may be able to benefit from tax-exempts, but the benefits will accrue at a delay and will only be fully realized as the AMT credit is consumed. Briefly, the tax-exempt income will reduce the FIT calculated each year, which will reduce the amount of AMT credit consumed and prolong the time the company is able to pay the 20% marginal AMT rate rather than the higher Federal rate. AMT credits do not expire, so this strategy can be viable for companies that expect to have adequate income to consume their AMT credits over a reasonable horizon.
  1. Companies that no longer use the 833(b) deduction, and no longer have any AMT credits: these companies may be good candidates to invest in tax-exempts, and should perform dynamic tax analysis to determine an appropriate allocation to the sector.
Exhibit 1

Thought Leadership TEI 1

Source: AAM

For companies in the third category, we recommend dynamic tax analysis to determine their capacity to benefit from tax-exempt income. Holding too few tax-exempt municipals can result in lost income and sub-optimal diversification, but holding too many can tip a company into the AMT and thus reduce total after-tax income (Exhibit 1). Identifying the “sweet spot” between these scenarios is the goal of the analysis. This process incorporates underwriting, investment, and tax inputs to generate pro-forma income and tax statements for one or more forecast years and to determine an allocation to tax-exempt municipals that maximizes after-tax income while limiting the risk of paying the AMT.

Exhibit 2: Sample Combined Ratio Distribution

Thought Leadership TEI 2

Source: AAM

The first step of dynamic tax analysis is gathering inputs, and the first of these is company operating forecasts for one or more years (using just a single year can simplify the analysis, but may require more frequent follow-ups than using multiple forecast years). This makes a good starting point, but for a truly robust analysis it is necessary to expand this “base case” forecast into a range of possible scenarios for key components of combined ratio like Net Premiums Written (NPW), Claims and Claims Adjustment Expenses (CAE) incurred, and other underwriting expense (Exhibit 2). By using probability distributions to describe these inputs we can arrive at a tax-exempt allocation that takes into account the risk of the overall enterprise. Furthermore, these distributions can be asymmetric, which can be crucial to accurately representing variables like Claims that may have greater odds of coming in higher than expected than below.

Other inputs include current portfolio composition and book yield; current market yields for both taxable and tax-exempt bonds; and tax work papers showing composition of tax assets and liabilities and reconciling book and tax income. These make it possible to quantify the impact on investment income of adjusting the portfolio allocations and to estimate the necessary book-to-tax adjustments required to create pro-forma tax statements for the forecast years and identify the AMT “tipping point.”

Exhibit 3

Thought Leadership TEI 3

Source: AAM

Once all the necessary data is collected, we perform a 100,000-trial Monte Carlo simulation to test thousands of underwriting scenarios against 20 different taxable/tax-exempt allocations to identify the portfolio composition that maximizes expected after-tax income across the forecast horizon(Exhibit 3). The dynamic nature of the simulation also allows a variety of additional analyses to more fully develop a recommended tax-exempt allocation, including the probability of paying AMT at different allocations and the change in the optimal allocation if the combined ratio comes in above or below expectations.

A well structured tax-exempt municipal investment program can offer a variety of benefits to insurance companies: strong credit quality, high liquidity, stable cash flows, and attractive after-tax yields. Spreads for this sector have widened recently, making it especially appealing for new investments. Blue Cross Blue Shield plans that are not currently using the 833(b) deduction would be well advised to pursue dynamic tax analysis to identify an appropriate allocation to tax-exempts, and consider implementing a crossover municipal strategy to add diversification and after-tax yield to their portfolios.

Written by:

Peter Wirtala
Insurance Strategist

For more information, contact:

Colin Dowdall, CFADirector of Marketing and Business Development

colin.dowdall@aamcompany.com

John Olvany, Vice President of Business Development

john.olvany@aamcompany.com

Neelm Hameer, Vice President of Business Development

neelm.hameer@aamcompany.com

30 North LaSalle Street
Suite 3500
Chicago, IL 60602
312.263.2900

Disclaimer: Asset Allocation & Management Company, LLC (AAM) is an investment adviser registered with the Securities and Exchange Commission, specializing in fixed-income asset management services for insurance companies. This information was developed using publicly available information, internally developed data and outside sources believed to be reliable. While all reasonable care has been taken to ensure that the facts stated and the opinions given are accurate, complete and reasonable, liability is expressly disclaimed by AAM and any affiliates (collectively known as “AAM”), and their representative officers and employees. This report has been prepared for informational purposes only and does not purport to represent a complete analysis of any security, company or industry discussed. Any opinions and/or recommendations expressed are subject to change without notice and should be considered only as part of a diversified portfolio. A complete list of investment recommendations made during the past year is available upon request. Past performance is not an indication of future returns.

This information is distributed to recipients including AAM, any of which may have acted on the basis of the information, or may have an ownership interest in securities to which the information relates. It may also be distributed to clients of AAM, as well as to other recipients with whom no such client relationship exists. Providing this information does not, in and of itself, constitute a recommendation by AAM, nor does it imply that the purchase or sale of any security is suitable for the recipient. Investing in the bond market is subject to certain risks including market, interest-rate, issuer, credit, inflation, liquidity, valuation, volatility, prepayment and extension. No part of this material may be reproduced in any form, or referred to in any other publication, without express written permission.

March 26, 2013 by


As investors continue to search for yield in this prolonged low interest rate environment, credit spreads have compressed considerably.  Within the investment grade fixed income universe, buying the highest yielding securities in a given rating category may have negative consequences in the future. This paper examines the performance of BBB industrial bonds through the downturn. The historical performance suggests that insurance company investors should exercise caution when reaching for yield, particularly at this point in the credit cycle.


Margins within the insurance industry continue to be pressured by historically low interest rates with little end in sight. The Federal Reserve, along with other central banks around the world, has taken steps to pump liquidity into the global economy and use low rates to spur economic growth. Until recently, fixed income investors could take some solace in the fact that with heightened global volatility, credit spreads had remained modestly wide.

However, in the last few months, volatility has subsided. Both the VIX Index, a gauge of stock market volatility, and Bank of America Merrill Lynch’s MOVE Index, a measure of Treasury market volatility, have approached post-recession lows. The European Central Bank has bought some time for European nations to find a solution to their debt issues with their pledge to buy sovereign debt of fiscally challenged countries. GDP in the United States continues to grow slowly, and is expected to expand by approximately 2% in 2013. With increased calm in the market and the Fed’s policy to remain highly accommodative, even if economic data starts to improve, investors have become more comfortable adding risk. Consequently, credit spreads have compressed significantly across the investment grade universe. Exhibit 1 shows the trajectory of investment grade bond spreads over the past year.

 Exhibit 1

Thought Leadership PPRY 1

Source: Barclays Capital Aggregate Index

Credit spreads reflect the market’s perception of the riskiness of bonds. If Bond A’s spread is wider than Bond B’s spread, the market is indicating that Bond A is riskier in some way. When credit spreads compress, resulting in little differentiation in yield between weak and strong credits, credit selection becomes even more important. In tight spread environments, many times, investors are not properly compensated for adding riskier securities relative to less risky bonds. In the fixed income universe, where investors receive coupon payments and par at maturity when all goes well, if spreads continue to tighten, we would encourage insurance companies to further consider the risk and reward of new investments.

While everyone would like an extra 20 or 25 basis points (bps) of yield, buying fundamentally weaker investments to earn incremental yield usually does not benefit investors over the market cycle. Examples abound of weaker credits that traded near stronger peers prior to the market correction in 2008-2009, but ultimately performed much worse once the markets and economy deteriorated. For example, at year end 2005, Sprint 10-year bonds were only 10 bps wider than AT&T 10-year bonds[note]Assumes Life & Health RBC charges of 1.3% for NAIC 2, 4.6% for NAIC 3 and 10% for NAIC 4[/note]. Sprint has had several operational challenges and is now rated B. Meanwhile AT&T has maintained A ratings. Similarly, at year end 2005, Washington Mutual 10-year subordinate bonds were 24 bps wider than JP Morgan 10-year senior bonds[note]Assumes Property & Casualty RBC charges of 1.0% for NAIC 2, 2.0% for NAIC 3 and 4.5% for NAIC 4[/note]. The fate of Washington Mutual was widely publicized. Of course not every bond with a wider spread fundamentally deteriorated through the recession. Some bonds simply exhibited more spread volatility.

We reviewed the spread history of all 10-year BBB-rated industrial bonds beginning at December 31, 2006. The average spread for these bonds at the time was 130 bps. Eleven bonds had a spread at December 31, 2006 that was one standard deviation greater than the average spread. Exhibit 2 shows the spread changes of bonds whose spreads were the tightest at December 31, 2006 (those with a spread one standard deviation below the average), bonds with the widest spreads at December 31, 2006 (those with a spread one standard deviation above the average) and bonds with average spreads (within one standard deviation of the mean).

Exhibit 2

Thought Leadership PPRY 2

Source: Merrill Lynch U.S. Corporate Index, BBB rated; AAM

Bonds with the tightest spreads among all BBB-rated securities performed the best through the recession with much less spread volatility. While the bonds with the widest and average spreads both exhibited more volatility, bonds with the widest spreads before the recession performed worse through the recession. Exhibit 3 highlights the difference between the average and widest 10-year BBB bonds. The timeframe of Exhibits 2 and 3 begins before cracks in the market and economy became widely noticed. During this time period, there was only a modest spread difference between the bonds with spreads that were wider relative to the average. In the period since the recession began, the relationship between these groups of bonds has not yet rallied back to their pre-recession levels.

Exhibit 3

Thought Leadership PPRY 3

Source: Merrill Lynch U.S. Corporate Index, BBB rated; AAM

From a statutory accounting perspective, the spread volatility makes little difference. These bonds were all NAIC 2 as of December 31, 2006 and were therefore carried at amortized cost with very modest capital charges. If the spreads and prices fluctuate, all else being equal, there is very little statutory statement impact. However, of those 11 bonds that had the widest spreads before the recession, six are now rated below investment grade (NAIC 3 and 4), and none have been upgraded. In comparison, there were 39 securities with spreads in the average spread group. Of those 39 bonds, six have been downgraded to below investment grade while five have been upgraded to A or better. Exhibit 4 summarizes the ratings changes for each of the three bond groups.

Exhibit 4

Thought Leadership PPRY 4

Source: Bank of America Merrill Lynch, AAM

On an investment of $1 million, investors would have captured $4,300 of extra income by investing evenly in the wide spread group relative to the average group. However, by holding the $1 million investment, companies would have had increased risk based capital requirements of $23,000 for Life and Health companies[note]Bank of America Merrill Lynch index data as of 12/31/05; S 7.375% 8/1/15 vs. T 7% 7/1/15[/note] or $7,700 for Property & Casualty companies[note]Bank of America Merrill Lynch index data as of 12/31/05; WM 5.125% 1/15/15 vs. JPM 4.75% 3/1/1[/note].

While the example provided here is specific to BBB 10-year Industrial bonds, the same experience can be observed across sectors and ratings categories. There continue to be opportunities to add risk-adjusted yield in portfolios, and we do not believe that significant selling of risk is necessary in our clients’ portfolios. However, we would advise investors to be careful “reaching for yield.” While a particular security may offer a few extra basis points of yield, even in the same rating category, investors should be cognizant of the extra risk being taken for the incremental yield and ask themselves whether the potential risk is worth the reward.

Written by:

Daniel C. Byrnes, CFA
Principal and Senior Portfolio Manager

For more information about AAM or any of the information in the AAM Newsletter, please contact:

Colin Dowdall, CFA, Director of Marketing and Business Development

colin.dowdall@aamcompany.com

30 North LaSalle Street
Suite 3500
Chicago, IL 60602
312.263.2900

Disclaimer: Asset Allocation & Management Company, LLC (AAM) is an investment adviser registered with the Securities and Exchange Commission, specializing in fixed-income asset management services for insurance companies. This information was developed using publicly available information, internally developed data and outside sources believed to be reliable. While all reasonable care has been taken to ensure that the facts stated and the opinions given are accurate, complete and reasonable, liability is expressly disclaimed by AAM and any affiliates (collectively known as “AAM”), and their representative officers and employees. This report has been prepared for informational purposes only and does not purport to represent a complete analysis of any security, company or industry discussed. Any opinions and/or recommendations expressed are subject to change without notice and should be considered only as part of a diversified portfolio. A complete list of investment recommendations made during the past year is available upon request. Past performance is not an indication of future returns.

This information is distributed to recipients including AAM, any of which may have acted on the basis of the information, or may have an ownership interest in securities to which the information relates. It may also be distributed to clients of AAM, as well as to other recipients with whom no such client relationship exists. Providing this information does not, in and of itself, constitute a recommendation by AAM, nor does it imply that the purchase or sale of any security is suitable for the recipient. Investing in the bond market is subject to certain risks including market, interest-rate, issuer, credit, inflation, liquidity, valuation, volatility, prepayment and extension. No part of this material may be reproduced in any form, or referred to in any other publication, without express written permission.


  • « Go to Previous Page
  • Page 1
  • Page 2

Get updates in your inbox.

  • Investment Strategies
    • Investment Grade Fixed Income
    • Specialty Asset Classes
  • Our Clients
    • Client Experience
    • Sample RFP Download
  • Insights
    • Video
    • Webinar
    • News
    • Podcasts
  • About
    • Our Team
    • Contact
    • Client Login

Disclaimer: Asset Allocation & Management Company, LLC (AAM) is an investment adviser registered with the Securities and Exchange Commission, specializing in fixed-income asset management services for insurance companies. Registration does not imply a certain level of skill or training. This information was developed using publicly available information, internally developed data and outside sources believed to be reliable. While all reasonable care has been taken to ensure that the facts stated and the opinions given are accurate, complete and reasonable, liability is expressly disclaimed by AAM and any affiliates (collectively known as “AAM”), and their representative officers and employees. This report has been prepared for informational purposes only and does not purport to represent a complete analysis of any security, company or industry discussed. Any opinions and/or recommendations expressed are subject to change without notice and should be considered only as part of a diversified portfolio. A complete list of investment recommendations made during the past year is available upon request. Past performance is not an indication of future returns. This information is distributed to recipients including AAM, any of which may have acted on the basis of the information, or may have an ownership interest in securities to which the information relates. It may also be distributed to clients of AAM, as well as to other recipients with whom no such client relationship exists. Providing this information does not, in and of itself, constitute a recommendation by AAM, nor does it imply that the purchase or sale of any security is suitable for the recipient. Investing in the bond market is subject to certain risks including market, interest-rate, issuer, credit, inflation, liquidity, valuation, volatility, prepayment and extension. No part of this material may be reproduced in any form, or referred to in any other publication, without express written permission. *All figures shown are approximate and subject to change from quarter to quarter. **The accolades and awards highlighted herein are not statements of any advisory client and do not describe any experience with or endorsement of AAM as an investment adviser by any such client.

Copyright © 2024 AAM | Privacy and Disclosures

  • LinkedIn
  • YouTube