• Skip to primary navigation
  • Skip to main content
  • Skip to footer
AAM CompanyTransparent Logo

AAM Company

AAM Company Website

  • Investment Strategies
    • Investment Grade Fixed Income
    • Specialty Asset Classes
  • Clients
    • Our Clients
    • Client Experience
    • Download Sample RFP
  • Insights
    • Video
    • Webinars
    • Podcasts
    • News
  • About
    • Our Team
    • Events
  • Login
  • Contact Us
Contact

Corporate Credit

November 19, 2015 by


Hoverboards and Michael Jordan shoes. I can’t get through a conversation with my kids without one or both of these topics coming up. I have to admit, being a huge Back to the Future fan and growing up in Chicago during the Bull’s domination of the 90’s, I am excited about this holiday season. This is always a very important time of year for the retailers, as up to 40% of annual revenues are realized during this season. Based on our figures from the U.S. Census Bureau (retail, excluding auto and gas), retail sales for 2014 were up 4.4%. We believe that retail sales for this year will be up between 3.25% and 3.75%. The following report explores some of the more important drivers of our analysis.


The Consumer is Strong

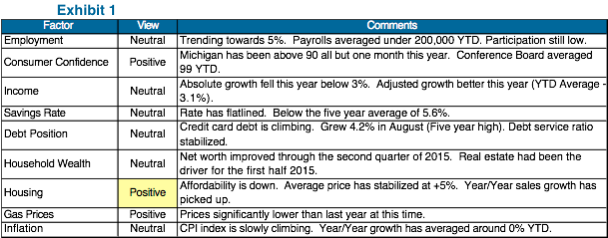
We believe the most important driver of retail sales is the strength of the consumer. The following table summarizes our analysis of nine different factors which drive the willingness to spend. We make an assessment of the individual factors in terms of how we think they may impact future spending.
Source: AAM Note: Highlight notes a change from 2014.
Source: AAM
Note: Highlight notes a change from 2014.

The overall picture is about the same as last year.  Positive developments include falling gas prices and stronger consumer confidence data.  Home prices and sales look steady and we continue to see more spending on home improvement.  Homeowners spend more aggressively when their homes transition to an investment from a cost.  Stagnant income growth coupled with rising personal debt could impact spending. Currently, credit card performance has been solid, so we would not expect rising credit card balances to slow spending.  In addition, GDP in the U.S. remains volatile throughout the year with expectations to flat line through 2017, signifying a pretty benign economic environment.

Big Ticket Item Spend Could Slow Holiday Shopping

Once again, a significant amount of consumer spending this year has been on big ticket items, including new cars and home appliances.  The fear is that spending on these sorts of items could impact holiday season shopping for various discretionary items.  Auto sales continue to consistently come in higher than expected with the last two months above a SAAR (Seasonally Adjusted Annual Rate) of 18 million, which hasn’t happened in more than 10 years.  Most analysts point to easy access of funding and attractive incentives to explain this sort of growth.  In addition, there are also secular trends driving demand including the increasing age of used cars and number of cars owned per household.  Years of pent up demand from curtailed spending, high average appliance age (approximately 10 years), an improved housing picture, and a better job environment are giving consumers greater confidence to spend on their homes.  We continue to see strong buying in the large appliance sector.

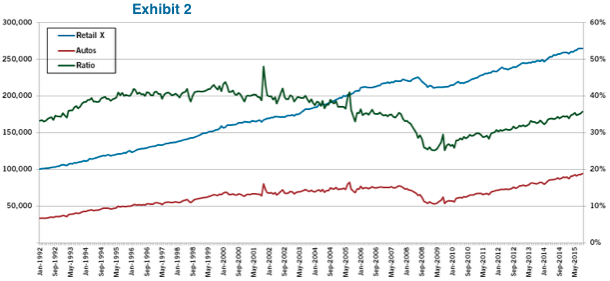
We took a closer look at the history of auto sales and potential impact on consumer spending.  To do this, we used information from the monthly retail trade data completed by the U.S. Census Bureau.  We segmented the Motor Vehicle & Parts Dealers portion of spending and compared it to retail spending (Exhibit 2).  What we observe is that retail spending (not including autos) is growing faster than auto spending.  The green line is the ratio of auto versus retail spending. That ratio has been growing and is currently at 36%, well below the maximum of 48%.  Based on this information, it appears there is still opportunity for auto sales to grow without impacting retail spending.
Source: U.S. Census Bureau, data as of 11/02/2015

Big ticket items include technology as well.  This year, there are a number of new/innovative electronic devices available for the holiday.  These include the iPhone 6s, 4K Ultra TV’s, drones, fitness trackers, 3D printers, and connected home technology.  The Consumer Electronics Association expects tech spending this holiday to be up 2.3% to $34.2 billion.

Statistical Analysis – Predicting a Slow Down

Looking back on data over the last twenty two years reveals a significant correlation (81%) between “Back to School” retail sales (August and September) and “Holiday” sales (November and December). To complete this analysis, we used the U.S. Census Bureau’s monthly retail trade data, which includes a variety of retail businesses.  We exclude Motor Vehicle & Parts Dealers and Gasoline Stations from our analysis because sales in those segments have been more heavily impacted by factors outside the control of consumers.  In 2014, “Back to School” sales of 4.0% led to “Holiday” sales of 4.4%.  Our model predicts “Holiday” sales of 3.2% when using 3.0% for the “Back to School” sales observed in 2015. Holiday sales of 3.2% would be below the 23 year average of 4.2%.

Seasonal Hiring Looks Similar to Last Year

The National Retail Federation predicts that between 700,000 and 750,000 seasonal workers will be hired this year[note]Retail Employment and Seasonal Hiring. ”National Retail Federation, derived from Bureau of Labor data.https://nrf.com/resources/holiday-headquarters/retail-employment-and-seasonal-hiring, accessed November 17, 2015.[/note]. This compares to 714,000 hired last year and 765,000 hired in 2013.  Companies, including Macy’s, Kohl’s, and Walmart seem to be adding holiday staff in a somewhat conservative manner.  We continue to see hiring shifts to distribution warehouses which support online shopping.  E-commerce giant, Amazon is hiring 100,000 seasonal employees which is up significantly from 80,000 last year.  In addition, shipping giants FedEx and UPS are predicting a similar holiday season to 2014.  UPS expects to ship 10% more packages between Thanksgiving and New Year’s (3Q Earnings Transcript).  UPS expects their peak day to be December 22, when they expect to ship about 36 million packages, twice the normal amount in a day (3Q Earnings Transcript).

Higher Inventory Should Lead to Better Discounts

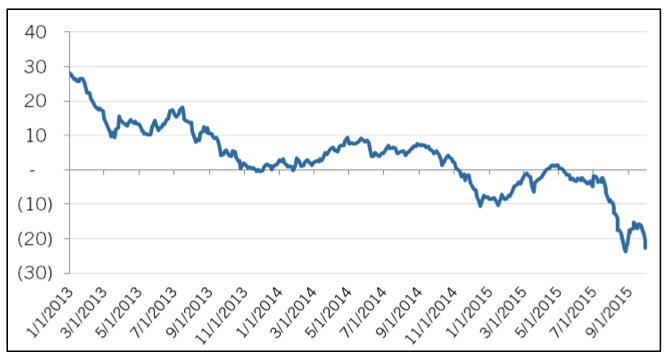
Technology working closely with demographic and social change has altered the way traditional retailers are selling/marketing their products.  One of the outcomes has been a much more efficient and better informed shopper.  Shoppers will continue to deal hunt, forcing retailers to sharpen their prices and start promoting earlier.  This year, we believe that retailers are in a less favorable inventory position versus last year.  We took a look at the inventory-to-sales spread (inventory – sales growth (year/year)) for a variety of retailers since 2013.  In a perfect world, we would want to see this at zero as inventory build keeps the same pace as sales.

A positive figure might result in price discounting by retailers, as they are stuck with too much inventory.  As shown in Exhibit 3, the average inventory-to-sales spread seems to have picked up somewhat since the second quarter of 2015.   While it is too early to determine the pace in the third quarter, so far, it looks as if inventories are up substantially, as sales have been disappointing.  Lower tourism and luxury spending seem to be a building theme in the locations that are geared toward higher income spenders.  The problem can be partly blamed on weaker emerging stock markets and a stronger U.S. dollar versus other currencies.

Source: Bloomberg
Source: Bloomberg

As a result, we expect retailers will need to be aggressive with discounts this season.  We expect retail margins to be somewhat stable as costs, especially commodities, have generally decreased.

Online Shopping Blazes Ahead – Department Stores Have a Big Opportunity

A solid e-commerce strategy has become a “must have” for all major retailers.  Even with the incredible advancements in this area, most shoppers still want to visit an actual store.  Retailers must continue to update their stores to remain relevant amongst a huge host of competition.  Omni-channel retailing has merged the inventory and distribution of physical stores with the online business.  In short, it has simplified and enhanced the entire buying process. According to the U.S. Census Bureau, e-commerce now accounts for 7.2% of total retail sales.  Year over year growth since 2010 has averaged 15% on a quarterly basis.  According to the National Retail Federation, the average shopper said that 46% of their shopping will be completed online[note]Retail Employment and Seasonal Hiring.”National Retail Federation, derived from Bureau of Labor data.https://nrf.com/resources/holiday-headquarters/retail-employment-and-seasonal-hiring, accessed November 17, 2015.[/note].  In addition, mobile devices are now much easier to use and play a bigger role in shopping for consumers.  One important outcome of e-commerce has been quicker delivery.  The much talked about Millennials are helping shape the evolution of retail.  It’s interesting to note that about 16% of this group expects to use the “same day delivery” option this holiday compared to just fewer than 8% for the rest of the population.

One area of particular interest is in the department store segment of retail.  This has been especially newsworthy given the very high profile e-commerce push at Walmart.  E-commerce is a big opportunity for large department store retailers given lower online penetration and slower same-store-sales growth at brick and mortar stores.  Exhibit 4 gives a good sense of the upside when compared to other retail segments.   One example of the growth opportunity is in the consumer electronics segment which doubled its online penetration to almost 24% in only four years[note]Steven Grambling, CFA, Alison Levens, Chistopher Prykull, CFA,. “Bricks and Click reboot: Adoption accelerates, margin trajectory grows murkier,” Goldman Sachs Equity Research – Americas: Retail: Broadlines, October 22, 2015 (6).[/note].

In general, we would expect margins to compress as a larger percentage of the business is moved online.  Also, capex spending would shift more towards e-commerce spending and less to net new builds.
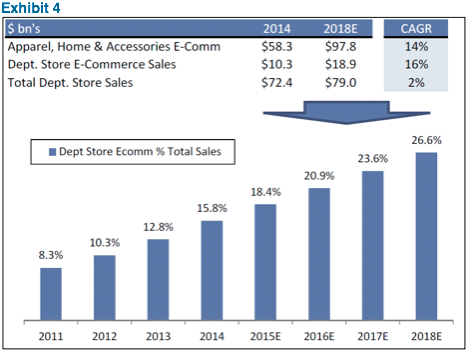
Source: BEA, Comscore, eMarketer, Company Data, Goldman Sachs Global Investment Research

Trade Group Surveys Expect Lower Growth in 2015

We have included a summary of the four trade groups which publish their views on upcoming holiday sales (Exhibit 5). While each of them uses a different data set to base their expectations, the more important aspect is the change in growth year–over-year. In addition, we thought it would be interesting to look at how accurate each group has been over the past three years. The International Council of Shopping Centers (ICSC) seems to be the most accurate.

Source: Morgan Stanley, AAM

Weather and Calendar Remain Relevant

Weather and the changing calendar are always important factors for holiday spending.  Last year, November was colder and December was warmer than normal.  We saw a lot of snow in November and a very limited amount in December.  According to Weather Trends International (WTI), this holiday season is expected to be milder with temperatures warmer and precipitation lower than normal[note]Denise Chai, CFA, Lorraine Hutchinson, CFA, Robert F. Ohmes, CFA, “Holiday ’15: Santa’s sleigh faces uphill ride,” Bank of America Merrill Lynch, Equity. Oct. 21 2015, 7.[/note].  Of course, better weather makes travel easier for consumers.  Having said that, consumers are less likely to buy winter focused products when the weather is unseasonably warm.  A more severe winter might actually be a good thing especially given the growing popularity of online shopping.

The days between Thanksgiving and Christmas are key shopping days.  This year, those days total 28 (26 is the minimum, 32 is the maximum) versus 27 last year.  In addition, there are eight total weekend days to shop, the same as last year.  One more day will probably not make a significant difference.  We would not expect this to be a factor in our estimate for 2015 sales.

Conclusion  

We believe 2015 will be a decent year for holiday spending coming in slightly below last year’s growth.  Overall, the typical consumer is in a better economic position than recent years.  We believe mediocre job growth and inflation adjusted wages will limit the upside to spending.  We would expect retailers to be challenged somewhat with higher inventory positions this year, especially if tourism related spending does not return to normal levels.  In addition, we believe consumers will continue to purchase big ticket items, which may negatively affect other areas of consumer spending.  Seasonal hiring outlooks and subdued predictions from various trade group organizations support our prediction of a slower holiday season in 2015.  The calendar will look very similar to last year while the weather is expected to be harsh but not quite as bad as last year.

Michael Ashley
Principal and Senior Analyst, Corporate Credit


Disclaimer: Asset Allocation & Management Company, LLC (AAM) is an investment adviser registered with the Securities and Exchange Commission, specializing in fixed-income asset management services for insurance companies. This information was developed using publicly available information, internally developed data and outside sources believed to be reliable. While all reasonable care has been taken to ensure that the facts stated and the opinions given are accurate, complete and reasonable, liability is expressly disclaimed by AAM and any affiliates (collectively known as “AAM”), and their representative officers and employees. This report has been prepared for informational purposes only and does not purport to represent a complete analysis of any security, company or industry discussed. Any opinions and/or recommendations expressed are subject to change without notice and should be considered only as part of a diversified portfolio. A complete list of investment recommendations made during the past year is available upon request. Past performance is not an indication of future returns.

This information is distributed to recipients including AAM, any of which may have acted on the basis of the information, or may have an ownership interest in securities to which the information relates. It may also be distributed to clients of AAM, as well as to other recipients with whom no such client relationship exists. Providing this information does not, in and of itself, constitute a recommendation by AAM, nor does it imply that the purchase or sale of any security is suitable for the recipient. Investing in the bond market is subject to certain risks including market, interest-rate, issuer, credit, inflation, liquidity, valuation, volatility, prepayment and extension. No part of this material may be reproduced in any form, or referred to in any other publication, without express written permission.

 

October 12, 2015 by

The End of the Credit Cycle?

By Elizabeth Henderson, CFA
Director of Corporate Credit

Elizabeth Henderson

[toc]

Volatility remained high in all markets with investment grade credit spreads widening 23 basis points (bps) versus Treasuries in the third quarter. The main driver of this widening was falling commodity prices in response to continued weak data from China and global growth concerns.

Repricing Risk

The Federal Reserve’s decision and communication led to investor consternation in the latter half of September. The prospect of higher rates concurrent with the increased risk of slower global growth resulted in a repricing of risk.

This was most evident in the high yield market with spreads widening 153 bps in the third quarter. Investors pushed back in the new issue market, demanding much higher yields (e.g., Frontier Communications, Altice, Olin). In investment grade, we witnessed issuers pulling deals from the market after poor investor response as well, a dynamic we have not experienced in some time. The CLO (Collateralized Loan Obligation) market has also suffered with credit quality erosion and market volatility impacting pricing and originations. Appreciating the importance of credit availability and creation to the health of the credit market and economy, we are concerned with these events.

We cited the increased risk of fallen angels in last month’s Corporate Credit View (“Fallen Angels Expected to Increase”). The market recognized this risk in the third quarter, repricing many BBB rated credits, with $211 billion of debt across 56 investment grade issuers trading like high yield credits[note]Stephen Antczak, CFA, “Fallen Angels: How many, how to cope,” Citi Research, October 2, 2015[/note].

Market Vulnerabilities

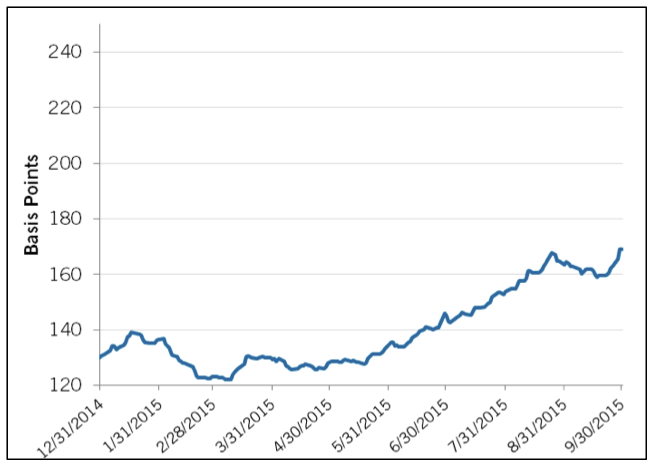
 The first signs of credit contraction cause us to increase the top end of our range for spreads. We had entered 2015 with an expected range of 120-175 bps (Exhibit 1). Considering the change in quality and duration of the Barclays Corporate Index since prior points in the cycle, as well as corporate fundamentals today, we have modeled downside risk to be 225 bps.

However, risk is skewed to the downside due to the difference in liquidity conditions (“The Perfect Storm? Fixed Income Portfolio Management in a Reduced Liquidity Environment”). In the Royal Bank of Scotland’s (RBS) September Survey 79% of investors believed that we are moving to a structural phase of high asset price volatility. As the survey results show, this was the second biggest fear among investors (first being China). RBS states that “declining liquidity and an increase in herding may exacerbate volatility during times of stress, with the IMF (International Monetary Fund) highlighting an increase in correlation among major asset classes and between fund positions, since the crisis.”[note]Alberto Gallo, “The Silver Bullet|Credit nearing breaking point: Stay Short,” Royal Bank of Scotland, September 30,   2015.[/note] Regardless of fundamentals, we believe the market needs to reprice for this level of volatility, hampering a return to 120 bps.

Exhibit 1: U.S. Corporate Investment Grade OAS

AAM Corp Credit Fall-2015 1

Source: Barclays, AAM as of 9/30/2015

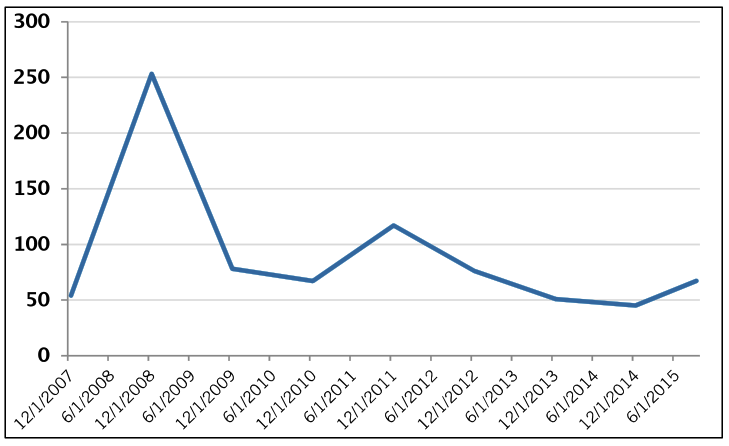
We believe BBB rated credits away from the Energy and Basic Material industries are particularly vulnerable, if the credit cycle has ended and spreads widen. The spread differential (i.e., basis) of A and BBB rated Industrial credits has increased due to commodity related sectors, as the risk premium for other BBBs (excluding Energy and Basics) has not widened (Exhibit 2).

Exhibit 2: BBB-A Industrial Rating Basis, excluding Energy and Basics

AAM Corp Credit Fall-2015 2

Source: Barclays, AAM as of 9/30/2015

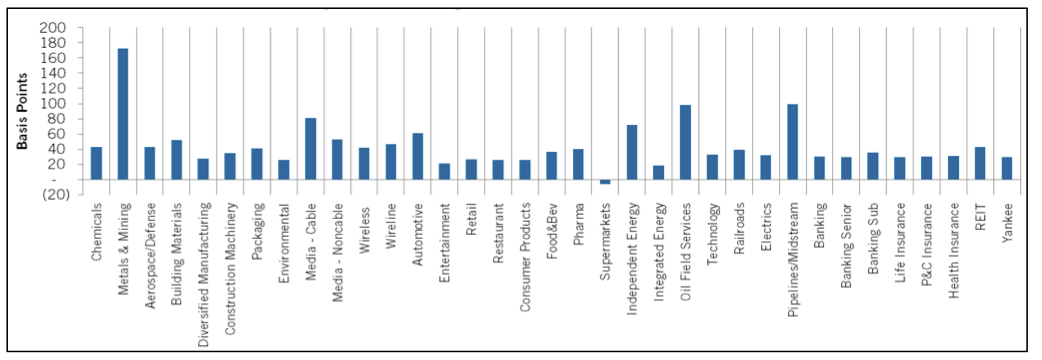
Additionally, cyclical sectors away from commodities have performed in line with more defensive sectors. We believe the risk premium for economically sensitive sectors could also widen with sectors within Consumer Cyclicals particularly vulnerable.

Exhibit 3: Spread Changes for Sub Sectors YTD

AAM Corp Credit Fall-2015 3

Source: Barclays, AAM as of 9/30/2015

We would expect widening in Financials as well.   They have outperformed year-to-date, but would be impacted in a credit correction, as increased credit defaults would be a drag on earnings and capital levels. We are watching bank lending standards and credit loan growth closely for additional signs of credit contraction. We note the third quarter loan growth was less than half the rate realized in the second quarter due to a slow down in commercial and industrial (C&I) lending.

Exhibit 4: Finance – Industrials Spread Difference

AAM Corp Credit Fall-2015 4

Source: Barclays, AAM as of 9/30/2015

The banks continue to operate in an opaque regulatory environment. A draft form for TLAC (Total Loss Absorbing Capital) is expected to be released by the Global Financial Stability Board before the G20 finance meeting in November.  However, the Fed and OCC (Office of the Comptroller of the Currency) are expected to tweak it for the U.S. system, which is expected to take longer.  Therefore, debt issuance requirements (needed to increase capital levels) may become clear later this year with a four to six year implementation period.  We believe the long implementation timeframe is manageable, thus we do not believe this will be a systemic issue or stress on the system.

Summary

We are in the late stage of the credit cycle, and signs are emerging that we may have reached the end. If that proves true, we would expect spreads to widen and rating actions to become more punitive. Companies have increased leverage at a time of slowing earnings growth to increase shareholder returns.  Regardless of whether we are at the end of the cycle, we expect this credit deterioration to continue to be a headwind for spreads and an impetus for rating downgrades.  In the past, economic cycles have lagged credit cycles by approximately 12 to 24 months. Therefore, we would not expect management behavior to become creditor friendly until the risk of a recession increases. Although spreads have widened, this is a time to remain defensive and selective.  As growth forecasts are revised lower and credit appears to be contracting, we are growing increasingly more cautious.

For more information about AAM or any of the information in the Corporate Credit View, please contact:

Colin Dowdall, CFA, Director of Marketing and Business Development

colin.dowdall@aamcompany.com

John Olvany, Vice President of Business Development

john.olvany@aamcompany.com

Neelm Hameer, Vice President of Business Development

neelm.hameer@aamcompany.com

Disclaimer: Asset Allocation & Management Company, LLC (AAM) is an investment adviser registered with the Securities and Exchange Commission, specializing in fixed-income asset management services for insurance companies. This information was developed using publicly available information, internally developed data and outside sources believed to be reliable. While all reasonable care has been taken to ensure that the facts stated and the opinions given are accurate, complete and reasonable, liability is expressly disclaimed by AAM and any affiliates (collectively known as “AAM”), and their representative officers and employees. This report has been prepared for informational purposes only and does not purport to represent a complete analysis of any security, company or industry discussed. Any opinions and/or recommendations expressed are subject to change without notice and should be considered only as part of a diversified portfolio. A complete list of investment recommendations made during the past year is available upon request. Past performance is not an indication of future returns.

This information is distributed to recipients including AAM, any of which may have acted on the basis of the information, or may have an ownership interest in securities to which the information relates. It may also be distributed to clients of AAM, as well as to other recipients with whom no such client relationship exists. Providing this information does not, in and of itself, constitute a recommendation by AAM, nor does it imply that the purchase or sale of any security is suitable for the recipient. Investing in the bond market is subject to certain risks including market, interest-rate, issuer, credit, inflation, liquidity, valuation, volatility, prepayment and extension. No part of this material may be reproduced in any form, or referred to in any other publication, without express written permission.


September 28, 2015 by

  • Liquidity in the bond market is substantially reduced.
  • This liquidity reduction is structural, driven by regulation and a reduced field of intermediaries.
  • At the same time, institutional fixed income management has consolidated in order to capture benefits of scale, but their ability to transact is reduced.
  • In this environment, there is benefit to being a nimble manager.

Dimensioning the Bond Market and Liquidity

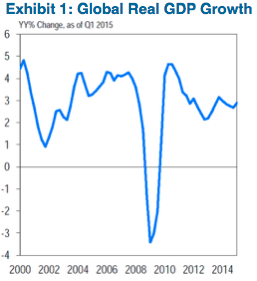
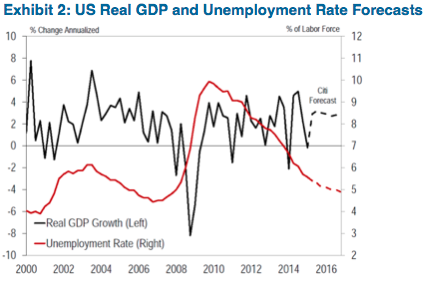
Since the extreme disruption of the global financial crisis in 2008 the world and the U.S. have experienced a deep economic recession followed by a much slower than expected resumption of GDP growth (Exhibits 1 and 2).

Source: National Sources and Citi Research (July 2015)


Source: BEA, BLS, and Citi Research Forecasts (July 2015)

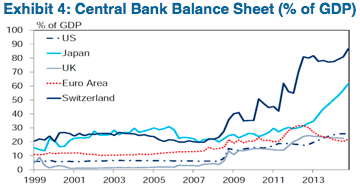
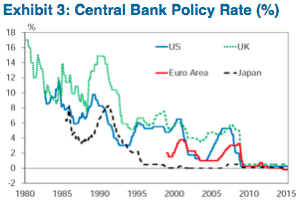
The response of central banks and policy makers to the economic downturn and the subsequent slow recovery have been broad and aggressive, including both conventional policy such as interest rate cuts and non-conventional approaches including aggressive quantitative easing in the large developed markets (Exhibits 3 and 4).

Source: National Central Banks and Citi Research (July 2015)


Source: National Central Banks, Haver Analytics and Citi Research (July 2015)

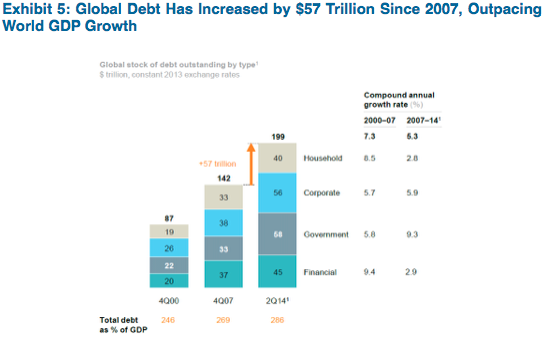
The sustained low rate environment, as well as the introduction of quantitative easing via open market purchase programs, has resulted in an acceleration of the growth of global leverage even as the mix has shifted (Exhibit 5).

Source: Haver Analytics; national sources; World economic outlook; IMF; McKinsey Global Institute analytics (February 2015)

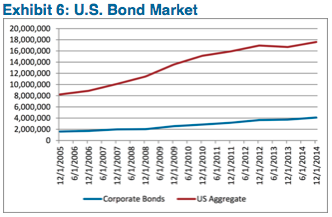
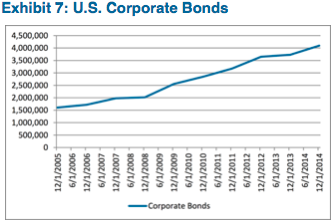
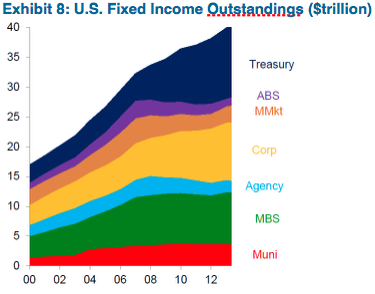
U.S. dollar denominated fixed income markets have participated in this expansion of leverage with the overall market experiencing 18% growth since 2008.  While the most rapid rate of growth has been in government linked indebtedness (116%), it has been followed by corporate indebtedness (45%) as shown in Exhibits 6, 7, and 8.

Source: Federal Reserve


Source: Federal Reserve


Source: SIFMA and Citi Research (August 2015)

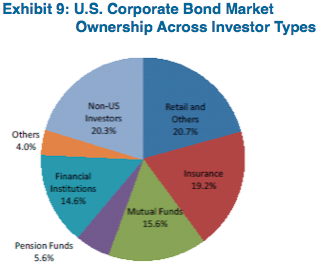
And in particular, growth of the corporate bond market has been propelled both by a move away from bank loans and an influx of retail money in the form of mutual funds and Exchange Traded Funds (ETFs) as well as non-U.S. investors (Exhibit 9).

Source: Fed Flow of Funds (as of December 2013)

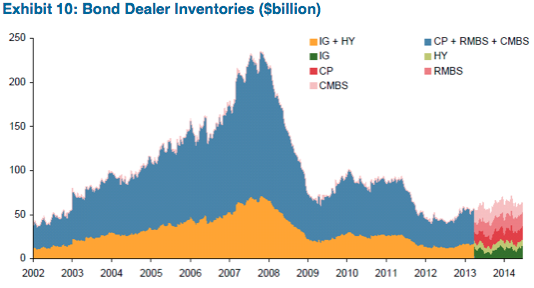
At the same time that the corporate bond market has experienced record growth, liquidity within the asset class has been dramatically reduced.  The most obvious sign of illiquidity is the materially reduced inventories held by the global banks that act as the main intermediaries in the market (Exhibit 10).

Source: RBS Credit Strategy (July 2014), Federal Reserve Bank of New York, SIFMA, MarketAxess

Note: Because corporate bond dealer inventories are not broken down prior to 2013, we have assumed IG and HY inventories are in the same proportion as the average from 2013 – present.

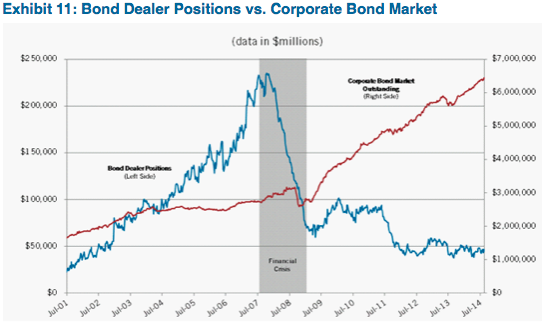
While reduced dealer inventories in all classes of fixed income are evident, the fall in inventories relative to the growth in the size of the corporate bond markets is particularly striking (Exhibit 11).

Source: Primary Dealer Positons - Federal Reserve Bank of New York Primary Dealer Statistics, Positions greater than 1 year. Data includes Asset-Backed and Municipal Securities. Corporate Bond Market Outstanding = Bank of America Merrill Lynch US Corporate Bond Index and US Cash Pay High Yield Index
Source: Primary Dealer Positons – Federal Reserve Bank of New York Primary Dealer Statistics, Positions greater than 1 year. Data includes Asset-Backed and Municipal Securities.
Corporate Bond Market Outstanding = Bank of America Merrill Lynch US Corporate Bond Index and US Cash Pay High Yield Index

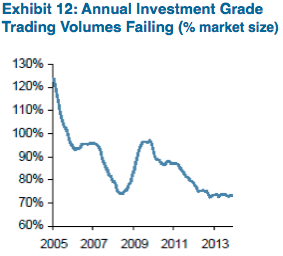
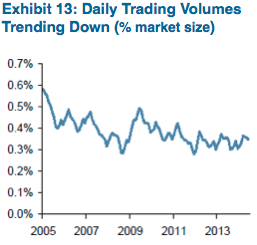
Further evidence of reduced liquidity can be seen in the static daily turnover and average trade size in the corporate bond market (despite the 45% growth in the outstanding).

Source: RBS Credit Strategy (July 2014), SIFMA, MarketAxess


Source: RBS Credit Strategy (July 2014), SIFMA

Why Has Liquidity Been Reduced?

The cause of the reduced liquidity is twofold.  Firstly, the advent of new banking regulations in response to the global financial crisis has increased the capital intensity of bank owned capital markets businesses, incentivizing balance sheet reductions by this group of intermediaries.  Secondly, the global financial crisis has reduced the traditional pool of intermediaries (the “sell side”), either through outright failure, or through a retreat from the capital markets business.

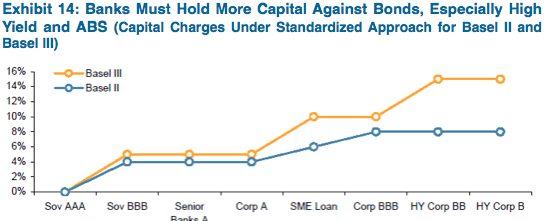
The main regulatory developments impacting bond market liquidity have been the advent of the Basel III capital guidelines and the Dodd-Frank Act.  The Basel III guidelines are a recommended framework for bank capitalization which were finalized in 2011 in response to shortcomings of the previous capital guidelines that were exposed by the global financial crisis (most notably undercapitalizing against the risks inherent in capital markets businesses and securities inventories).  The Dodd-Frank Act signed into law in 2010 represents the U.S. Congress’ attempt to remedy the shortcomings in regulatory oversight of the U.S. financial sector that came to light during the financial crisis (and which set the stage for the U.S. adoption of the Basel III guidelines).  The key aspects of the Dodd-Frank Act that have impacted liquidity of the U.S. bond market include:

  1. Implementation of Basel III capital rules – while the new capital guidelines materially increased the minimum levels of capital, they also raised the risk weighting assigned to securities portfolios and counterparty exposures resulting from OTC derivative trades.  The increased capital requirements and risk weightings have made the fixed income business considerably more capital intensive (Exhibit 14).

    Source: RBS Credit Strategy (July 2014), RBS ABS Strategy, BIS
    Source: RBS Credit Strategy (July 2014), RBS ABS Strategy, BIS
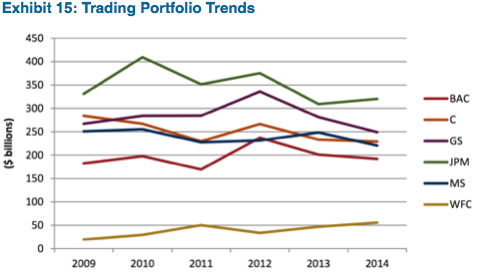
  2. Imposition of a leverage ratio – in addition to increased risk weighting of securities on the balance sheet, Basel III has imposed a leverage ratio that measures capital against gross assets.  This measure of capitalization is meant to protect against any gaming of risk weightings, and particularly penalizes inflated balance sheets (even those consisting of low risk weighted assets such as secured repo and highly liquid Treasury and agency debenture portfolios).  The impact of the leverage ratio can be directly observed in the reduction of money center trading portfolios (Exhibit 15).

    Source: SNL Financial
    Source: SNL Financial
  3. Volker Rule – the Volker Rule was a late addition to the Dodd-Frank Act and was meant to cap “risky” activities previously undertaken by banks.  Most relevant to the discussion on corporate bond liquidity is the prohibition on “proprietary” trading, defined as trading that is not reasonably associated with customer-based activity.  While the implementation of this part of the Volker Rule has been somewhat watered down, it remains subject to regulatory discretion and it has been cited as a driver of reduced trading inventories and staff by bank management.

While increased regulations have reduced the depth of bond market liquidity, the global financial crisis also caused a reduction in the breadth of market liquidity as intermediaries either failed or retreated from the market.  The failure of Bear Stearns and Lehman Brothers, as well as the sale of Merrill Lynch to Bank of America represented the most obvious removal or consolidation of market makers.  Numerous European banks have also been forced by their domestic regulators to pare back their capital markets businesses.  Institutions such as UBS AG, Credit Suisse, Royal Bank of Scotland and Barclays Capital, which had previously been heavily involved in the U.S. fixed income markets, have downsized their capital markets staffing and market making.  While various pools of capital have attempted to replace these traditional intermediaries, the effect of new entrants has been muted.  Non-bank intermediaries such as hedge funds and start-up broker/dealers have had uneven results and have been reluctant to commit meaningful capital to market making.  At the same time, several alternative bond trading platforms have failed to gain a toehold in the markets (with the liquidation of the online start-up Bondcube being the latest failure).

Shift in the Bond Buyer Universe

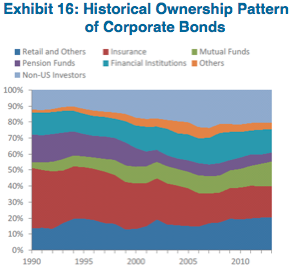
At the same time that bond market liquidity has been challenged by increased regulations and a narrowed field of intermediaries, the bond buyer universe has experienced a transformation.  Insurance companies and pensions have remained large buyers, but their proportion of the market has dropped.   In contrast, mutual funds/ETFs and foreign buyers have increased as a proportion of the buyer base as investors have attempted to offset the impact of low rates by extending from money market funds (Exhibit 16).

Source: Fed Flow of Funds (as of December 2013)

The investment management field has experienced rapid consolidation as bond buyers strive to gain economies of scale.  Over the past decade, the twenty largest institutional fixed income managers have increased to 60% of total fixed income assets under management vs. 50% a decade ago, even as the overall market size has grown.

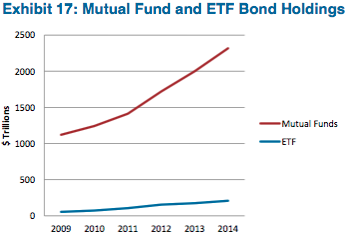
Importantly, the mutual fund and ETF component of these asset managers’ AUM have grown as investors that previously would have invested in money market or treasuries instead pursue income through broad fixed income exposure (Exhibit 17).

Source: Federal Reserve


Source: Morgan Stanley Research (May 2015), Yieldbook, Bloomberg

Implications for Investors

Corporate bonds as an asset class have largely been a one way trade since 2008, with spreads tightening even as supply has exploded.  Reduced liquidity has ramifications for investment management clients both in the current environment, and when the credit cycle turns.

Going forward, total return opportunities in fixed income will increasingly be generated from yield as opposed to opportunistic trading.  While increased scale benefits the largest managers in the new issue allocation process, their absolute size is making it increasingly difficult to build meaningful positions across portfolios.  Stealth indexing becomes a risk if managers are forced to buy every new deal that comes to market just to maintain diversity and exposure.

Because of the lack of secondary market liquidity, large managers also face limits on their ability to add to positions outside of the new issue market.  And liquidity challenges will be aggravated in more volatile markets, making outsized positions difficult to liquidate in more volatile markets.  In this context, portfolio construction becomes an enterprise risk management consideration.  Bond maturities and cash flow profiles of fixed income portfolios will be critical to meeting client liquidity needs.

In this environment, investment performance will accrue to the providers of liquidity from forced sellers.  It will be critical to position client fixed income and surplus strategies to be liquidity providers when there are forced sellers and traditional intermediaries pull back from the market.

Against this backdrop, the benefits of hiring a nimble manager become readily apparent.  Defined as being able to execute a chosen investment strategy in the current and foreseeable markets, nimble managers necessarily:

  • Can implement portfolio positioning through trades roughly at the market average trade size
  • Are able to achieve duration targets in individual credits without owning every outstanding issue
  • Do not need to own every issuer that comes to market  in order to achieve credit diversification
  • Can reduce or eliminate credit exposures without causing market dislocations

It is important to make the distinction between managers that are merely small and those that are nimble, with the latter maintaining institutional level market access and an investment team that is able to independently identify and recommend investments on a timely basis.

Specific Example:

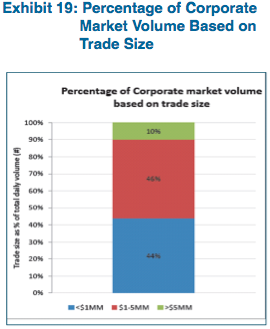
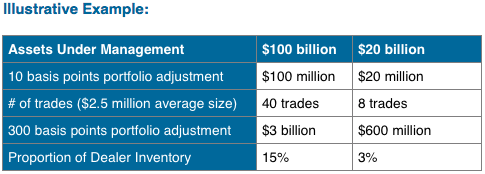
With 90% of total corporate bond trade volume in lot sizes below $5 million, the ability to build material positions outside of the new issue market is minimized.  As an example, a manager with $100 billion in assets under management (AUM) trying to grow an exposure to a single credit from 10 basis points to 20 basis points of the portfolio would likely need to execute close to 50 separate trades (Exhibit 19).

Source: AAM, TRACE
Source: AAM, TRACE

Even more concerning is the prospect of increasing volatility of both flows and spreads when market sentiment turns.  Returning to our hypothetical $100 billion AUM manager, we assume a 20% weighting to corporate bonds ($20 billion).  A decision to reduce corporate bond exposure to 17% necessitates the sale of $3 billion of bonds.  Within the context of the average trade size of less than $5 million, this would entail in excess of 500 trades.  Even assuming that a larger manager was able to engage in block trades for a portion of the portfolio reduction, a $3 billion portfolio reduction represents 15% of total primary dealer inventory, so it is reasonable to expect that such a repositioning would impact prices and likely require a sustained period of time in order to execute.  If such a repositioning were occurring against the backdrop of a negative shift in market sentiment and a pull back by intermediaries, the ability of larger managers to execute portfolio shifts would be further constrained.

Screen Shot 2016-01-27 at 08.33.40

Considerations Going Forward

Have regulatory efforts to decrease systemic risk in the banking system increased systemic risk in the capital markets?

To be determined; while lower liquidity/increased volatility appear to be the unintended consequence of the regulatory response to the global financial crisis, higher capitalization and lower systemic leverage (in the financial system anyway) mean that the financial system is better able to sustain the same.

How will fixed income investors react to an eventual removal of easy monetary policy by central banks?

While a sustained rising rate environment would benefit insurance investment clients, the reaction of the new entrants (foreign investors/retail mutual funds/ETFs) in the face of falling prices is less certain.  Although mutual funds and ETFs promise continual liquidity to investors, this has yet to be tested in a sustained rising rate environment, particularly for illiquid underlying investments such as corporate or municipal bonds.

Should fixed income investors pay active management fees for passive management results?

We previously touched on the potential for “stealth indexing” to occur when large managers are forced to buy new issues indiscriminately just to stay diversified. Clients should pay careful attention to their investment managers’ ability to customize portfolios and execute their investment ideas efficiently, while also generating needed liquidity, achieving target returns, and prudently managing risk.

N. Sebastian Bacchus, CFA
Senior Analyst, Corporate Credit


Disclaimer: Asset Allocation & Management Company, LLC (AAM) is an investment adviser registered with the Securities and Exchange Commission, specializing in fixed-income asset management services for insurance companies. This information was developed using publicly available information, internally developed data and outside sources believed to be reliable.  While all reasonable care has been taken to ensure that the facts stated and the opinions given are accurate, complete and reasonable, liability is expressly disclaimed by AAM and any affiliates (collectively known as “AAM”), and their representative officers and employees.  This report has been prepared for informational purposes only and does not purport to represent a complete analysis of any security, company or industry discussed. Any opinions and/or recommendations expressed are subject to change without notice and should be considered only as part of a diversified portfolio. A complete list of investment recommendations made during the past year is available upon request. Past performance is not an indication of future returns.

This information is distributed to recipients including AAM, any of which may have acted on the basis of the information, or may have an ownership interest in securities to which the information relates.  It may also be distributed to clients of AAM, as well as to other recipients with whom no such client relationship exists.  Providing this information does not, in and of itself, constitute a recommendation by AAM, nor does it imply that the purchase or sale of any security is suitable for the recipient. Investing in the bond market is subject to certain risks including market, interest-rate, issuer, credit, inflation, liquidity, valuation, volatility, prepayment and extension. No part of this material may be reproduced in any form, or referred to in any other publication, without express written permission.
July 22, 2015 by

Volatility increased this quarter with investment grade credit spreads widening 16 basis points versus Treasuries in the second quarter.  The main drivers of this widening included Greece, China, and increased merger and acquisition (M&A) activity.  M&A activity in the second quarter was the highest in twelve years.  We highlighted all of these issues in last quarter’s newsletter (The Top Five Issues That Will Affect Corporate Credit Spreads Today).

This quarter, we discuss the deterioration in investment grade credit fundamentals and what that means for investors when growth contracts and default risk increases.   We believe this will become a critical issue over the near-to-medium term.

Credit Quality Deterioration

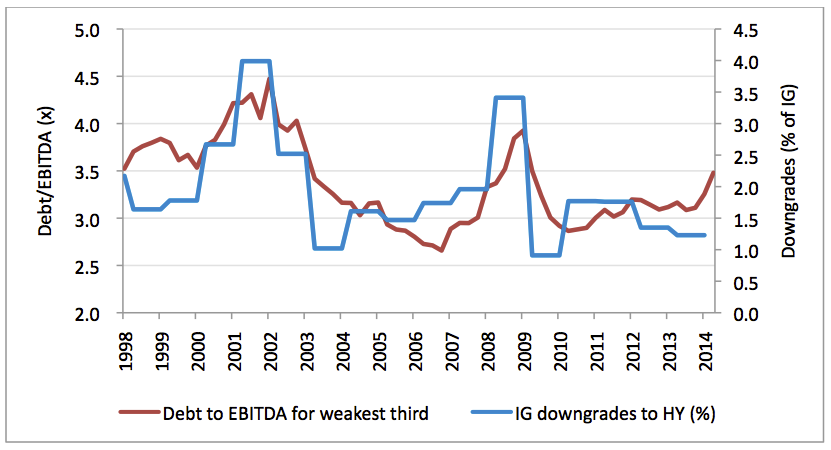
We have witnessed a marked decline in credit quality since mid-year 2014, as commodity prices have declined and debt has increased to fund shareholder returns and M&A.  When measuring the debt/EBITDA leverage of about 400 nonfinancial, nonutility investment grade credits and isolating the bottom third each quarter (defined as those with the highest debt leverage), leverage is approaching 4x, which is quite high considering the economy is still expanding.  As seen in Exhibit 1, leverage has increased when the economy contracts, resulting in increased downgrades to high yield.  While the rating agencies claim to assign ratings that reflect performance through an economic cycle, this has not generally proven to be the case.

Exhibit 1: Rating Downgrades to High Yield Expected to Increase

Sources: Leverage – AAM (Includes over 400 nonutility and nonfinancial companies);
Downgrades – S&P 2014 “Annual Global Corporate Default Study and Rating Transitions,”
Diane Vazza, April 30, 2015

Ratings Risk and Defaults

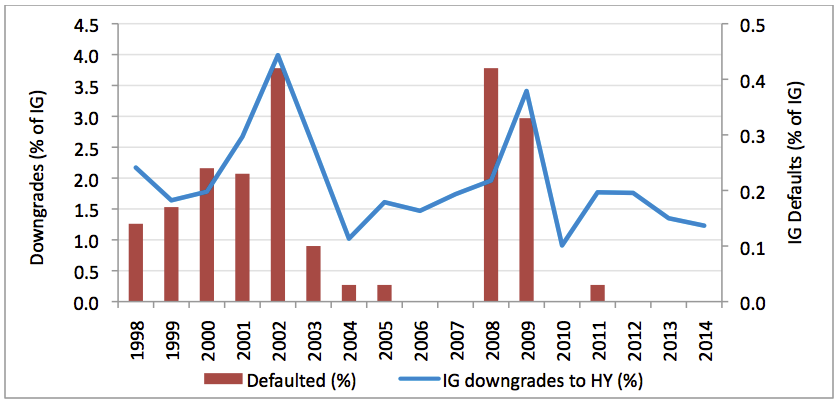
Simply, leverage is increasing and we expect rating actions to follow. As one would expect, increased leverage has been positively correlated with the percentage of investment grade companies that have defaulted, as shown in Exhibit 2.

Exhibit 2: Investment Grade Defaults Increase as Ratings Migrate Lower

Source: Standard & Poor’s 2014 “Annual Global Corporate Default Study And Rating Transitions,” Diane Vazza, April 30, 2015

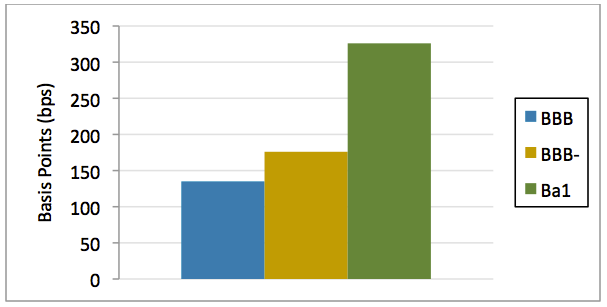
The first question to ask is “are investors getting paid for the risk?”  Our answer is “no,” we do not believe investors in low investment grade rated securities are being appropriately compensated.  As Exhibit 3 shows, a one notch downgrade into high yield should result in a one percentage point increase in spread versus Treasuries.  That has a material impact on the pricing of that security, and the default risk increases as well.

Exhibit 3: Rating Risk is Not Reflected in BBB- Securities

Source: AAM using five year maturities for BBB and BBB- rated securities; Barclays OAS for Ba1 rated securities with a duration of 4.8. 

Market Liquidity

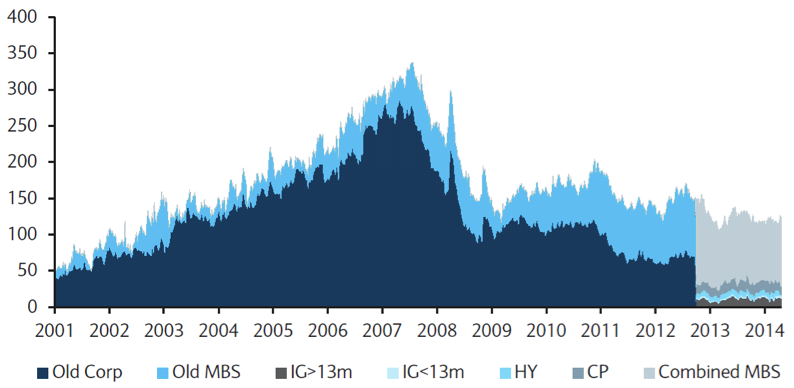
The second question becomes “if investors are not getting paid for the risk, can they simply sell the security?”  Our answer is “it depends.”  In the equity market, if an investment analyst believes the stock will underperform, the stock can be sold into the marketplace.  The corporate bond market is an over-the-counter market, which means dealers act as intermediaries, quoting where bonds can be sold or purchased.  Regulators have made it more onerous for these intermediaries to hold positions due to increased capital requirements and tighter risk limits, resulting in a much smaller secondary debt market (Exhibit 4).  The decline from $280 billion in 2007 to a low of approximately $20 billion in 2014 is remarkable.

Exhibit 4: Net Primary Dealer Positions in Corporates, Commercial Paper, and MBS ($B)

Source: Federal Reserve, Bloomberg, Barclays Research

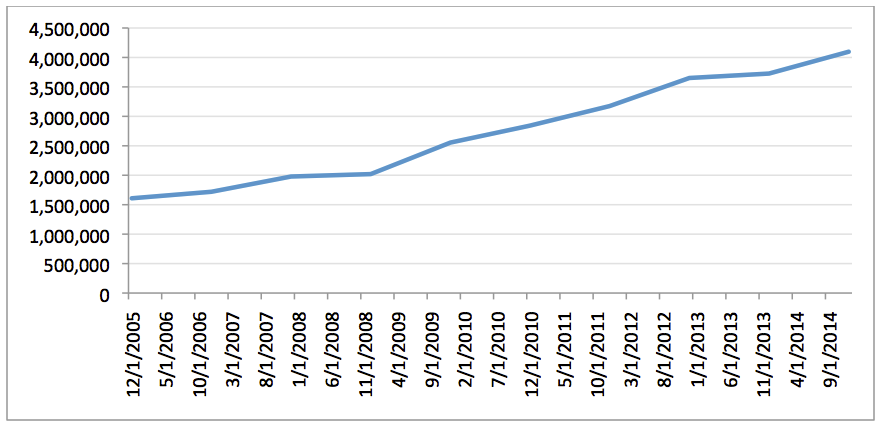
While the secondary debt market has fallen in size, the amount of debt outstanding has increased, as interest rates have declined (Exhibit 5).  Where dealers used to control 4-5% of the market, they control less than 0.5% today.

Exhibit 5:  U.S. Investment Grade Corporate Debt Market ($MM)

Source:  Barclays Corporate Index, AAM

The illiquidity of the corporate bond market has caught the attention of the Federal Reserve and has been the topic for many financial reporters.  Although many investment managers have talked about developing electronic trading platforms, they have failed to penetrate the market.  According to the Financial Times[note]Michael Mackenzie “Search for liquidity tests corporate bond market,” Financial Times, November 4, 2014, accessed July 20, 2015, https://www.ft.com/cms/s/0/9ee487fa-4e43-11e4-adfe-00144feab7de.html#axzz3gYs9Ufrj.[/note], Greenwich Associates, a consultancy, estimates that 16% of institutional trading of investment-grade bonds is done via electronic platforms.  And, while electronic trading is gaining some traction, it has involved smaller sized trades (i.e., less than $1 million) versus $5 million and higher.

Summary

Therefore, the bond market’s illiquidity may present challenges to larger managers who want to execute on the ideas originated by their investment staff.   At AAM, our size allows us to be nimble and gives our portfolio managers the opportunity to execute on the ideas our team originates.  We believe as the cycle matures and rating downgrades increase, smaller managers have a greater ability to differentiate and to outperform their larger peers.

Elizabeth Henderson, CFA
Director of Corporate Credit

For more information about AAM or any of the information in the Corporate Credit View, please contact:

Colin T. Dowdall, CFA, Director of Marketing and Business Development
colin.dowdall@aamcompany.com

John J. Olvany, Vice President of Business Development
john.olvany@aamcompany.com

Neelm Hameer, Vice President of Business Development
neelm.hameer@aamcompany.com

Disclaimer: Asset Allocation & Management Company, LLC (AAM) is an investment adviser registered with the Securities and Exchange Commission, specializing in fixed-income asset management services for insurance companies. This information was developed using publicly available information, internally developed data and outside sources believed to be reliable. While all reasonable care has been taken to ensure that the facts stated and the opinions given are accurate, complete and reasonable, liability is expressly disclaimed by AAM and any affiliates (collectively known as “AAM”), and their representative officers and employees. This report has been prepared for informational purposes only and does not purport to represent a complete analysis of any security, company or industry discussed. Any opinions and/or recommendations expressed are subject to change without notice and should be considered only as part of a diversified portfolio. A complete list of investment recommendations made during the past year is available upon request. Past performance is not an indication of future returns.

This information is distributed to recipients including AAM, any of which may have acted on the basis of the information, or may have an ownership interest in securities to which the information relates. It may also be distributed to clients of AAM, as well as to other recipients with whom no such client relationship exists. Providing this information does not, in and of itself, constitute a recommendation by AAM, nor does it imply that the purchase or sale of any security is suitable for the recipient. Investing in the bond market is subject to certain risks including market, interest-rate, issuer, credit, inflation, liquidity, valuation, volatility, prepayment and extension. No part of this material may be reproduced in any form, or referred to in any other publication, without express written permission.


May 13, 2015 by

Illinois faces an increased risk of credit rating downgrades after the 2013 pension overhaul was struck down by the Illinois Supreme Court as unconstitutional. Illinois already has the lowest credit rating among U.S. states of A3/A-/A- by Moody’s, S&P and Fitch.

Standard & Poor’s placed the state’s rating on CreditWatch with negative implications following the court ruling, stating that it expects to decide on the rating within three months. Moody’s and Fitch both maintain a negative outlook for their Illinois ratings.

Illinois faces a significant structural imbalance with more than a $6 billion operating deficit for the next fiscal year and a severe pension funding shortfall (39.3% funded). The state has regularly used payment deferrals to manage its operating cash fund. Illinois has long term weak management practices reflected in pension underfunding, bill payment delays and chronic GAAP-basis negative fund balances.

The 2013 pension law overturned by the court would have reduced retirement costs by shrinking cost-of-living increases for retirees, raised retirement ages for younger employees and capped the size of pensions. The overhaul was expected to save $145 billion over 30 years. The ruling by the court stated that under the state constitution benefits promised as part of a pension plan for public workers shall not be diminished or impaired.

Illinois Governor Bruce Rauner who took office in January is expected to propose a new pension overhaul plan which would require amending the state constitution. Pension benefits already earned are expected to be preserved under the plan while unearned benefits would be transferred to a new 401K-type plan. The plan includes asking voters to approve the constitutional change in 2016 that removes the language that protects retirement payments.

The Illinois Supreme Court’s overturning of the statue also limits the City of Chicago’s options for curbing growth in its own unfunded pension liability. Simply, the State cannot afford to support an ailing City of Chicago.  Consequently, Moody’s downgraded Chicago’s general obligation (GO) debt two notches to Ba1, causing the rating to fall to high yield yesterday.  The rating agency continues to have a Negative Outlook for the rating since it expects Chicago’s credit challenges will continue, making future rating actions appear likely.  AAM continues to believe the risks are too high to justify municipal investments in the State of Illinois and the City of Chicago.  The City of Chicago’s 10 year bond spreads widened 100 basis points after the announcement of the downgrade.

Hugh R. McCaffrey, CFA
Senior Analyst, Corporate Credit


April 22, 2015 by

Fallen Angels Expected to Increase

By Elizabeth Henderson, CFA
Director of Corporate Credit

Elizabeth Henderson

[toc]

Volatility increased this quarter with investment grade credit spreads widening 16 basis points versus Treasuries in the second quarter.  The main drivers of this widening included Greece, China, and increased merger and acquisition (M&A) activity.  M&A activity in the second quarter was the highest in twelve years.  We highlighted all of these issues in last quarter’s newsletter (The Top Five Issues That Will Affect Corporate Credit Spreads Today).

This quarter, we discuss the deterioration in investment grade credit fundamentals and what that means for investors when growth contracts and default risk increases.   We believe this will become a critical issue over the near-to-medium term.

Credit Quality Deterioration

We have witnessed a marked decline in credit quality since mid-year 2014, as commodity prices have declined and debt has increased to fund shareholder returns and M&A.  When measuring the debt/EBITDA leverage of about 400 nonfinancial, nonutility investment grade credits and isolating the bottom third each quarter (defined as those with the highest debt leverage), leverage is approaching 4x, which is quite high considering the economy is still expanding.  As seen in Exhibit 1, leverage has increased when the economy contracts, resulting in increased downgrades to high yield.  While the rating agencies claim to assign ratings that reflect performance through an economic cycle, this has not generally proven to be the case.

Exhibit 1: Rating Downgrades to High Yield Expected to Increase

AAM Corp Credit Spring-2014 1

Sources: Leverage – AAM (Includes over 400 nonutility and nonfinancial companies); Downgrades – S&P 2014 “Annual Global Corporate Default Study and Rating Transitions,” Diane Vazza, April 30, 2015

Ratings Risk and Defaults

Simply, leverage is increasing and we expect rating actions to follow. As one would expect, increased leverage has been positively correlated with the percentage of investment grade companies that have defaulted, as shown in Exhibit 2.

Exhibit 2: Investment Grade Defaults Increase as Ratings Migrate Lower

AAM Corp Credit Spring-2014 2

Source: Standard & Poor’s 2014 “Annual Global Corporate Default Study And Rating Transitions,” Diane Vazza, April 30, 2015

The first question to ask is “are investors getting paid for the risk?”  Our answer is “no,” we do not believe investors in low investment grade rated securities are being appropriately compensated.  As Exhibit 3 shows, a one notch downgrade into high yield should result in a one percentage point increase in spread versus Treasuries.  That has a material impact on the pricing of that security, and the default risk increases as well.

Exhibit 3: Rating Risk is Not Reflected in BBB- Securities

AAM Corp Credit Spring-2014 3

Source: AAM using five year maturities for BBB and BBB- rated securities; Barclays OAS for Ba1 rated securities with a duration of 4.8. 

Market Liquidity

The second question becomes “if investors are not getting paid for the risk, can they simply sell the security?”  Our answer is “it depends.”  In the equity market, if an investment analyst believes the stock will underperform, the stock can be sold into the marketplace.  The corporate bond market is an over-the-counter market, which means dealers act as intermediaries, quoting where bonds can be sold or purchased.  Regulators have made it more onerous for these intermediaries to hold positions due to increased capital requirements and tighter risk limits, resulting in a much smaller secondary debt market (Exhibit 4).  The decline from $280 billion in 2007 to a low of approximately $20 billion in 2014 is remarkable.

Exhibit 4: Net Primary Dealer Positions in Corporates, Commercial Paper, and MBS ($B)

AAM Corp Credit Spring-2014 4

Source: Federal Reserve, Bloomberg, Barclays Research

While the secondary debt market has fallen in size, the amount of debt outstanding has increased, as interest rates have declined (Exhibit 5).  Where dealers used to control 4-5% of the market, they control less than 0.5% today.

Exhibit 5:  U.S. Investment Grade Corporate Debt Market ($MM)

AAM Corp Credit Spring-2014 5

Source:  Barclays Corporate Index, AAM

The illiquidity of the corporate bond market has caught the attention of the Federal Reserve and has been the topic for many financial reporters.  Although many investment managers have talked about developing electronic trading platforms, they have failed to penetrate the market.  According to the Financial Times[note]Michael Mackenzie “Search for liquidity tests corporate bond market,” Financial Times, November 4, 2014, accessed July 20, 2015, https://www.ft.com/cms/s/0/9ee487fa-4e43-11e4-adfe-00144feab7de.html#axzz3gYs9Ufrj.[/note], Greenwich Associates, a consultancy, estimates that 16% of institutional trading of investment-grade bonds is done via electronic platforms.  And, while electronic trading is gaining some traction, it has involved smaller sized trades (i.e., less than $1 million) versus $5 million and higher.

Summary

Therefore, the bond market’s illiquidity may present challenges to larger managers who want to execute on the ideas originated by their investment staff.   At AAM, our size allows us to be nimble and gives our portfolio managers the opportunity to execute on the ideas our team originates.  We believe as the cycle matures and rating downgrades increase, smaller managers have a greater ability to differentiate and to outperform their larger peers.

Elizabeth Henderson, CFA
Director of Corporate Credit

For more information about AAM or any of the information in the Corporate Credit View, please contact:

Colin Dowdall, CFA, Director of Marketing and Business Development

colin.dowdall@aamcompany.com

John Olvany, Vice President of Business Development

john.olvany@aamcompany.com

Neelm Hameer, Vice President of Business Development

neelm.hameer@aamcompany.com

Disclaimer: Asset Allocation & Management Company, LLC (AAM) is an investment adviser registered with the Securities and Exchange Commission, specializing in fixed-income asset management services for insurance companies. This information was developed using publicly available information, internally developed data and outside sources believed to be reliable. While all reasonable care has been taken to ensure that the facts stated and the opinions given are accurate, complete and reasonable, liability is expressly disclaimed by AAM and any affiliates (collectively known as “AAM”), and their representative officers and employees. This report has been prepared for informational purposes only and does not purport to represent a complete analysis of any security, company or industry discussed. Any opinions and/or recommendations expressed are subject to change without notice and should be considered only as part of a diversified portfolio. A complete list of investment recommendations made during the past year is available upon request. Past performance is not an indication of future returns.

This information is distributed to recipients including AAM, any of which may have acted on the basis of the information, or may have an ownership interest in securities to which the information relates. It may also be distributed to clients of AAM, as well as to other recipients with whom no such client relationship exists. Providing this information does not, in and of itself, constitute a recommendation by AAM, nor does it imply that the purchase or sale of any security is suitable for the recipient. Investing in the bond market is subject to certain risks including market, interest-rate, issuer, credit, inflation, liquidity, valuation, volatility, prepayment and extension. No part of this material may be reproduced in any form, or referred to in any other publication, without express written permission.

  • « Go to Previous Page
  • Page 1
  • Interim pages omitted …
  • Page 4
  • Page 5
  • Page 6
  • Page 7
  • Page 8
  • Interim pages omitted …
  • Page 17
  • Go to Next Page »

Get updates in your inbox.

  • Investment Strategies
    • Investment Grade Fixed Income
    • Specialty Asset Classes
  • Our Clients
    • Client Experience
    • Sample RFP Download
  • Insights
    • Video
    • Webinar
    • News
    • Podcasts
  • About
    • Our Team
    • Contact
    • Client Login

Disclaimer: Asset Allocation & Management Company, LLC (AAM) is an investment adviser registered with the Securities and Exchange Commission, specializing in fixed-income asset management services for insurance companies. Registration does not imply a certain level of skill or training. This information was developed using publicly available information, internally developed data and outside sources believed to be reliable. While all reasonable care has been taken to ensure that the facts stated and the opinions given are accurate, complete and reasonable, liability is expressly disclaimed by AAM and any affiliates (collectively known as “AAM”), and their representative officers and employees. This report has been prepared for informational purposes only and does not purport to represent a complete analysis of any security, company or industry discussed. Any opinions and/or recommendations expressed are subject to change without notice and should be considered only as part of a diversified portfolio. A complete list of investment recommendations made during the past year is available upon request. Past performance is not an indication of future returns. This information is distributed to recipients including AAM, any of which may have acted on the basis of the information, or may have an ownership interest in securities to which the information relates. It may also be distributed to clients of AAM, as well as to other recipients with whom no such client relationship exists. Providing this information does not, in and of itself, constitute a recommendation by AAM, nor does it imply that the purchase or sale of any security is suitable for the recipient. Investing in the bond market is subject to certain risks including market, interest-rate, issuer, credit, inflation, liquidity, valuation, volatility, prepayment and extension. No part of this material may be reproduced in any form, or referred to in any other publication, without express written permission. *All figures shown are approximate and subject to change from quarter to quarter. **The accolades and awards highlighted herein are not statements of any advisory client and do not describe any experience with or endorsement of AAM as an investment adviser by any such client.
Copyright © 2024 AAM | Privacy and Disclosures

  • LinkedIn
  • YouTube