Economic Outlook – Marco Bravo, CFA | Senior Portfolio Manager
Market Outlook – Reed Nuttall, CFA | Chief Investment Officer
Corporate Credit – Elizabeth Henderson, CFA | Director of Corporate Credit
Structured Products – Scott Edwards, CFA | Director of Structured Products
Municipal Market – Gregory Bell, CFA, CPA | Director of Municipal Bonds
High Yield – Scott Skowronski, CFA | Senior Portfolio Manager
Convertibles – Tim Senechalle, CFA | Senior Portfolio Manager
Economic Outlook
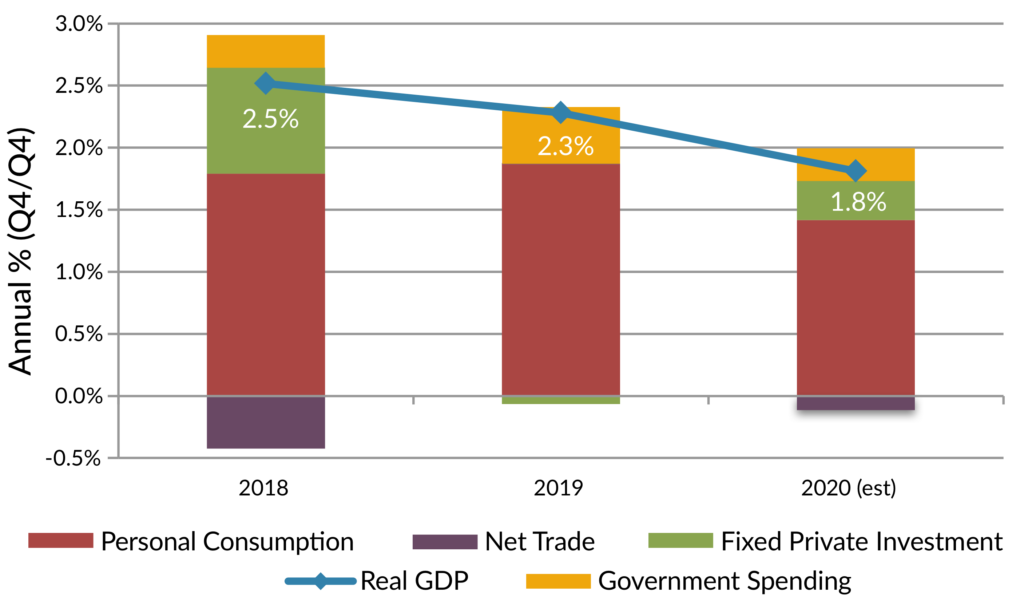
With 2020 now in the rearview mirror, we look forward to a resurgence in economic growth for 2021. After falling an estimated 2.5% on a Q4/Q4 basis in 2020, U.S. real GDP is projected to increase by 3.8% in 2021 (Bloomberg survey consensus estimates). As shown on exhibit 1, consumer spending and private investment are expected to lead the way this year. Consumers are starting the year with a large degree of savings, improving employment prospects, and the potential for additional COVID-related aid out of Washington, all of which will be supportive for consumer spending. On the private investment side, low mortgage rates should continue to support a strong housing market, and a rebound in corporate earnings should lead to increased investment. Downside risks are largely centered around COVID and a slower than anticipated rollout of vaccines. At AAM, we view the risks to GDP growth as skewed to the upside for 2021 and expect the U.S. economy to outperform consensus estimates.
Exhibit 1: Contribution to GDP Growth

Market implied inflation expectations have moved higher recently, likely the result of the potential for increased fiscal stimulus from the Biden administration, as well as weakness in the US dollar. Since the end of Q3 2020, the 10yr breakeven TIPs rate has increased by 46 basis points to a current rate of 2.09% (US Treasury, Bloomberg). Given excess global supply and slack in the economies, we don’t expect actual inflation to move above 2% this year.
The Federal Reserve last year introduced its new Flexible Average Inflation Target (FAIT) framework for monetary policy. Under this new framework, the Federal Reserve will be more focused on achieving full employment versus price stability. We believe this means that the Fed will no longer preemptively raise rates in order to stave off inflation. In fact, the Fed has made it clear that they will tolerate inflation moving above their 2% target for a period of time. With inflation expected to remain relatively benign, and the unemployment rate projected to remain above 5% this year, we expect monetary policy to remain accommodative. We think the earliest that the Fed will begin tapering their purchases of Treasury and MBS securities is 2022, and expect no change in the Fed Funds rate at least through the next two years.
Treasury yields, according to consensus forecasts, are expected to move modestly higher from current levels with a steeper yield curve. With Fed policy on hold, it’s expected for short-term Treasury rates to remain anchored to the Fed Funds rate. The benchmark 10-year Treasury yield is forecasted to end 2021 at 1.3% based on the median forecast among economists surveyed by Bloomberg. Increased federal spending and rising inflation expectations present upside risks to forecast. These risks can be offset by the continued low level of sovereign bond yields in Europe and Japan. Any significant widening in the yield differential between U.S. and non-U.S. sovereign debt will likely attract demand from foreign investors, limiting the rise in U.S. rates. Perceived weakness in the US dollar does have the potential to hamper demand from foreign investors. We are calling for the 10-year Treasury yield to end the year in a range of 1.25% to 1.5%.
Market Outlook
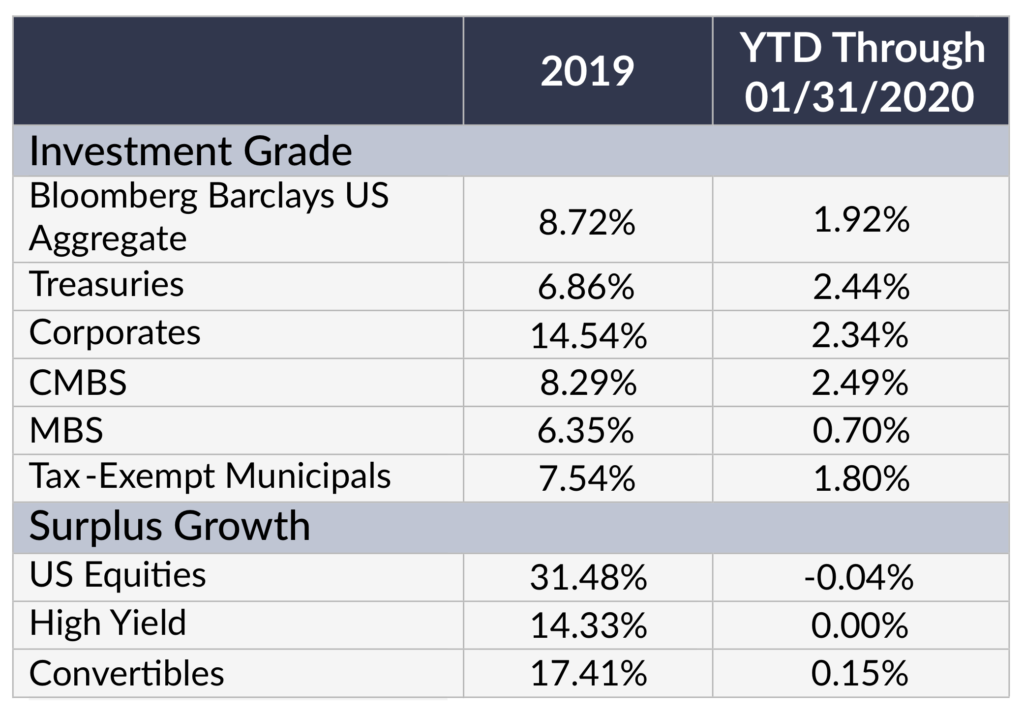
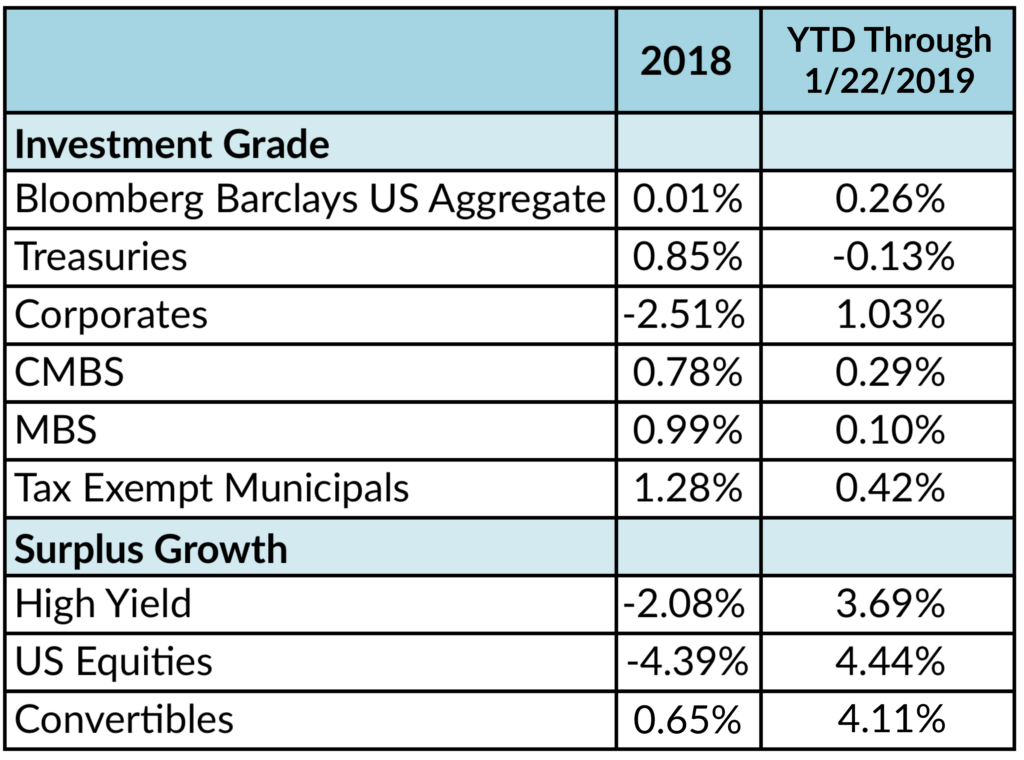
Exhibit 2: Asset Class Returns

2020
As we began 2020, markets had performed well in the previous year, spreads were tight and valuations stretched. But, the Federal Reserve had cut rates to accommodative levels, and it looked like it would be an okay year for risk assets. Our 2020 recommendation was that with limited upside left in the market, the focus should be on moving up in quality across our portfolios.
As the number of known Covid-19 cases began to rise in late February, investors began to panic and across the country companies were putting together work from home plans for all employees. By mid-March, our office buildings were empty, and most sadly the death toll began to rise so quickly that in a panic we effectively locked down the entire country. Highways and grocery store shelves were empty (How could the store be out of toilet paper?), restaurants closed, and the capital markets were in free fall. On March 16, the Federal Reserve cut the Funds rate to zero and promised to do whatever it takes to keep liquidity in the system. On March 23, Congress passed a $2 trillion aid package, known as the CARES Act. These efforts were designed to keep businesses open and provide individuals with enough money to weather the storm of rising unemployment and shuttered businesses.
These efforts gave confidence to the markets. Accordingly, the low in the stock market occurred on March 23rd and quickly rose to finish the year up 18% (Bloomberg). We had unanswered questions about when these lockdowns could end, but it was clear that keeping the economy going was a clear priority.
The government was also working to address the health crisis at hand. It partnered with a number of pharmaceutical companies to prefund vaccine purchases and help cover the cost of research and manufacturing dubbed “Operation Warp Speed.” By mid-November, announcements were made about the success of the vaccines and the markets were off to the races, reaching record highs.
2021
Just like last year, we begin this year with a very accommodative Fed, strong markets and tight credit spreads. There is uncertainty related to when we might get back to work and how many office buildings or stores or hotels we’ll need after this is all over. The markets seem to be once again reflecting the best-case scenario with little upside from spread tightening and some downside should the vaccine rollout be less than smooth. We’ll repeat our mantra from last year. Although we have a benign credit outlook, with spreads at these tight levels we believe there is limited upside in taking an aggressive position by adding the riskiest of credits. We still see some pockets of value within the corporate market and believe the positive technicals will provide a backstop to volatility.
The continued buying by the Fed in Agency MBS has created a dislocation in that sector. Our models suggest that on an option adjusted basis, this sector’s expected return is below Treasuries. We have reduced our exposure and plan to continue to underweight this sector.
Our fixed income portfolios are built to maximize income while reducing downside risk. We consistently overweight spread sectors but we strive to be flexible in our allocations. We use long Treasuries and Taxable municipals to reduce price volatility. We have seen that since 2014 the benchmark Corporate bond sector has underperformed duration matched Treasuries three of the last seven years while agency MBS four of seven and CMBS two of seven (Bloomberg Barclays). On the other hand, the ABS sector has outperformed Treasuries every year during this period (Bloomberg Barclays).
We use short high quality ABS to add stability and positive convexity versus Treasury and Agency MBS positions. We have reduced volatility by adding longer Taxable munis and Treasuries to our portfolios and limit call risk by underweighting the MBS sector. The ability to be nimble in corporates and construct yield enhanced portfolios with the use of taxable municipals and ABS has enabled the AAM managed portfolios to be consistent top quartile performers.
Since we expect a stable economy and strong technical factors, this should be a good year for the equity markets. However, after the significant run-up in valuations, we are working with our clients to ensure that portfolios have been rebalanced in accordance with strategic targets.
Corporate Credit
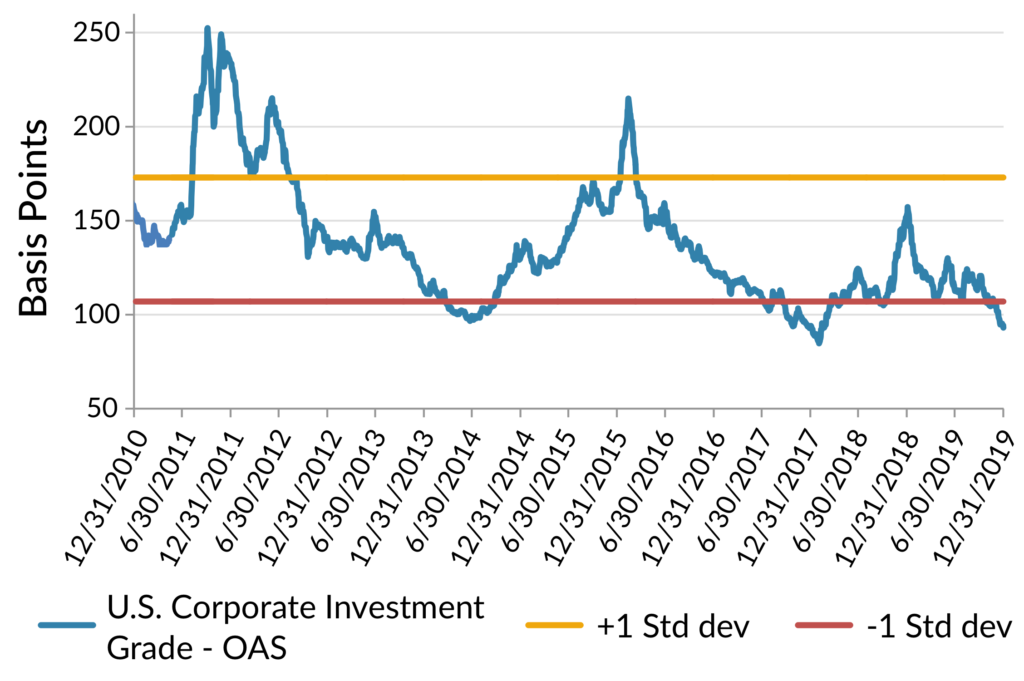
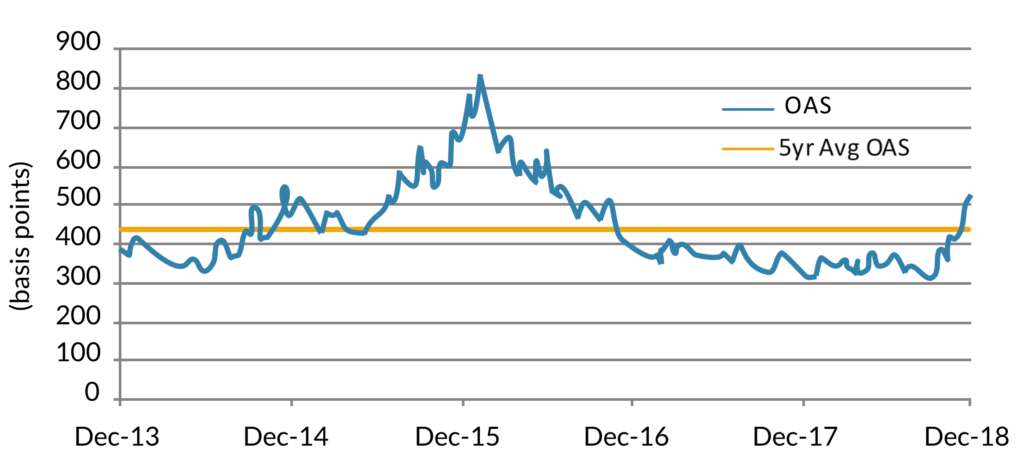
2020 was the quintessential roller coaster year for investment grade (IG) corporate bond spreads. The Corporate market OAS using the Bloomberg Barclays Corporate Index ended the year at the virtually the same level it started after widening over 300 bps in March.
Exhibit 3: Corporate OAS

As companies faced a high level of uncertainty in the spring, they issued a record amount of debt to raise cash. This additional debt coupled with EBITDA pressure resulted in debt leverage spiking, and close to 30 issuers or 3% of the Corporate Index experienced rating downgrades to high yield (Barclays Corporate Index). After a year of fundamental weakness due to the virus and related lockdowns, AAM expects credit fundamentals to rebound solidly in 2021 alongside the global economy. We expect debt leverage to improve due to falling debt levels and EBITDA growth (10-15% expected). Consequently, rating actions are expected to be more favorable this year as companies execute on deleveraging plans. Capital spending growth is expected to resume to an aggregate level that is essentially unchanged versus 2019 (“pre-COVID”). Fiscal stimulus and low interest rates are expected to fuel the economic recovery expected in 2021, as herd immunity is reached, placing us in the “recovery” phase of the cycle. Companies will have engines for growth other than financial engineering in 2021, which should be constructive for the IG market.
In addition to a favorable fundamental outlook, we expect market technicals to support spreads, with gross and net debt issuance expected to be lower in 2021 vs. years past. The liquidity in the market, low yields outside the U.S. and expectation for rates to remain low in the U.S. are supportive for IG Corporate bond demand.
Exhibit 4: Composition of Gross Investment Grade Debt Supply

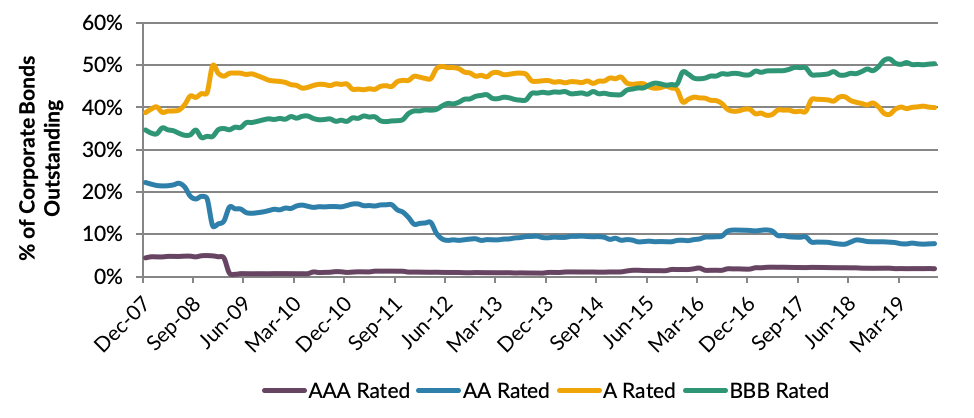
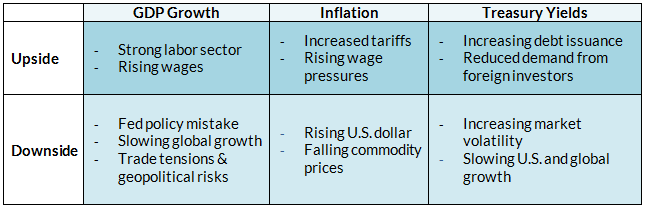
Unfortunately, spreads are very tight, and while our OAS target for year-end is 95bps, our Bull case is for the OAS to move to the 10-year minimum level of 85 reached in 2018, which we deem more likely than a Bear case in which it widens to 140 (10-year average). We expect spread curves to flatten and the premium in spread for BBB rated issuers to compress further versus higher rated issuers. Risks to our forecast includes: (1) issuers’ unwillingness to reduce debt, using liquidity for more shareholder friendly activity, (2) pace of vaccination rollout materially underwhelms expectations (3) Fed changes its accommodative stance and (4) the Biden Administration’s policy objectives threaten near term growth expectations.
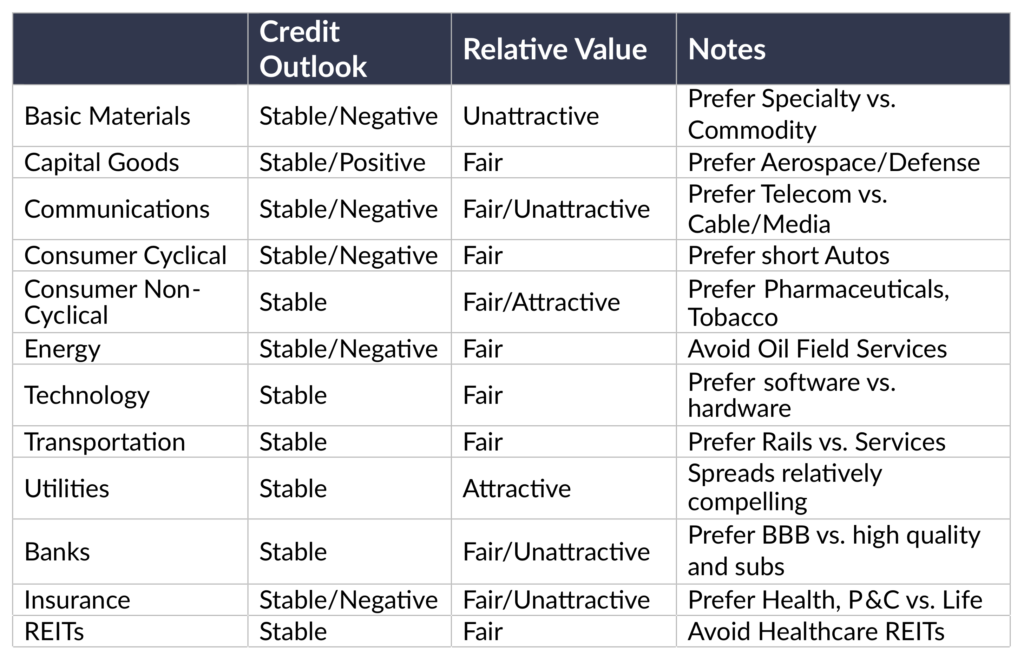
2021 is likely a year in which performance is driven by how much risk is in the portfolio versus being driven by idiosyncratic risk. That said, when the cycle moves into its next phase, it will be important to have protected the portfolio from issuers with negative fundamental outlooks because that risk will start to materialize. To help with that process, the following was compiled by our experienced analyst team, recognizing that opportunities exist in all sectors and strong credit research is an important part of that process.
Exhibit 5

Structured Products
Structured products experienced mixed returns in 2020 as both CMBS and ABS outperformed their Treasury benchmarks by 51bp and 106bp respectively while agency RMBS underperformed Treasuries by 17bp (Bloomberg index returns). We’d consider that performance pretty pedestrian based upon historical averages however when accounting for the sharp downturn in risk assets earlier in the year due to the growing pandemic, we believe the overall performance was actually quite good. Looking to 2021, we start the year with spreads that are at or below levels where we began 2020 and quite low on a historical basis as well. This certainly limits the extent to which structured products can outperform Treasuries this year. Despite these tight levels however, we do expect some incremental spread compression in both ABS and CMBS generating reasonable excess returns but once again expect agency RMBS excess returns to disappoint.
It was quite a roller coaster ride for agency RMBS in 2020. We began the year expecting a flood of mortgage issuance as the Federal Reserve unwound their latest quantitative easing program only to have to reverse course and expand their balance sheet once again. Initial expectations were for the Fed to shrink their RMBS holdings by $220B in 2020 but instead they were increased by over $850B (BankAmerica for the 850B, JPM), a multiple of the net new issuance for the market for the entire year. This steady and consistent buying drove down mortgage rates, causing homeowners to rush to prepay their loans, eroding the entire incremental yield of the RMBS securities over and above Treasuries. Although rates have risen a bit in January, roughly 60-70% of all outstanding mortgage loans carry interest rates that are higher than current borrowing rates (Case Shiller, BofA, Citi, JPM). We expect prepayments to remain elevated over the course of 2021, reducing expected return for RMBS securities below that of Treasuries.
Non-Agency RMBS looks much more compelling to us as we believe the higher yields offered by non-government guaranteed securities more than offsets the risk of higher prepayments afflicting agency guaranteed securities. Credit risk seems quite manageable as one surprising consequence of the pandemic has been an increase in demand for larger suburban housing, the type backing many non-agency securitizations. Homeowners looking to escape urban settings and the need to create home office space have driven the demand for housing well above supply in many parts of the country. Home prices nationwide rose by nearly 6% in 2020 and are expected to increase another 3-4% in 2021 (JPM, BofA). Continued fiscal support from Congress in the form of additional stimulus payments, supplemental unemployment insurance and a recovering employment market along with home price appreciation should contribute to solid credit fundamentals for non-agency securitizations over the coming year.
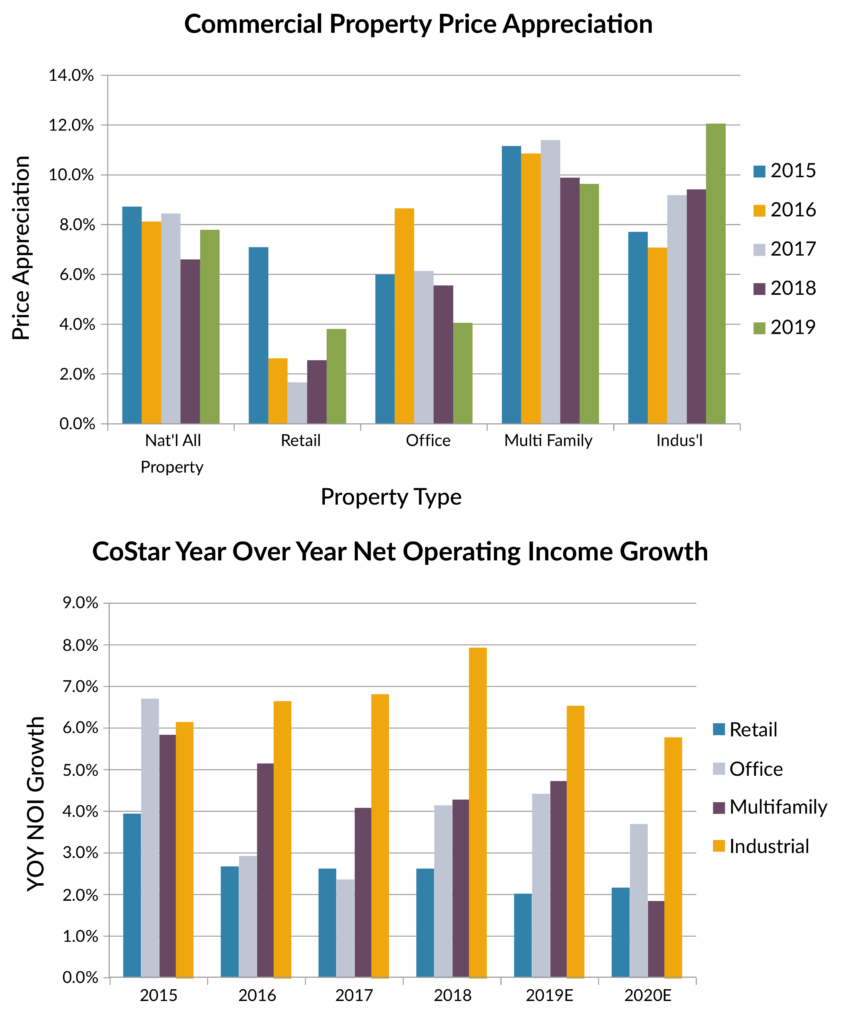
There remain many questions concerning the long-term impact of the coronavirus on commercial property markets. In particular the acceleration of online shopping replacing brick and mortar retail outlets and the need for expensive downtown office properties as employers embrace more work from home strategies. The pressure brought by these fundamental changes to key parts of the commercial property market are going to place significant downward pressure on valuations and operating metrics for marginal B and C properties in a wide variety of subsectors. Well placed, Class A properties, we believe will continue to thrive however. The old adage about location, location, location holds today more so than ever. We believe that by carefully stress testing properties underlying securitizations, we can identify those securities that will exhibit the best overall credit performance. We believe Senior, Aaa rated bonds remain the best value as high levels of credit enhancement should provide ample protection against the volatility in credit fundamentals we expect in the coming year. While we expect spreads to compress to Treasuries, it will be somewhat dependent on the performance of single A corporate bonds. CMBS tracks corporate bonds spreads closely and without a similar tightening in corporate spreads, CMBS will likely have difficulty following through on their own.
Exhibit 6: CPPI Growth is Decelerating

ABS have always been one of the most consistent performers within the structured products universe. They provide high credit quality and stable cash flows making them a staple in our portfolios for shorter maturity needs in lieu of Treasuries. While we expect ABS to outperform other asset classes at the short end of the yield curve, valuations are strained for the larger, more generic sectors of the market. Spreads to Treasuries are as low as 10-15bp for large auto and credit card issuers making them fairly unappealing compared to Agency CMBS and Taxable Municipals. The demand for very short-term assets based on market expectations for higher yields and a steeper yield curve have driven short term spreads to extremely low levels. We do see value in more esoteric sectors, such as railcar, container and equipment securitizations, where spreads north of 100bp have the ability to generate returns well in excess of Treasuries particularly those yielding only 15-20bp.
Municipal Market
After a tumultuous year in which the pandemic-induced recession generated record low interest rates, massive volatility in relative valuations for the taxable and tax-exempt municipal sectors and a record surge in municipal new issue supply, our outlook for the municipal sector in 2021 is very similar to our outlook going into 2020. For tax-exempt municipals, we are maintaining a negative bias for the sector based in large part on the very expensive relative valuation profile of the sector versus taxable alternatives. Based on data from Thomson Municipal Market Data, ‘AAA’ rated municipal nominal yield levels as a percentage of Treasury yields during January fell to a 29-year low of 68%.
The overvalued condition for tax-exempts has primarily been driven by positive technical and credit factors over the last few months. From a technical perspective, tax-exempt new issue supply during the year has largely been manageable. In a year in which the Bond Buyer reported overall municipal supply reached a new record of $474 billion, 2020 tax-exempt supply actually saw a decline of 4% from 2019 levels to $319 billion. The demand profile, however, has been building in momentum since the implementation of fiscal stimulus that helped the sector weather the largest liquidity and economic concerns related to the pandemic. Although questions remain as to the extent that state and local governments will see additional stimulus, the general election and senate run-off races that produced Democratic control across both houses of congress and the White House has provided a more constructive view of municipal credit. The Biden/Harris administration has already targeted $350 billion in direct aid to state and local governments within a new $1.9 trillion stimulus package. If the measure passes, this aid should help address revenue shortfalls at the state level that Standard and Poor’s estimates will reach a cumulative total of $467 billion over the fiscal years 2020 to 2022. The potential for these positive credit developments, combined with the very favorable year-end reinvestment flows of coupons/calls/maturities, has produced one of the most relatively expensive environments for the tax-exempt market on record. Consequently, we are maintaining a negative bias for the sector and advocating a significant underweight position.
The taxable municipal market has also exhibited a similar build in performance momentum over the last few months. The same themes outlined in the tax-exempt space from a credit perspective benefitted the taxable sector; however, one area of significant difference is in the new issue supply performance. The Bond Buyer reported record taxable muni issuance of $185 billion, which incorporated $145 billion of municipal cusips and an additional $40 billion issued under corporate cusips by municipalities. Most of this issuance was tied to refinancing supply executed as advance refundings, which came in at ~$140 billion. The majority of this issuance was shoved into the market during the six-month period from May to October to avoid any potential market dislocations related to the presidential election in November. Post-election, new issuance has been muted, while demand has been incredibly strong across both retail and institutional investors. Consequently, in looking at data compiled by AAM, ‘AAA’ taxable muni spread levels during 2020 have compressed by 10 to 21 basis points (bps) across the yield curve, with the 10yr area providing the strongest performance. Going into 2021, these spreads represent the tightest relationship to Treasuries in the last 15 years. However, when comparing the sector’s yields to other spread sectors like corporates, spread levels remain modestly attractive relative to historical average relationships to ‘A’ rated industrial corporate bonds. Although we believe the taxable muni sector exhibits very limited potential toward further tightening in spread levels, we view the taxable municipal sector as fairly valued.
In looking forward to supply technicals during 2021, coming into the year, broker/dealer expectations for new issue supply ranged from $470 to $525 billion, with taxable supply incorporating ~$175 billion of this amount (Barclays, Citigroup, JP Morgan, Bank of America). Of the taxable issuance, $125 billion were expected to be refinancings executed as advance refundings (Barclays, Citigroup, JP Morgan, Bank of America). However, most of these estimates were derived before the Georgia senate run-off elections that resulted in Democrats taking majority control of the chamber. Under this new development, there could be substantial changes in the makeup of issuance during the year between the tax-exempt and taxable markets, especially as it relates to any potential Biden/Harris administration initiatives tied to infrastructure and tax reform.
Under tax reform, the market expects that tax-exempt advance refundings, which were abolished under the Tax Cut and Jobs Act of 2017 (TCJA), will likely be reinstated to the tax-exempt sector. The market also expects that an infrastructure plan will be introduced that will be funded in part within the taxable muni market through the use of direct-pay bonds. This approach would emulate the Build America Bond program that was utilized during the Obama/Biden administration in 2009 and 2010 to fund capital spending. If tax reform and infrastructure are addressed later in the year, we would expect that supply expectations going into 2021 would remain in place. However, if these measures are addressed early this year, the risk is that we could see much higher issuance levels this year, with tax-exempt issuance surprising to the upside. Taxable muni supply would not be expected to change dramatically, as any reduction in advance refunding issuance is expected to be supplanted by direct-pay issuance from infrastructure-related supply.
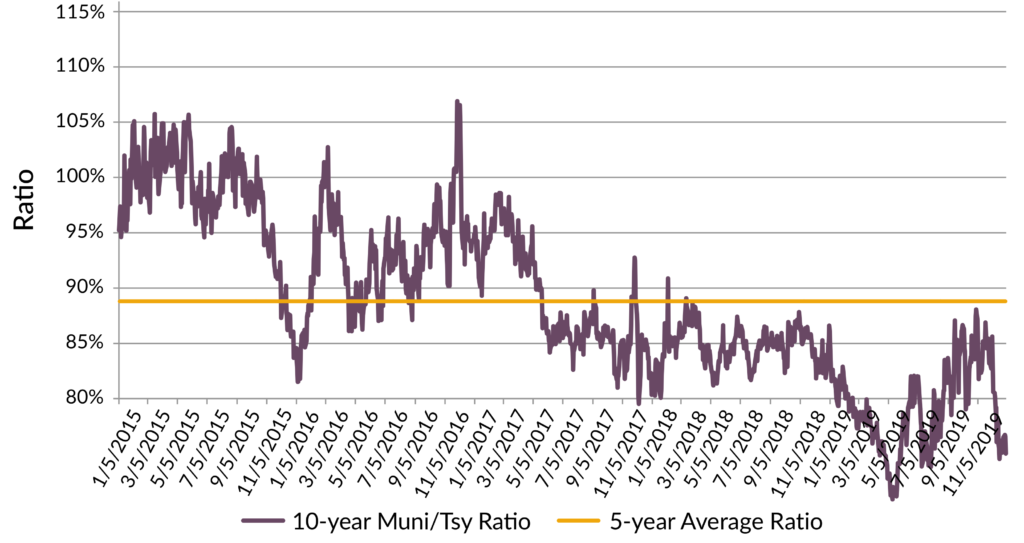
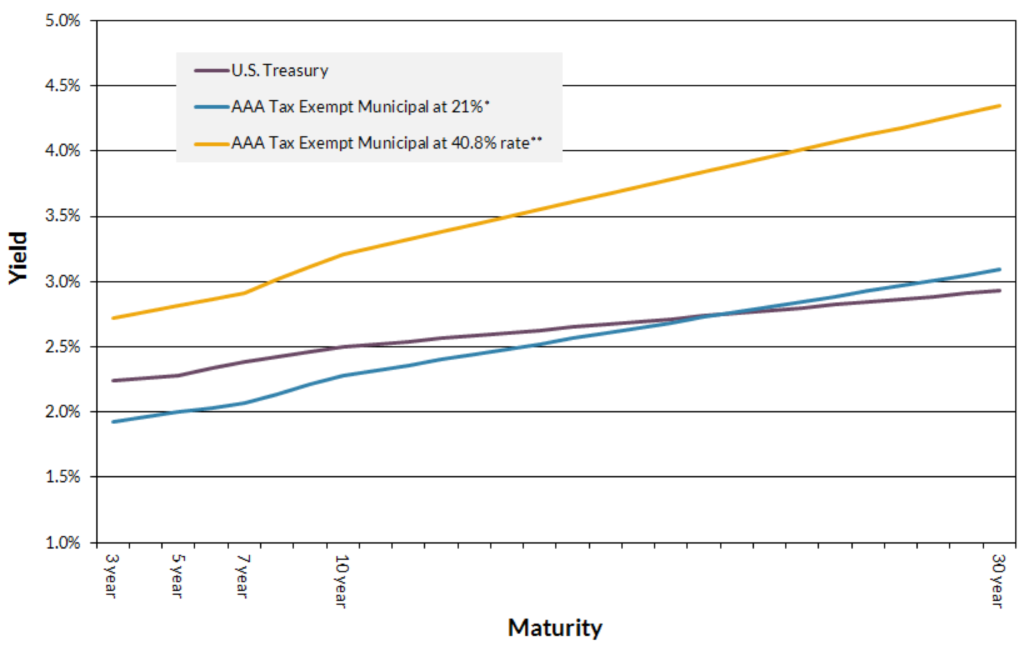
Exhibit 7: Tax-Exempt Relative Valuation Levels Remain Unattractive for Insurers

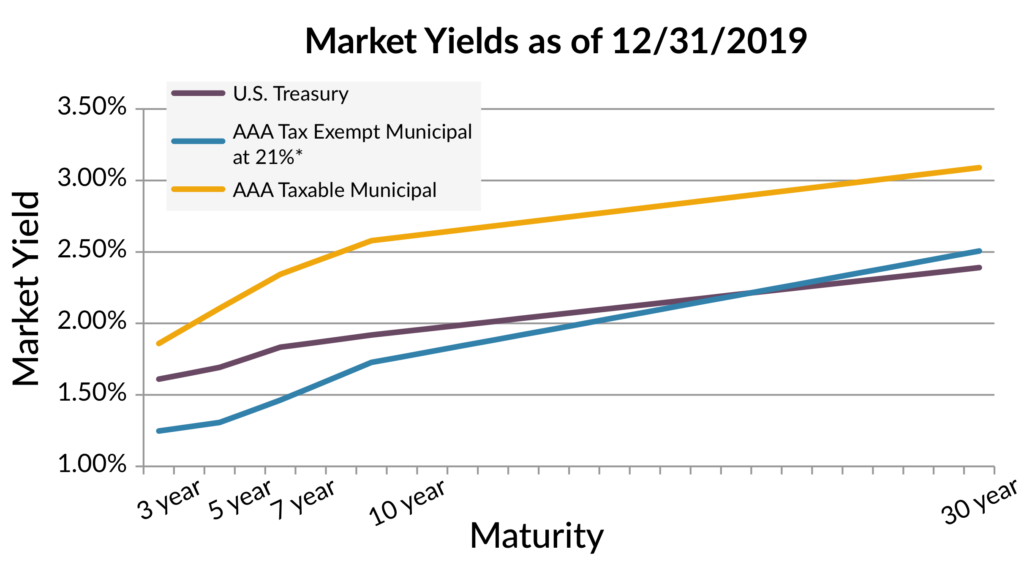
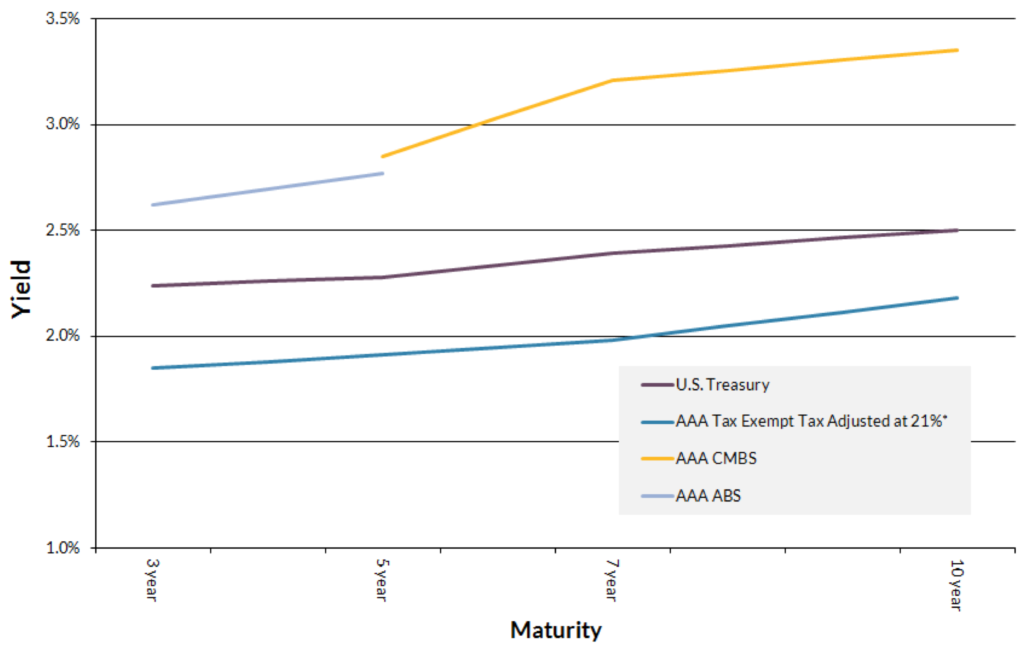
Exhibit 8: Taxable Munis: Compelling Alternative to Tax-Exempts

High Yield
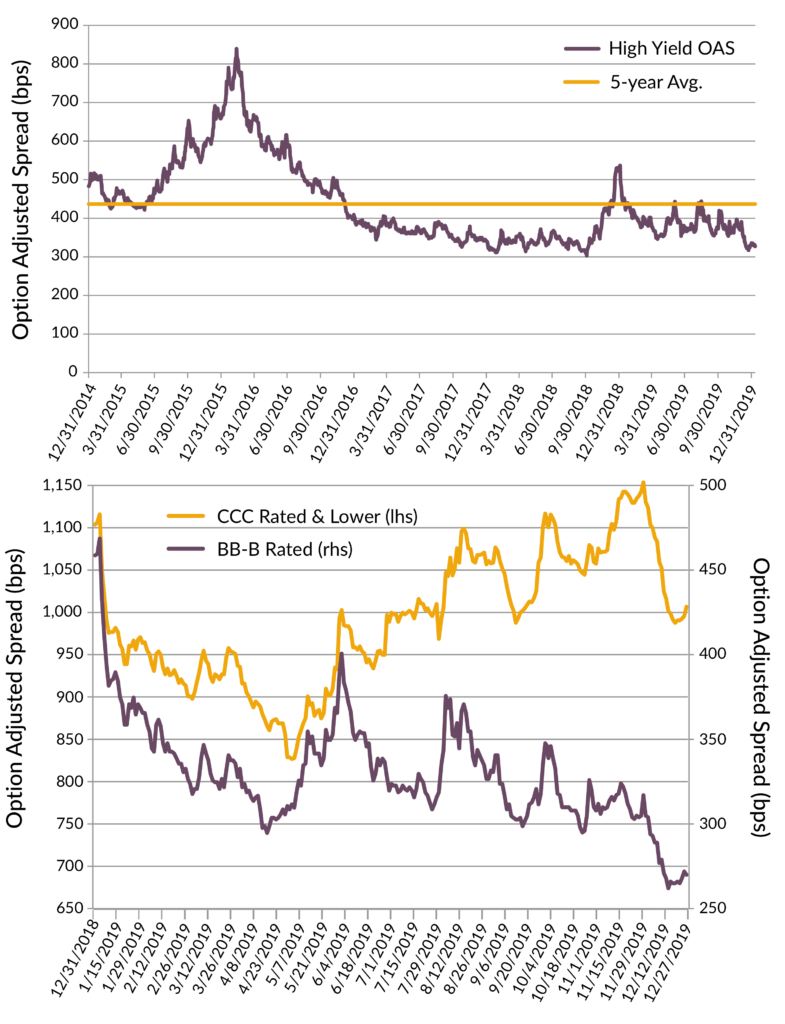
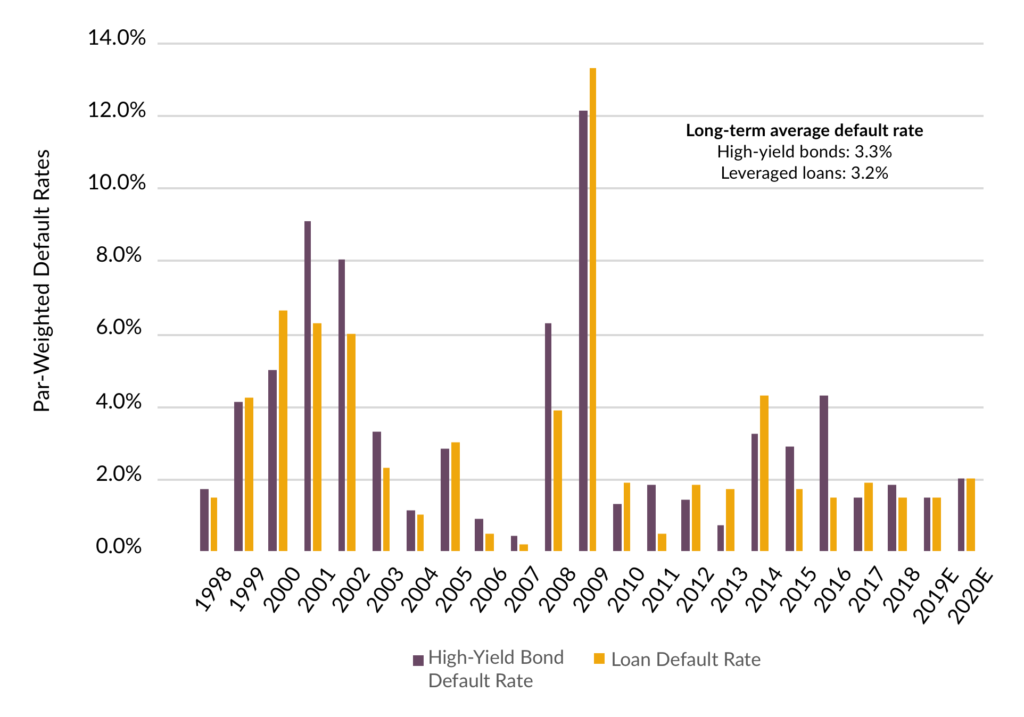
Exhibit 9: US Below Investment Grade Valuations

After a challenging start in the first quarter of last year, US High Yield ended 2020 with strong positive returns as the sector benefited from swift Fed and Monetary policy response to the pandemic, as well as investor demand for higher income alternatives. At the height of the market dislocation, broad market credit spreads widened to a peak +1082 in late March, but then subsequently tightened almost 700 basis points to end the year at +390 as liquidity and sentiment improved (ICE BofA High Yield Index H0A0 Spread to Worst). Total returns were 6.21% for US High Yield, with the higher quality BB-B rated segment performing slightly better at 6.32%, while the lowest quality CCC and lower rated issuers fared the worst at only 2.78% (ICE BofA US Cash Pay High Yield Index J0A0, ICE BofA BB-B US Cash Pay High Yield Constrained Index, ICE BofA CCC & Lower US Cash Pay High Yield Index). Syndicated Loan returns were 2.78% which lagged High Yield given their shorter duration, floating rate profile which fell out of favor as the Fed took short term rates to zero (Credit Suisse Leveraged Loan Index).
Leverage for high yield issuers moved higher during 2020 and finish the year at 5x Debt/EBITDA which compares with pre-COVID multiples near 4x (Muzinich & Co.). Liquidity improved significantly, however, as corporations rushed to raise cash in the new issue market as a precaution for a prolonged downturn. Cash to debt levels improved to almost 20% by year end which is almost double the same measure pre-COVID (Muzinich & Co.). Given the weakness experienced early in the year, the annualized default rate rose to 6.5% (Muzinich & Co.) but appears to have stabilized as there were no defaults in November and only one to report in December. In addition, credit rating upgrades now outnumber downgrades by a ratio of 1.2:1 as further evidence of improving fundamentals (Muzinich & Co.). Assuming the recovery from COVID continues, the default rate is expected to drop precipitously to an annualized rate of 2-3% by year end 2021 (Muzinich & Co.).
We expect technicals to be favorable in the coming year as demand for higher yielding instruments should persist while new issue supply is expected to be lower than 2020. While valuations appear tight with credit spreads recently falling below the long-term averages, spreads remain 50 basis points wide of the most recent lows in 2018. Opportunities in the market still exist, but we believe it’s critical to evaluate the appropriate levels of risk and reward in portfolios with an actively managed approach and disciplined underwriting process to avoid defaults.
Income has consistently been the largest component of total return for High Yield over time as the additional carry helps to offset any short term price moves. As prices have improved materially, we expect coupon to be the largest driver of returns in 2021. Given a backdrop of improving fundaments and lower defaults, we expect High Yield bonds to provide returns in the range of 4-5%. Loans have the potential for higher returns of 5-7% as the average price of Loans remains at a discount and a pull to par in prices could supplement the income return. Loans could also benefit from a recent resurgence in CLO issuance which has accounted for as much as 50% of the investor base in recent years (Muzinich & Co.). Additionally, there has been increased demand from investors seeking floating rate coupons as a hedge against the prospects of higher interest rates. Finally, as you can see in Figure 3, both US High Yield and Loans continue to offer attractive yields that can enhance the income of broad market investment grade strategies.
Exhibit 10: Fixed Income Yields per Corporate credit and Treasuries sub-segments

Convertible Securities
The asymmetric risk/return proposition offered by balanced convertibles demonstrated its worth in 2020 as Covid-19 related volatility shook financial markets. With equities tumbling 35-40% into late March, balanced convertibles experienced less than half of the decline, this including market illiquidity and gapping credit spreads that led to Fed intervention. Capital preservation at the March lows provided a strong investment base for the confluence of events that followed: 1) consistent and heavy new issuance, 2) a dramatic rally across equity markets, and 3) collapsing credit spreads. These factors helped to produce the strongest run for convertible investors in decades with Barclays Index data pegging the broad convertible market return at +89% from March 23rd through year-end (Barclays Capital convertible research)
Exhibit 11: U.S. Equities and Convertibles – Cumulative 2020 Total Return

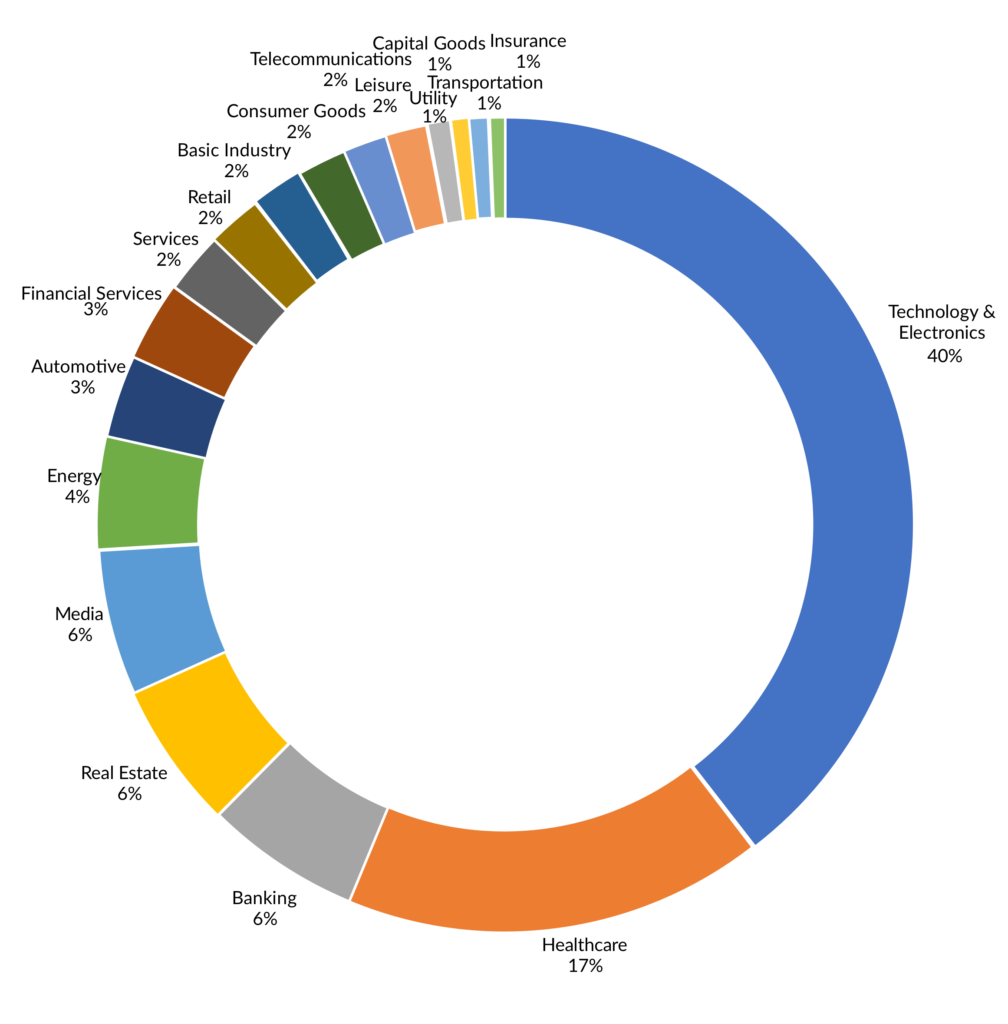
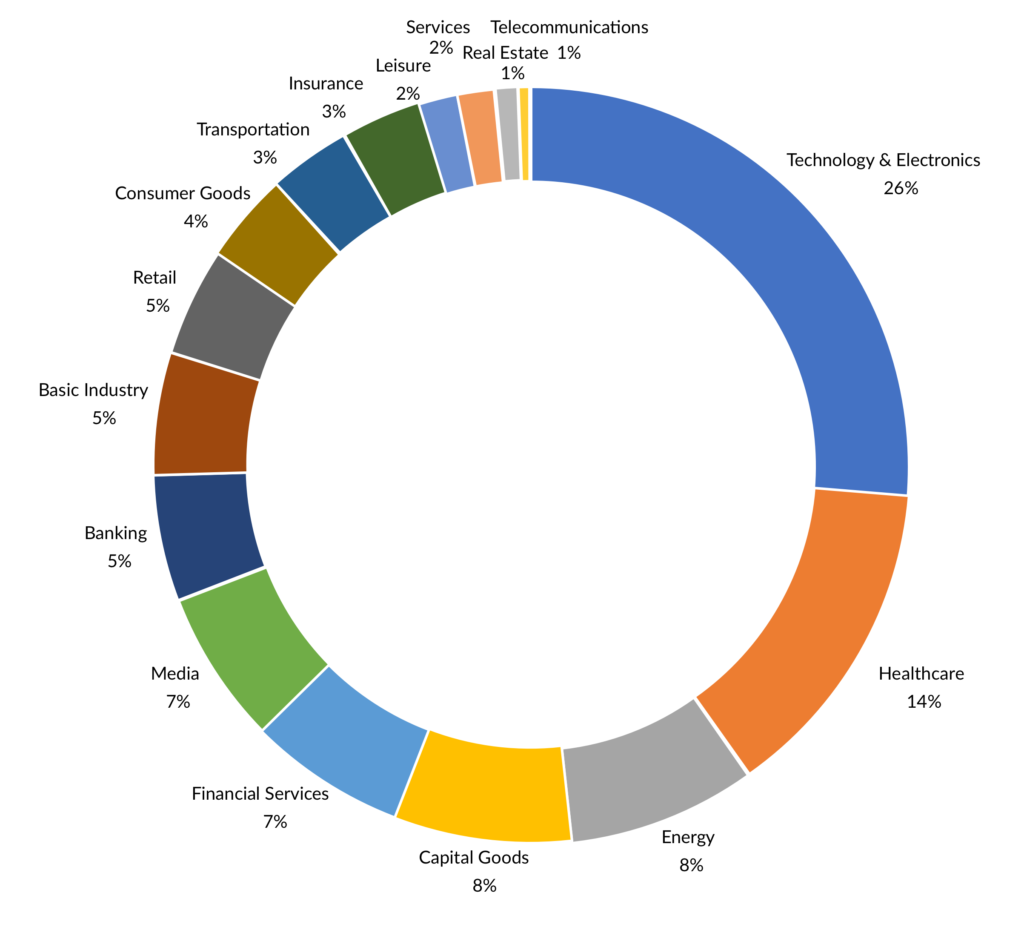
While volatility may have been the biggest story of 2020, new issue supply in U.S. convertible markets is noteworthy for the likely sustained impact it will have on the sector’s ability to deliver compelling absolute and risk-adjusted returns into the future. For the full year, 194 deals priced in the U.S. market with proceeds of nearly $115 billion (Barclays Capital convertible research) – higher than 2018 and 2019 combined. Sustained deal flow and market gains, as indicated in Exhibit 2 below, contributed to a convertible market that has increased in size by approximately 50%. While technology and healthcare sector issuers continue to lead in deal volumes, the market also provided access to capital for issuers across a wide variety of market sectors looking to raise funds or build liquidity to endure Covid-related uncertainty. Breadth of issuance and an expanded balanced opportunity set affords investors the ability to diversify risks across industries, an important factor given how far technology shares have come in recent quarters.
Exhibit 12: U.S. Convertible Market Size and Structure ($Min)

Broad measures of credit health within the convertible market are stable and improving, which is likely to provide stability to balanced sector convertibles should equity markets surprise to the downside. New deal flow is expected to continue at above average levels, yielding another year of organic growth in market size. Critically important in this market, we observe a high level of concentration risk and equity sensitivity in the market which can expose high delta investors and passive index ETF shares to significantly greater levels of volatility relative to actively managed balanced strategies. Our partners at Zazove Associates have been actively rebalancing portfolios through this rally with current portfolios well positioned with proper diversification and equity risk control.
AAM’s outlook for strong economic growth and favorable monetary and fiscal policy in 2021 bodes well for convertible returns in absolute and relative terms. Should our forecast prove accurate, corporate earnings growth will likely yield a favorable environment for equity investors, particularly in cyclically sensitive and financial segments and small/mid cap issuers. While it is difficult to imagine a repeat performance of 2020, we believe mid-to-high single digit returns in equities are achievable. In such an environment, balanced convertible models indicate returns which capture the majority of stock market gains.