• Skip to primary navigation
  • Skip to main content
  • Skip to footer
AAM CompanyTransparent Logo

AAM Company

AAM Company Website

  • Investment Strategies
    • Investment Grade Fixed Income
    • Specialty Asset Classes
  • Clients
    • Our Clients
    • Client Experience
    • Download Sample RFP
  • Insights
    • Video
    • Webinars
    • Podcasts
    • News
  • About
    • Our Team
    • Events
  • Login
  • Contact Us
Contact

Market Updates

February 13, 2017 by

Key Points:

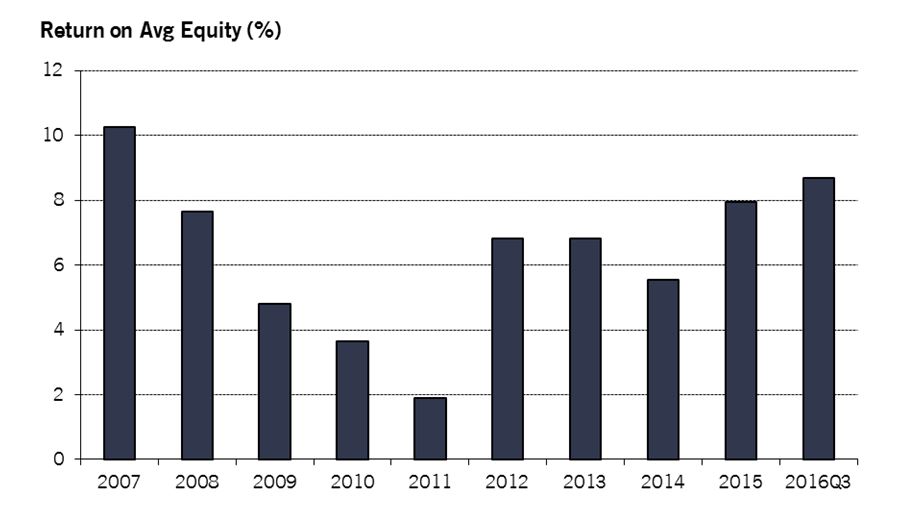
  • Profitability continues while premium growth is slowing
  • Investments yield levels appear to have found a bottom and are creeping higher
  • Equity exposures are at pre-financial crisis levels and should be examined
  • The industry faces pressure from cyber-security and the growth of the sharing economy that will challenge innovation in 2017 and beyond

AAM’s Aggregate of Commercial Multiple Peril (CMP) insurers posted strong underwriting performance through the last twelve months (LTM) ended 9/30/16, posting a second year of profitability closely in line with the results of calendar year 2015. Net Premium Written (NPW) volume grew, but at a significantly reduced rate compared to recent years. Meanwhile underwriting leverage fell modestly, though remained well within the recent historical range. On the investment side the decline in investment yields seems to have finally bottomed out, with the unfortunate implication that portfolios have been fully turned over into the low prevailing rates of recent years. Exposure to common stock investments remains at elevated levels (measured as a % of surplus), posting at the highest level since 2007. In this report we will review these and other key financial results in the US Commercial Multiple Peril market, and look ahead to important developments in the coming year.


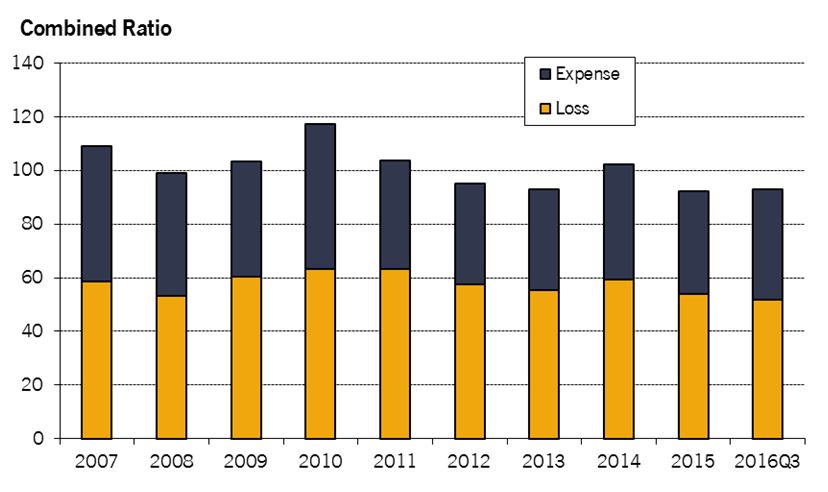
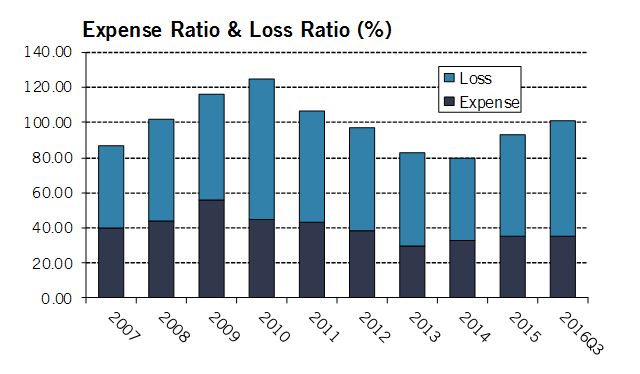
The CMP industry’s average loss ratio for the LTM period declined slightly to 51.9 versus 53.9 in 2015. Meanwhile expenses rose modestly to 41.1 from 38.3 (all income statement items in this report are on an LTM basis). This continues the trend of notable underwriting stability in the CMP market in recent years, with the modestly increased losses of 2014 attributable to a small number of companies in AAM’s aggregate experiencing outlier results. The trend of gradual but steady declines in underwriting expenses attributable to improved technology and operating efficiencies remains intact: for illustration, the average expense ratio from 2007-2009 was 46.5, versus 40.8 for the 3 most recent periods. Meanwhile the average premium retention ratio rose to 71 from 69, well within the normal historical range. Underwriting leverage fell from 73.1 to 70.2, as premium growth slowed relative to surplus.

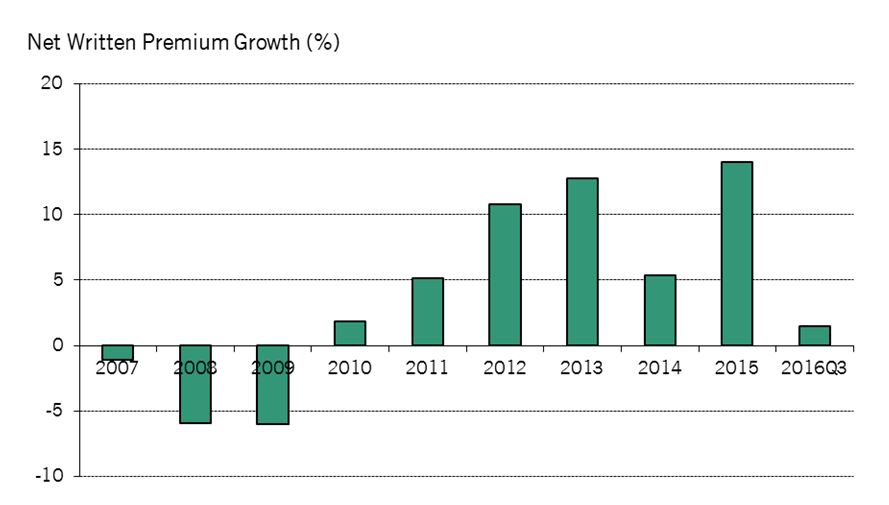
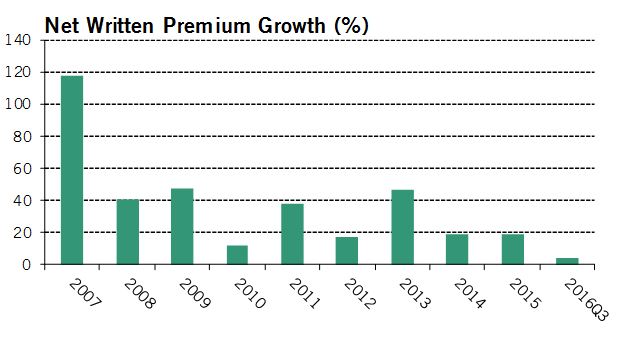
Specifically, CMP net premiums grew by only 1.5% through Q3 2016, after posting double-digit gains for 3 of the past 4 years. The primary reasons for this slowing growth appear to be a slower pace of small business formation (the NFIB’s Small Business Optimism index has been in decline since peaking in late 2014), and increased competitiveness leading to pressure on rates. As a result, the CMP industry’s total share of P&C industry premiums declined modestly from 7.1% in 2014 to 6.4% through Q3 2016.

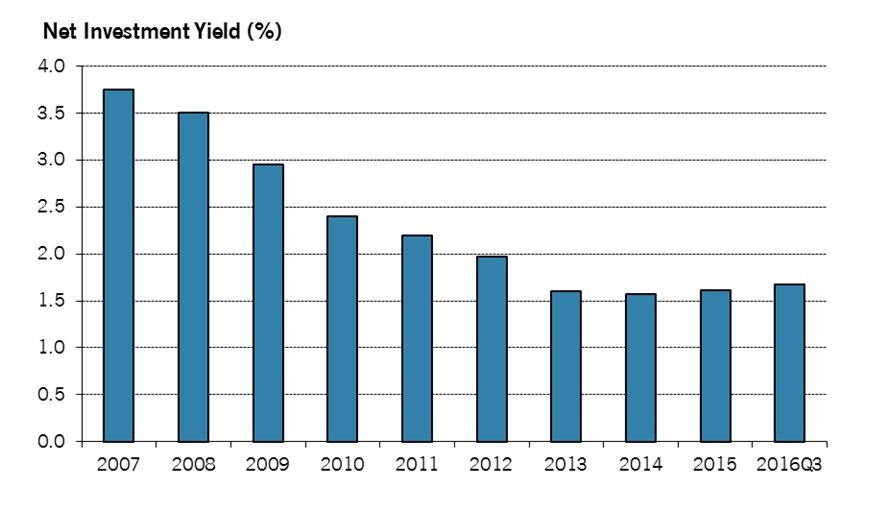
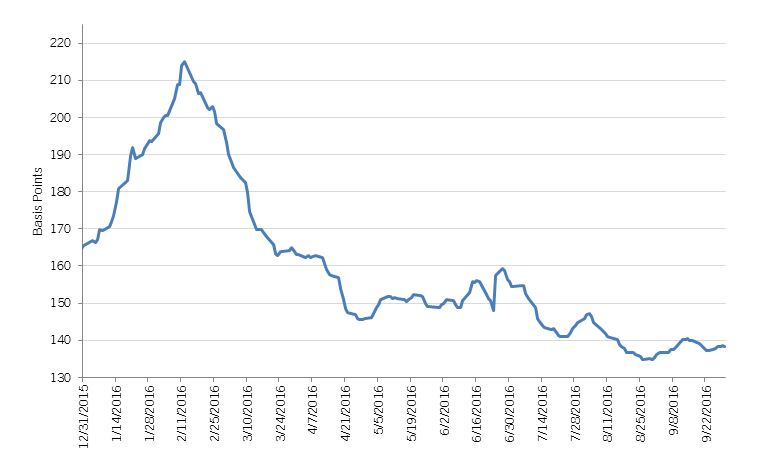
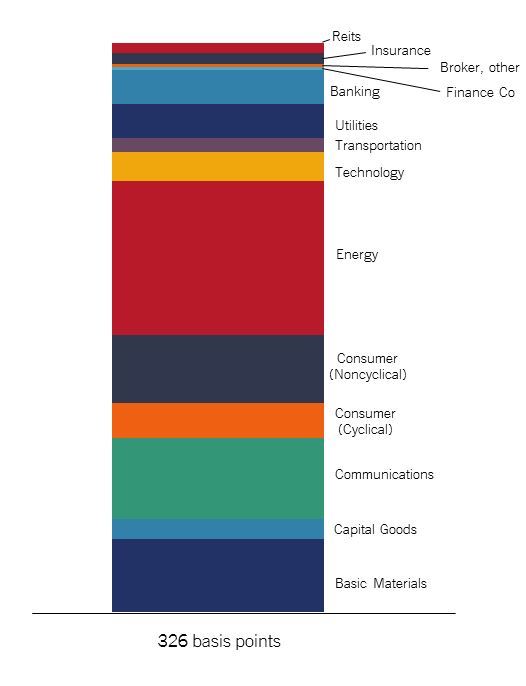
The average net yield on the CMP Aggregate’s investments increased marginally during 2016, though it remains little changed since 2013. The Aggregate’s bond portfolio remains well diversified across sectors and across the yield curve, with about 70% of bonds held maturing between 1-10yrs, suitable for a line of business that combines short-tail property claims and longer-tailed liability claims. Bond quality is strong, with a focus on NAIC 1 bonds plus a healthy 13% in NAIC 2 issues, with only minimal exposure to sub-IG issues (presumably due to downgrades rather than intentional high yield allocations, given the size of such positions). Approximately 25% of investment income comes from tax-exempt municipal bonds, in line with the broader industry and appropriate in the presence of ample underwriting income to offset AMT risk. Spreads on such bonds exploded higher after the election, and while they’ve reversed much of the move since then, the prospects for changes in corporate tax rates in 2017 suggest that more volatility lies ahead for this important investment sector.

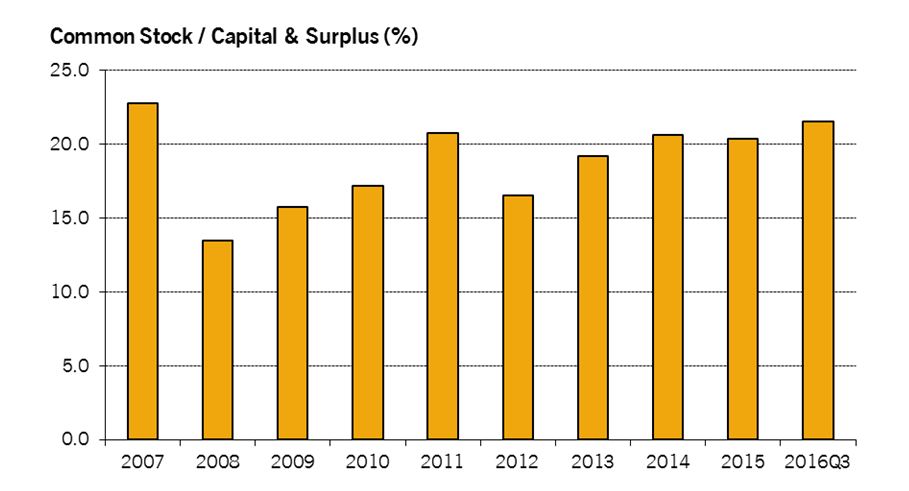
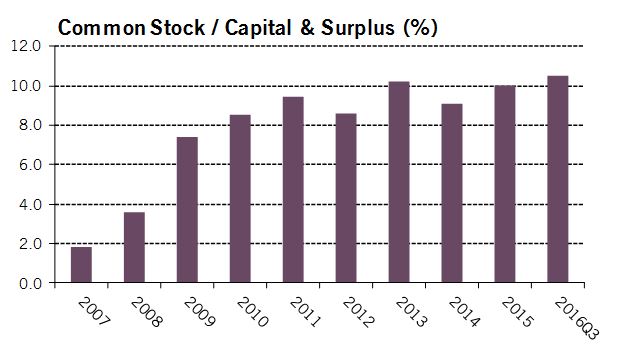
The CMP Aggregate’s exposure to unaffiliated common stock (measured as a % of surplus) grew from 20.4 to 21.6 in 2016, sustaining the creeping growth of recent years. After treading water for much of the year, equity markets rose significantly in Q4, suggesting that the year-end exposure will likely show further growth. As with the overall P&C industry, CMP insurer equity exposure is at the highest levels since before the financial crisis. While the strong performance of this market in the last 8 years has helped repair insurer balance sheets, the combination of high valuation measures and the rising interest rate environment may suggest that the low-hanging fruit has now been plucked. Insurers would be well advised to examine their equity allocations closely in coming months, and perhaps consider reducing risk through assets with downside protection like convertible bonds.

As entertaining as a review of financial statistics is, we’ll close by reviewing a few of the hot-button issues that have recently been impacting the P&C industry in general, and CMP insurers in particular.

  • Cybersecurity remains a major issue, both with respect to insurers’ own internal security measures, and the rapidly growing demand for policies to protect against cyberattacks. These include a variety of coverages, including direct liability costs for privacy breaches, business disruption, reputational damage, and cost of restoring systems and mitigating customer loss. These and other coverages are increasingly being included with standard CMP policies, though for the time being the lack of actuarial data makes underwriting challenging. This also makes it a potentially attractive opportunity for insurers able to effectively assess and manage cyber risk and promote best practices among their insureds. In 2015 the NAIC begin collecting data on cybersecurity policies through a supplement to the annual statement, so over time it will become possible to track the growth and development of this sector.
  • The growth of the “sharing economy” has created entire new markets for insurers, though the legal and regulatory status of these markets remains murky in many jurisdictions. For example, the rise of “ride-sharing” services like Uber and Lyft gave rise to accidents that were not covered by either the driver’s personal auto insurance (due to livery exclusions) or the limited coverage provided by Uber itself. This led to the creation of a new model law to promote policy designs that would enable such services to operate with comprehensive coverage. Comparable policies to cover rentals of private apartment space, office space, tools, and machinery could all potentially overlap with existing CMP product designs. As the line between personal and commercial property blurs, there is likely to be heated competition between these two halves of the insurance industry to capture the resulting opportunities.
  •  In 2017 AM Best plans to roll out a major overhaul to its Financial Strength Rating and Best’s Capital Adequacy Rating systems. Key changes will include the use of sophisticated dynamic financial modeling to determine required capital factors for a variety of balance sheet items, and the use of 5 BCAR scores corresponding to different statistical confidence intervals instead of the single score previously provided to rated companies. Scores will also be re-scaled so that a score greater than 0 corresponds to a surplus of required capital, and a negative score implies a deficit. Best has announced that they do expect significant ratings changes as a result of this new policy, and that the goal is greater transparency and utility rather than to correct any perceived inaccuracies in the current system.

AAM will continue to monitor important industry developments and provide timely updates, in keeping with our mission of providing customized and cutting-edge investment services to the insurance industry.

Note: All financial data sourced from SNL. AAM’s Commercial Multiple Peril Aggregate consists of 25 US insurers writing all or mostly CMP business for the past 5 calendar years.


Written by:


PeterAWirtala
Peter Wirtala, CFA
Insurance Strategist 


Disclaimer: Asset Allocation & Management Company, LLC (AAM) is an investment adviser registered with the Securities and Exchange Commission, specializing in fixed-income asset management services for insurance companies. Registration does not imply a certain level of skill or training. This information was developed using publicly available information, internally developed data and outside sources believed to be reliable.  While all reasonable care has been taken to ensure that the facts stated and the opinions given are accurate, complete and reasonable, liability is expressly disclaimed by AAM and any affiliates (collectively known as “AAM”), and their representative officers and employees.  This report has been prepared for informational purposes only and does not purport to represent a complete analysis of any security, company or industry discussed. Any opinions and/or recommendations expressed are subject to change without notice and should be considered only as part of a diversified portfolio. A complete list of investment recommendations made during the past year is available upon request. Past performance is not an indication of future returns. This information is distributed to recipients including AAM, any of which may have acted on the basis of the information, or may have an ownership interest in securities to which the information relates.  It may also be distributed to clients of AAM, as well as to other recipients with whom no such client relationship exists.  Providing this information does not, in and of itself, constitute a recommendation by AAM, nor does it imply that the purchase or sale of any security is suitable for the recipient. Investing in the bond market is subject to certain risks including market, interest-rate, issuer, credit, inflation, liquidity, valuation, volatility, prepayment and extension. No part of this material may be reproduced in any form, or referred to in any other publication, without express written permission.

February 2, 2017 by

AAM’s Florida Homeowners Aggregate (“FHA”) experienced a moderate increase in catastrophe-related underwriting losses during 2016, resulting in a Last Twelve Months (LTM) combined ratio exceeding 100 for the first time since 2011. Total premium volume continued to grow, but at a significantly reduced rate compared to recent years. Meanwhile, underwriting leverage reversed its recent downward trend, posting the highest level since the 2013 peak. On the investment side the decline in investment yields seems to have finally bottomed out, with the unfortunate implication that portfolios have been fully turned over into the low prevailing rates of recent years. Exposure to common stock investments remain at record high levels (measured as a % of surplus), while cash holdings remain at a relatively low 21% of invested assets, down from 46% as recently as 2012. In this report we will review these and other developments in the Florida homeowners market, and look ahead to important developments in the coming year.

The FHA’s average loss ratio rose from 57.8 in 2015 to 66.0 for the LTM period ended 9/30/16 (all income statement items in this report are on an LTM basis, to compensate for significant seasonality effects present in this market). The first three quarters saw a modest increase in catastrophe losses, though expenses were largely flat. These figures do include the effects of Hurricane Hermine (the first hurricane to make landfall in Florida since Wilma in 2005), but exclude the impact of Hurricane Matthew, which struck the southeastern US in October and was the twelfth costliest storm ever in that region per National Oceanic and Atmospheric Administration (NOAA) calculations. Fortunately, Matthew ultimately caused much lower losses than initially feared and makes a good field test for the reinsurance and risk management programs of the many FL homeowner start-ups that have emerged in the past 10 years. Unfortunately, it will also likely lead to increased assignment-of-benefits activity, pending legislative relief for this ongoing issue in the Florida market. Between the effects of Matthew and the possibility of unfavorable reserve development in Q4, it appears that the recent era of relatively benign loss activity may finally be drawing to a close.

Premium growth declined for the LTM period, coming in at just 4.5% after consistently posting double-digit growth for many years. Although start-up activity remains robust as Citizens continues to shed premium, competition has intensified and placed downward pressure on prices in some markets. Meanwhile, the aforementioned assignment-of-benefits controversy has had a chilling effect on impacted markets, as private insurers grow wary of opening themselves up to lawsuits from contractors for denial of claims. Citizens’ CEO Barry Gilway commented in a September interview with the Sun-Sentinel that “Markets are shutting down in South Florida. New business has no place to go but us (sic). It would not be a smart decision on the part of a CEO to pick up South Florida business until we’ve got legislative remedies for [assignment of benefits].”

Anecdotal evidence also suggests that this practice is spreading into other parts of the state, suggesting that further declines in the rate of premium growth may be in the cards if nothing is done. This topic remains hotly contested between insurers and the litigators filing claims against them, and is likely to be examined by the Florida legislature during the upcoming session. Meanwhile the FHA’s retention ratio remained flat at about 48% of gross premium, virtually unchanged from the level of the past 3 years. Reinsurance pricing has been heavily pressured by the low claims activity of the last several years, and if 2016’s increased losses reverse this situation, it may create incentives for insurers to re-assess their reinsurance programs accordingly.

The average net yield on the FHA’s investments increased marginally during 2016, though the overall level remains largely flat since 2010. This reflects the impact of the FHA’s relatively short-duration bond investments (~70% of holdings in maturities of 5 years or less) and high cash holdings, both driven by a need for ready liquidity in case of sudden uptick in claims. Although it is welcome to see investment yields stable rather than declining, this is largely due to the fact that older investments predating the post-crisis low rate environment have mostly rolled off of insurers’ books, suggesting that even when rates do increase it will take a period of years for portfolio yields to fully adjust as lower-yielding bonds roll off. The rise in rates in late 2016—driven by expected higher inflation and the possibility of multiple Fed rate hikes in 2017—brought some relief, but also reduces the liquidity of existing holdings by moving bonds into an unrealized loss position.

With all that said, bond portfolios are in general prudently invested, with broad diversification across sectors, and duration and quality buckets. Exposure to tax-exempt municipal bonds have grown, with tax-exempt income growing from 6.9% of investment income in 2011 to 14.9% in 2015. Spreads on such bonds exploded higher after the election, and while they’ve reversed much of the move since then, the prospects for changes in corporate tax rates in 2017 suggest that more volatility lies ahead for this important investment sector.

The FHA’s average exposure to unaffiliated common stock investments rose slightly through 9/30 to 10.5%, the highest in recent years. While lower than the overall industry average, this is in keeping with the P&C industry trend towards increased equity exposure.  The strong stock market returns since 2008 have greatly benefited insurers and helped to replace surplus lost in the financial crisis, though the combination of Fed rate hikes, a volatile political environment, and elevated valuation measures suggest that downside risks may finally be lurking below the surface after the seemingly unstoppable rally from the 2009 lows.

Although common stocks are the most common risk asset type held by P&C insurers, Florida homeowners companies prudently hold only about one-third of the exposure of the broader industry, as the elevated risk of concentrated underwriting losses in catastrophe lines is best offset by reduced exposure to relatively volatile investment categories. Conversely, FHA companies hold significant amounts of cash on hand for ready liquidity, with 9/30 exposure little changed at just over 20%. This figure has dropped significantly in recent years, from over 60% in 2007 to the current level. Reasons for such a reduction include improved risk and liquidity management programs, increased participation in the Federal Home Loan Bank (FHLB) system for short-term cash needs, and an attempt to increase investment income and offset low yields by putting idle cash to work during periods of low loss activity.

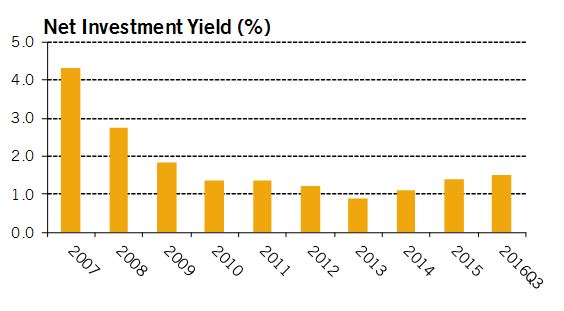
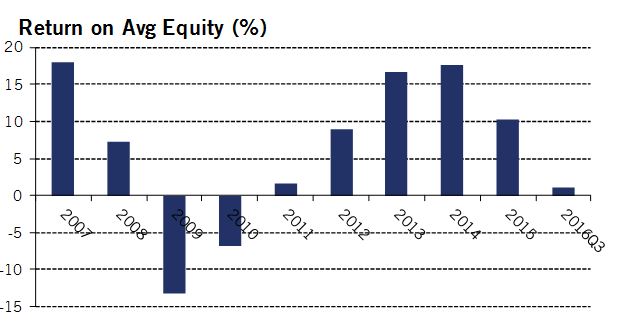
Between unfavorable loss experience and the ongoing low level of investment yields, the FHA achieved a return on equity of just over 1% for the LTM period through 9/30/16. Additional underwriting losses in Q4 may push this figure below zero for the calendar year, though strong equity market returns may partially offset such losses. The period from 2012-2015 was very strong for this industry, thanks to modest storm activity and a booming stock market. Now it appears these tailwinds are fading, and challenges like the assignment-of-benefits controversy and increased pricing pressure from the influx of market entrants could mean a period of lean years lie ahead.

As always, a customized, diversified, and prudently balanced investment strategy is key to both supporting profitable underwriting through stable, predictable interest income, while also growing long-term surplus through strategic allocations to non-core asset classes. AAM has extensive experience advising Florida homeowners insurers on every aspect of investment strategy, and are available to provide a variety of complimentary analyses to companies interested in finding ways to refine and sharpen their portfolios.

AAM’s Florida Homeowners Aggregate is a collection of 28 Florida-domiciled P&C insurers writing primarily Homeowners coverage in the US Southeast region. All financial statement data is sourced from SNL.


Written by:

Peter Wirtala, CFA Insurance Strategist


Disclaimer: Asset Allocation & Management Company, LLC (AAM) is an investment adviser registered with the Securities and Exchange Commission, specializing in fixed-income asset management services for insurance companies. Registration does not imply a certain level of skill or training. This information was developed using publicly available information, internally developed data and outside sources believed to be reliable.  While all reasonable care has been taken to ensure that the facts stated and the opinions given are accurate, complete and reasonable, liability is expressly disclaimed by AAM and any affiliates (collectively known as “AAM”), and their representative officers and employees.  This report has been prepared for informational purposes only and does not purport to represent a complete analysis of any security, company or industry discussed. Any opinions and/or recommendations expressed are subject to change without notice and should be considered only as part of a diversified portfolio. A complete list of investment recommendations made during the past year is available upon request. Past performance is not an indication of future returns. This information is distributed to recipients including AAM, any of which may have acted on the basis of the information, or may have an ownership interest in securities to which the information relates.  It may also be distributed to clients of AAM, as well as to other recipients with whom no such client relationship exists.  Providing this information does not, in and of itself, constitute a recommendation by AAM, nor does it imply that the purchase or sale of any security is suitable for the recipient. Investing in the bond market is subject to certain risks including market, interest-rate, issuer, credit, inflation, liquidity, valuation, volatility, prepayment and extension. No part of this material may be reproduced in any form, or referred to in any other publication, without express written permission.

January 26, 2017 by

[toc]

AAM continues to monitor important regulatory changes affecting the insurance industry. Below we summarize recent developments on policies currently facing significant changes:

NAIC RBC Changes

The NAIC had their latest meeting in December and discussed the status of their plan to increase the number of ratings categories for bonds for RBC calculation purposes. Here are some highlights:

  • After many months of discussion, there does now appear to be a consensus that the granularity of Life bond RBC factors will increase, in the form of an electronic-only column added to Schedule D
  • The specific factors to be used are still subject to revision, but are likely to be broadly in line with those proposed by the American Academy of Actuaries
  • It is likely (though still not finalized) that the increased granularity will also be applied to P&C and Health insurers, though they may have somewhat different factors
  • Beyond the change in factors, the second step in determining bond RBC involves an adjustment based on the number of bonds/issuers in the portfolio. The details of this second step are also being reviewed, and are likely to be changed from the current form to more accurately reflect the impact of diversification on risk of credit losses
  • The NAIC is still targeting year-end 2017 to implement the changes, though some in the industry view this as ambitious
  • The ACLI proposed a materially different (mostly lower) set of expanded factors based on a study they did of historical default and recovery rates, including a recommendation to provide different factors for different bond types (e.g. corporate, muni, etc). This will be reviewed and discussed in future meetings

AM Best BCAR

In November AM Best released their intended adjustments to the BCAR formula for P&C companies. These were largely in line with those described for Life companies earlier in the year (using factors based on DFA modeling, reporting 5 BCAR scores based on confidence intervals instead of a single one, removing the suggested guidance for BCAR vs rating, etc). They intend to collect comments on this release over the winter, make any additional needed adjustments over the summer, and start implementing the new system in late 2017. The bottom line continues to be that in general they do not expect this new process to change existing ratings, though rare exceptions may exist. One notable investment-related feature of the new system is that bond ratings will now be based on a mix of rating and maturity bucket instead of rating alone, though we continue to believe that the most important BCAR contribution of an investment portfolio is through losses of surplus (if any), not the direct impact of the factors themselves.

Tax Reform

It is fairly likely that a federal tax reform bill will be passed in 2017. The single likeliest feature of such a bill is a reduction in corporate rates, and elimination of the AMT is also a possibility. This has already caused some volatility in the muni market, and will likely cause more in the future. We do not recommend accelerating realization of gains/losses as mechanisms exist to carry gains back to previous years anyway, even if 2017’s tax rates decline. We expect to learn more about the shape of this proposal shortly and will provide commentary at that time.

Schedule D Treatment of ETFs

In past NAIC meetings there was debate about the possibility of breaking ETF holdings out into a separate schedule in financial statements, with a field designating the underlying security type. This was resisted as insurers prefer to be able to keep reporting approved bond ETF’s in Schedule D. As a compromise, the current proposal is to show bond ETF’s as a separate bond subgroup on Schedule D. Relatedly, there has been debate about what book value should be for such ETF’s. Both historical cost and market value are viewed as inappropriate. The prevailing proposal is to use a measure called “systematic value”, which may entail somewhat complex calculations. Blackrock has released a paper offering a suggested form of this calculation, but it is possible that the standard could ultimately vary somewhat from state to state. This project is ongoing but could ultimately see adoption in 2017 or 2018.

Somewhat relatedly, a proposal has been made to institute an abbreviated and electronic-only collection of holdings data at mid-year (currently holdings data is only collected at year-end, with trades reported quarterly). This also appears to be acceptable to the industry and likely to be implemented within a year or two. In AAM’s view this will be very helpful for providing up-to-date industry and peer analytics.

Principles-Based Reserving

Although AAM is primarily focused on regulations with direct investment implications, this one is worth noting here given how significant and long-awaited it’s been. Briefly, this is a regulatory change going into effect in 2017 that will allow life insurers broader discretion in how they calculate reserves for life lines (over time the new rules will be extended to cover other lines), in contrast to the current formulaic approach. Among the various goals of the change is to remove the incentives for complex life reinsurance (“XXX/AXXX”) transactions, which were undertaken due to previous formulaic reserving requirements being viewed as punitive by insurers, but also tended to make the industry more opaque and challenging to regulate. Additionally, the greater flexibility of the new rules should make it easier to accommodate new product designs without needing to constantly alter state laws. This change is probably most material for very large life insurers, but over time will likely impact virtually the entire industry.

Solvency II

This is the recently-implemented European insurer risk-based capital regulation, somewhat comparable to NAIC RBC in the US. While we mainly focus on domestic regulation, we mention this here because the Federal Insurance Office announced in September that the US does not intend to modify our own regulation to be able to apply for Solvency II “equivalence” (which, for example, Bermuda has done), putting speculation to rest on this issue. While US and EU insurance regulation may still converge over time, this will only be to the extent that regulators in each country view it as best for their own domestic jurisdiction. That said, in January the US and EU reached an accord on several key areas of insurance regulation, including ending “local presence” requirements for insurers operating outside their home country, and a reduction in collateral requirements for reinsurers conducting cross-border transactions.


Written by:
PeterAWirtala
Peter Wirtala, CFA
Insurance Strategist


Disclaimer: Asset Allocation & Management Company, LLC (AAM) is an investment adviser registered with the Securities and Exchange Commission, specializing in fixed-income asset management services for insurance companies. Registration does not imply a certain level of skill or training.  This information was developed using publicly available information, internally developed data and outside sources believed to be reliable. While all reasonable care has been taken to ensure that the facts stated and the opinions given are accurate, complete and reasonable, liability is expressly disclaimed by AAM and any affiliates (collectively known as “AAM”), and their representative officers and employees. This report has been prepared for informational purposes only and does not purport to represent a complete analysis of any security, company or industry discussed. Any opinions and/or recommendations expressed are subject to change without notice and should be considered only as part of a diversified portfolio. A complete list of investment recommendations made during the past year is available upon request. Past performance is not an indication of future returns.

This information is distributed to recipients including AAM, any of which may have acted on the basis of the information, or may have an ownership interest in securities to which the information relates. It may also be distributed to clients of AAM, as well as to other recipients with whom no such client relationship exists. Providing this information does not, in and of itself, constitute a recommendation by AAM, nor does it imply that the purchase or sale of any security is suitable for the recipient. Investing in the bond market is subject to certain risks including market, interest-rate, issuer, credit, inflation, liquidity, valuation, volatility, prepayment and extension. No part of this material may be reproduced in any form, or referred to in any other publication, without express written permission.

December 8, 2016 by

how do you watch tv?

By Elizabeth Henderson, CFA
Director of Corporate Credit

Last week, AT&T launched its long awaited video product, DirecTV Now. This service allows people in the U.S. to watch network television anywhere, anytime using an internet or mobile connection vs. traditional cable or satellite service. The promotion is very attractive, offering over 60 channels for $35/month.  If you pre-pay for three months, AT&T will send you a 4th generation Apple TV box ($139 value), allowing you to watch the service on your  television.  It includes all the popular channels except for CBS and NFL Sunday Ticket (however, we expect both to be available next year). The user interface is easy to use, the picture quality is very good, and from our initial testing (using an iPhone), the latency and reliability is similar if not better than other over-the-top services (NFLX, MLB Network).  Not only is the price attractive versus traditional cable offerings as well as competing products such as Sling, AT&T is allowing its mobile customers to stream the video without counting against their monthly data allowance.

This is the first potential real disruptor to the traditional video bundle. While it is not at the same quality as traditional video service, it is considerably cheaper and mobile.  We are reminded of the quality of service differences of mobile phones and landlines years ago, with mobile subscribers sacrificing quality for flexibility .  AT&T believes video is moving to mobile just like voice did decades ago.  As mobile networks get better, the quality of service should improve.  Verizon and AT&T are aggressively working to upgrade to 5G wireless networks so that mobile customers have access to 1 gigabit per second (Gbps) speeds, which is similar to fiber network speeds today.  This will also enable connected cars and other devices.  That said, AT&T is not waiting for a better network to launch this product.  They realize that younger audiences are not watching as much traditional television, as viewing options and habits are changing, and many believe that trend will continue.

Exhibit 1: Generational TV Viewing

Source: Barb, Nielsen

What are the implications to the industry? We believe there is a movement away from traditional cable/satellite television and believe in the merits of a mobile, internet based product.

The “winners” are:

  • Wireless providers such as AT&T and Verizon that have the financial capacity to be a first mover in 5G as well as having the scale (operating and financial) to offer mobile video to consumers. Verizon has the ability to craft a similar package as DirecTV Now since it has relationships with media companies given its FiOS product. Verizon has also been acquiring firms to offer a more unique video solution. Will this push Comcast to buy a mobile company or spectrum? We think so.
  • Media companies with solid programming such as Time Warner, 21st Century Fox, Disney and most likely CBS. Their distribution could increase after falling over the last three years. They should have access to a larger number of subscribers, given that a lower price point may entice younger viewers to pay for something other than just Netflix, for example. Over 20 million US consumers do not pay or pay very little for cable television today. According to a survey by UBS1, over 70% stated they would be interested in an internet pay TV service. The primary reasons were cost (cheaper than traditional cable) and mobility. With Netflix, Amazon and other subscription based providers creating their own programming, creating content for television has gotten more competitive. We believe this creates a barrier to entry, as larger firms especially those with studios can compete while smaller ones cannot.

The “losers” are:

  • Smaller wireless providers including Sprint, T-Mobile and perhaps resellers like TracFone that lack the ability to offer mobile video either because of financial constraints (i.e., AT&T is likely losing money on its low priced DirecTV Now offering) or the lack of operating scale (no relationships with media companies, fewer subscribers which make it more expensive). As well, this removes the advantage Sprint and T-Mobile had by offering unlimited data. This was attractive to users that wanted to stream video, and now, with DirecTV Now streaming for free and Netflix allowing subscribers to download programming, this advantage is minimized.
  • Cable operators which have earned economic rents for years under the traditional bundle. We are concerned for pure-play cable companies because they will need to upgrade their networks to be competitive in a 5G world, have a first class user interface (no more clunky cable box!), and lower the pricing on their products. While they should be able to demand a higher price because of the quality of service, they will need to pay media companies for the right to offer the same level of service to their customers using mobile devices.  While some analysts are positive on the prospect of cable companies only providing the broadband connection vs. cable television, we would highlight the different capital structure that should accompany that business model.  With a smaller, cash generative business, we would not expect management teams to prioritize investment grade ratings.  Companies in this category include Time Warner Cable, Cox Communications, Dish Network, and Comcast but to a lesser extent given its ownership of NBC and its X1 platform.
  • Media networks that lack the scale of their larger peers will find it more difficult to maintain the same level of economics given the shift from linear to binge watching.  This affects the demand for their programming and then the money they receive from cable/satellite providers and advertisers.  These cable networks include Scripps, Discovery, AMC Networks and Viacom (see graph below that shows the steep decline in traditional kids programming) as well as much smaller ones  such as Hallmark Channel.  The new user interface will help direct the viewer to programming or offer the opportunity to watch an entire season over a shorter period of time instead of a guide that limits one to what is available at that particular time.  This has been the trend, and we expect it to accelerate.

Exhibit 2: Linear Programming
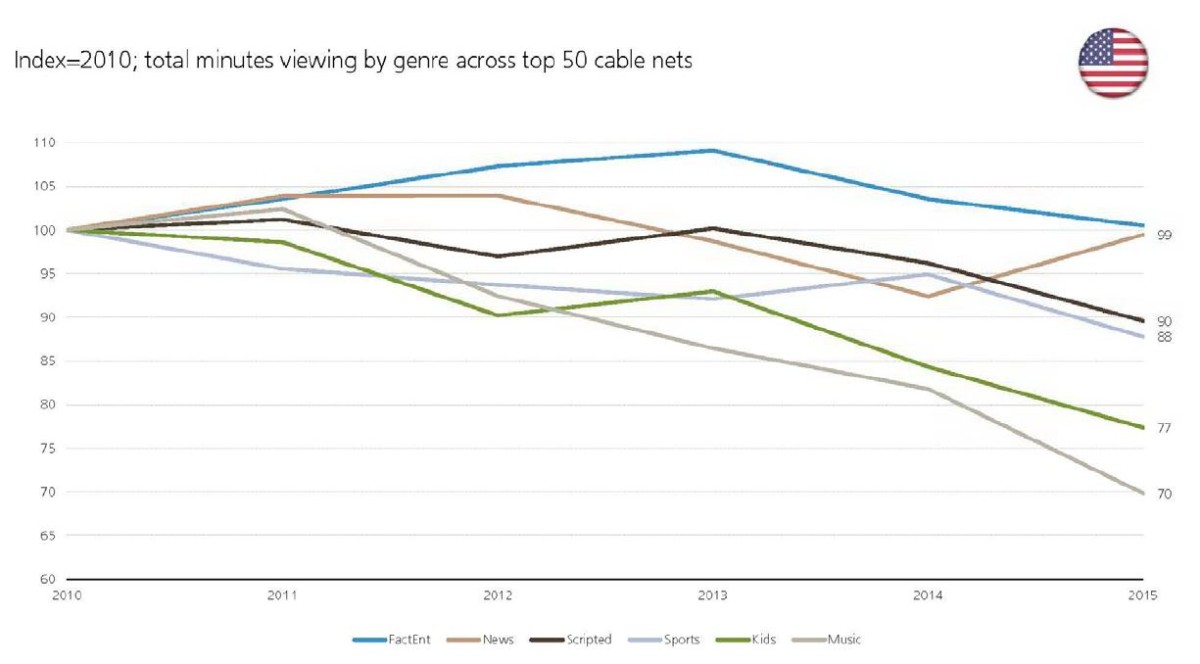
Source: UBS, Nielsen; Top 50 channels includes 12 factual entertainment networks (e.g., Discovery, History); 18 scripted networks (e.g., AMC, FX, USA, TBS); 7 kids networks (e.g., Nickelodeon, Disney Channel); 4 news networks; 3 sports networks; 2 music networks.

It’s harder to produce great programming because of the cost associated with it, as demand has increased by Netflix, Amazon and others for original programming.  As fewer people watch programming that is “mediocre,” the premium paid by advertisers as well as cable/satellite providers to carry the network should decrease.  Advertisers will have the ability to target a person instead of a group of people.  In other words, advertising is moving from being able to target a group of individuals like those that watch Food Network to an individual based on the location and activity on one’s mobile device (Exhibit 3).  This allows advertising to become more successful in a mobile environment.  Will this advertising dollar be taken from the media networks or at least shared by the platform or mobile provider?  Will this direct relationship with the customer push Disney to buy Netflix?  We believe the burgeoning importance of the platform will be the catalyst for major acquisitions in 2017.

Exhibit 3: The Lifecycle of Targeted Advertising

graph-3Source: AAM

  • Sports teams and networks have benefited from skyrocketing sports rights values.  The rights to view sports programming have increased in value at a 2-3 times multiple in the past ten years.  This was because of the increased use of time shifted programming (e.g., DVRs), causing commercial skipping.  Since most people watch sports live, it increased the value of the advertising slots.  However, this programming is the most expensive to carry, and if we start to see a real shift towards packages that allow people to customize, and/or cable/satellite providers get more selective with what they want to carry, it should negatively affect the distribution and overall value of this programming.  Networks with long term rights agreements that are unable to change the economics of the agreements will likely be losers.  However, we believe if the value of sports programming materially falls, the major networks like Fox will seek to renegotiate so they pay fair value.  The teams may have no choice but to negotiate in order to avoid the risk of the network defaulting on the agreements.

Exhibit 4:  Sports Rights Values

graph-4Source: Liberty Media
1 Excludes values of international media rights contracts, 2 Excludes value of Thursday Night Football and Sunday Ticket

We are just beginning to see real change in this sector, and expect investors will start to differentiate between the winners and losers in 2017.

Written By:
Elizabeth Henderson, CFA

1UBS, Doug Mitchelson, “Will 2017 be the year of Internet Pay TV?  UBS Evidence Lab survey indicates robust demand”, 9/20/2016 


Disclaimer: Asset Allocation & Management Company, LLC (AAM) is an investment adviser registered with the Securities and Exchange Commission, specializing in fixed-income asset management services for insurance companies. This information was developed using publicly available information, internally developed data and outside sources believed to be reliable. While all reasonable care has been taken to ensure that the facts stated and the opinions given are accurate, complete and reasonable, liability is expressly disclaimed by AAM and any affiliates (collectively known as “AAM”), and their representative officers and employees. This report has been prepared for informational purposes only and does not purport to represent a complete analysis of any security, company or industry discussed. Any opinions and/or recommendations expressed are subject to change without notice and should be considered only as part of a diversified portfolio. A complete list of investment recommendations made during the past year is available upon request. Past performance is not an indication of future returns.

This information is distributed to recipients including AAM, any of which may have acted on the basis of the information, or may have an ownership interest in securities to which the information relates. It may also be distributed to clients of AAM, as well as to other recipients with whom no such client relationship exists. Providing this information does not, in and of itself, constitute a recommendation by AAM, nor does it imply that the purchase or sale of any security is suitable for the recipient. Investing in the bond market is subject to certain risks including market, interest-rate, issuer, credit, inflation, liquidity, valuation, volatility, prepayment and extension. No part of this material may be reproduced in any form, or referred to in any other publication, without express written permission.

October 25, 2016 by

Given our outlook and the currently attractive relative valuation levels, we are moving to an overweight bias for the municipal sector.

Supply technicals were expected to drive volatility in relative valuations this year, and so far, that’s played out in the second half of the year. With 10-yr Treasury rates plunging at the beginning of the 3rd quarter to 1.36% following Britain’s decision to leave the European Union, munis followed suit, with rates moving to a record low of 1.29%. These low nominal yields have induced state and local governments to execute refinancings to levels that are running in tandem with 2015’s record level of issuance. The surge in refinancings during the quarter helped produce record levels of issuance in August and September, resulting in yields rising across the yield curve. Tax-exempt yields in 10-yrs moved higher by 16 basis points (bps) versus a 12 bps move in Treasuries. The long-end of the municipal curve exhibited the worst performance, with yields in 20 and 30-yrs increasing by 27 and 29 bps, respectively. Treasury rates in 30-yrs were higher by only 3 bps.

The front end of the muni yield curve also faced poor performance as the market adjusted to the new regulations surrounding money market reform. New standards that went into effect on October 14th now require that money market funds sold to institutions move to a floating valuation and adopt restrictions that limit investor withdrawal access if the fund’s liquidity falls below certain levels. These reform measures have resulted in year-to-date municipal money market fund outflows of $126 billion as of October 19th.

Consequently, relative valuations of bonds with maturities from 1 to 3-yrs have moved to some of the most attractive levels the market has experienced in over three years. Since August 29th, tax-adjusted spreads for these maturities moved wider by 39, 49 and 44 bps in 1, 2, and 3-yrs, respectively. These adjustments in spread levels have moved our relative valuation bias to a neutral position for this area of the curve from a negative bias that was in place during the first 9 months of the year.

Similarly, the balance of the yield curve is also facing significantly weaker relative valuation levels resulting from weaker technicals. Mutual fund flows, which were experiencing very strong weekly inflows through September with an average of ~$700 million per week, have now moved to outflows of $136 million as of October 19th.

Additionally, seasonal reinvestment flows for coupons/calls/maturities are also near lows for the year during October and November. The drop in demand flows, combined with the recent surge in new issuance, has produced substantial curve steepening pressure. The slope of the yield curve from 5 to 20-yrs has steepened by 13 bps since August 29th and tax-adjusted spreads in 15 and 20-yrs have widened by 43 and 41 bps, respectively, providing that area of the curve with a very compelling entry point for investment.

In looking at the supply outlook for the year, the market is expecting the sector to produce a new record of $445 billion. Both August and September have already reached record levels for their months, with issuance of $45 billion and $35.6 billion, respectively. The market also expects that October and November could approach record levels of over $50 billion per month. Consequently, key relative valuation metrics of municipal/Treasury ratios and tax-adjusted yield spreads to Treasuries have adjusted to near 6-month highs as of this writing.

Looking forward, we expect to see a dramatic slowdown in issuance going into December. In a comparable fashion to the issuance cycle that developed during the latter portion of 2015, it’s expected that state and local governments will curtail issuance, especially rate-sensitive refinancings, to avoid any potential market volatility surrounding the Federal Reserve’s next rate increase. Going into potential Federal Reserve rate hikes in September and December last year, new issuance supply plunged 24% during the last 6 months of the year. Similarly, with the market consensus of at least one rate hike for the balance of this year, the market projects issuance in December this year to decline by 33% relative to the average expected monthly issuance of $41 billion from August to November. This dramatic drop in issuance, combined with the anticipated improvement in demand technicals from robust reinvestment flows of coupon/calls/maturities in December and January, should produce solid muni relative performance going into the new year. Given our outlook and the currently attractive relative valuation levels, we are moving to an overweight bias for the municipal sector. Our objective will be to gradually build up our sector exposure level into the projected supply surge and to further extend our overweight exposure if further dislocations in relative valuations develop.

Written by:
GregoryABell
Greg Bell, CFA
Director of Municipal Products

Disclaimer: Asset Allocation & Management Company, LLC (AAM) is an investment adviser registered with the Securities and Exchange Commission, specializing in fixed-income asset management services for insurance companies. This information was developed using publicly available information, internally developed data and outside sources believed to be reliable. While all reasonable care has been taken to ensure that the facts stated and the opinions given are accurate, complete and reasonable, liability is expressly disclaimed by AAM and any affiliates (collectively known as “AAM”), and their representative officers and employees. This report has been prepared for informational purposes only and does not purport to represent a complete analysis of any security, company or industry discussed. Any opinions and/or recommendations expressed are subject to change without notice and should be considered only as part of a diversified portfolio. A complete list of investment recommendations made during the past year is available upon request. Past performance is not an indication of future returns.

This information is distributed to recipients including AAM, any of which may have acted on the basis of the information, or may have an ownership interest in securities to which the information relates. It may also be distributed to clients of AAM, as well as to other recipients with whom no such client relationship exists. Providing this information does not, in and of itself, constitute a recommendation by AAM, nor does it imply that the purchase or sale of any security is suitable for the recipient. Investing in the bond market is subject to certain risks including market, interest-rate, issuer, credit, inflation, liquidity, valuation, volatility, prepayment and extension. No part of this material may be reproduced in any form, or referred to in any other publication, without express written permission.

October 17, 2016 by

Remain Disciplined

By Elizabeth Henderson, CFA
Director of Corporate Credit

Elizabeth Henderson

We are in the late stage of the credit cycle and anticipate an increase in credit rating downgrades to put pressure on spreads for investment grade issuers. These negative fundamentals are partially offset by strong market technicals. We advocate remaining defensive and selective while maintaining the flexibility to take advantage of opportunities that we expect will arise over the near-to-intermediate term.

[toc]

The Investment Grade Corporate bond market delivered a 1% total return in the third quarter, tightening 18 basis points (bps), as defined by the Bloomberg Barclays index.  Risk assets outperformed, as the S&P Index increased close to 4% in the third quarter, and high yield returned approximately 5%.   Investors largely shrugged off oil price volatility, heavy new debt issuance, weaker than expected economic data, and a lackluster earnings season.  China’s stimulus, dovish monetary policy and resilient economic growth have likely supported risk assets and commodity prices.  Energy and Basic Materials have been significant outperformers this year due to higher commodity prices.

Exhibit 1: U.S. Corporate Investment Grade Option-Adjusted Spread (OAS)

OAS

 Source: Bloomberg Barclays, AAM

For spreads to tighten meaningfully next year, fundamentals need to improve and market volatility needs to remain low.  The cost of equity continues to surpass the cost of debt, incentivizing companies to reduce their equity base to drive growth.  We expect this to continue until the cost of debt reprices, which will not likely come unless the probability of a recession increases and the market grows more concerned about future growth prospects.  We recognize that in general, favorable market technicals, not broad credit fundamentals, have been the primary driver of  tighter spreads.  Thus, we remain disciplined as we build corporate bond portfolios.

Performance Summary Year-to-Date

Performance has been fairly widespread among the non-financial corporate bond sectors year-to-date. Energy and Basic Materials rebounded strongly and would have driven returns even higher if $33 billion of debt had not been downgraded to high yield in January and February of this year.  Longer maturity corporate bonds have outperformed year-to-date given overall spread tightening and the demand from yield focused accounts, especially in Asia.  Financials have lagged because of the prospect of lower rates for longer and the rally in commodity based sectors.  Lastly, shorter maturity corporate bonds have underperformed in recent months in part due to money market reform in the US.  The imposition of a floating NAV for institutional Prime Money Market Funds (MMF) has resulted in an outflow from these funds.  As a result, issuers that had previously relied on CP issuance to Prime MMFs to fund working capital needs have instead tapped the corporate bond market in the 2-3 year space, thus pressuring this part of the corporate curve.

Exhibit 2: U.S. Contributors to IG Corporate Excess Returns YTD 2016

graph-new

Source: Bloomberg Barclays Index (as of 9/30/2016), AAM 

Credit Fundamentals Remain Lackluster

Credit metrics did not improve in the second quarter. Revenue growth (for non financials, excluding commodity related firms) was flat while EBITDA grew a modest 2%. This is not expected to change much in the third quarter, as reflected by analyst estimates. Debt growth at 7% continued to outpace EBITDA growth, as share buybacks accelerated. Shareholders continue to reward firms for using their balance sheets to buyback shares. Other credit metrics deteriorated as well, including cash interest coverage and cash as a percentage of debt.

Option-Adjusted Spread (OAS) per unit of debt leverage is nearing a historically low point. To approach the median (77), OAS needs to widen 55 bps which is about 60% of a one standard deviation move. Otherwise, fundamentals would need to meaningfully improve. This theme is consistent in U.S. high yield as well as European credit. Unless the cost of debt rises (or the cost of equity falls), we do not expect companies to change their behavior radically as it is in the best interest of shareholders to continue to de-equitize unless growth prospects improve.

Exhibit 3: Median OAS/Debt Leverage

OAS/Debt

Source: Bloomberg Barclays, CapIQ using median figures for IG non-Financials as of 6/30/2016, AAM

Regarding growth prospects, economists are not expecting global growth to accelerate much next year, with global GDP expected to increase from 2.9% in 2016 to 3.1% per Bloomberg estimates.

GDP Estimates 2016 (%) 2017 (%)
United States 1.5 2.2
European Union 1.8 1.4
China 6.6 6.3
Japan 0.6 0.8
Latin America -1.7 1.7
United Kingdom 1.8 0.7

Source: Bloomberg (Economist estimates) as of 10/12/2016

M&A Still Preferred Over Capital Investment

Companies continue to use debt and cash to fund acquisitions versus increasing capital expenditures despite increased resistance from regulators and the U.S. Treasury.  Reduced investment spending as a percentage of GDP has been driving productivity lower.

Exhibit 4: (1) North America M&A Volume and (2) Business Investment

BI

Source: St Louis Fed, Bloomberg, AAM 

When analyzing 2017 capital spending estimates for the universe of investment grade companies, we expect spending next year to be approximately flat vs. 2016 on the aggregate with less than ten industries growing at a rate faster than (1) they did in 2016 and (2) the economy overall (2% assumed).  While acquisitions have slowed since the peak in 2015, share repurchases have only accelerated.  Given the relative performance of companies that have pursued this strategy, per Bank of America’s study, we would expect this behavior to continue.

Exhibit 5: Cumulative Stock Performance of Companies Repurchasing Shares Relative to the Market

graph5

Market Supply and Demand Technicals Remain Supportive

Unlike fundamentals, it is difficult to predict a change in technical related behavior.  We note that while valuations look expensive relative to fundamentals, we believe it will take a major shock to increase credit spreads meaningfully in an environment where central banks are buying fixed income securities, reducing available supply.  Demand continues to come from yield hungry foreign investors.

Exhibit 6: Foreign Ownership of USD Corporate Bonds

graph6

Investing in the Late Stage of the Credit Cycle

Defaults have increased this year largely due to commodity related issuers.  We continue to monitor the contagion effects of weak economic growth and tighter credit standards.  We expect the default cycle will be longer and recoveries lower than they have been historically given the (1) amount of debt outstanding is relatively high, (2) low level of interest rates, making it more difficult to lower the cost of debt via monetary policy, and (3) structural changes in the market post financial crisis affecting liquidity (and the ability to access the market for refinancing).  That said, defaults are expected to decline over the near term with the improvement in commodity prices.  Moody’s expects the U.S. default rate to be 5.9%, declining to 4.1% by third quarter 2017.  But as its forecast indicates, the pessimistic rate rivals the rate in 2009.

Exhibit 7: Moody’s US Speculative-Grade Default Rates (Actual and Forecast)

graph7

Source: Moody’s “September Default Report” 10/10/2016

We are in the late stage of the credit cycle and anticipate an increase in credit rating downgrades to put pressure on spreads for investment grade issuers. These negative fundamentals are partially offset by strong market technicals. We advocate remaining defensive and selective with opportunities in intermediate maturity domestic banks, high quality short insurance and autos, electric utilities, M&A related new issuance (e.g., pharma), and select telecom/tower and energy credits.  We want the flexibility to take advantage of opportunities that we expect will arise over the near-to-intermediate term, while investing in credits with more predictable cash flows that offer a yield advantage.  We recognize the importance of earning sufficient income to not only satisfy the needs of our clients but to cushion the spread volatility that is likely to increase from a very low level over the last six months.


Written by:
Elizabeth Henderson, CFA

Elizabeth Henderson is a Principal and the Director of Corporate Credit at AAM with 19 years of investment experience. She joined the firm in 2002. Elizabeth graduated with Honors and Distinction from Indiana University with a BS in Finance and earned an MBA in Finance, Analytical Consulting and Marketing from Northwestern University’s Kellogg School of Management.


For more information about AAM or any of the information in the Corporate Credit View, please contact:

Colin T. Dowdall, CFA, Director of Marketing and Business Development
colin.dowdall@aamcompany.com

John J. Olvany, Vice President of Business Development
john.olvany@aamcompany.com

Neelm Hameer, Vice President of Business Development
neelm.hameer@aamcompany.com

logo


Disclaimer: Asset Allocation & Management Company, LLC (AAM) is an investment adviser registered with the Securities and Exchange Commission, specializing in fixed-income asset management services for insurance companies. This information was developed using publicly available information, internally developed data and outside sources believed to be reliable. While all reasonable care has been taken to ensure that the facts stated and the opinions given are accurate, complete and reasonable, liability is expressly disclaimed by AAM and any affiliates (collectively known as “AAM”), and their representative officers and employees. This report has been prepared for informational purposes only and does not purport to represent a complete analysis of any security, company or industry discussed. Any opinions and/or recommendations expressed are subject to change without notice and should be considered only as part of a diversified portfolio. A complete list of investment recommendations made during the past year is available upon request. Past performance is not an indication of future returns.This information is distributed to recipients including AAM, any of which may have acted on the basis of the information, or may have an ownership interest in securities to which the information relates. It may also be distributed to clients of AAM, as well as to other recipients with whom no such client relationship exists. Providing this information does not, in and of itself, constitute a recommendation by AAM, nor does it imply that the purchase or sale of any security is suitable for the recipient. Investing in the bond market is subject to certain risks including market, interest-rate, issuer, credit, inflation, liquidity, valuation, volatility, prepayment and extension. No part of this material may be reproduced in any form, or referred to in any other publication, without express written permission.

  • « Go to Previous Page
  • Page 1
  • Page 2
  • Page 3
  • Page 4
  • Page 5
  • Go to Next Page »

Get updates in your inbox.

  • Investment Strategies
    • Investment Grade Fixed Income
    • Specialty Asset Classes
  • Our Clients
    • Client Experience
    • Sample RFP Download
  • Insights
    • Video
    • Webinar
    • News
    • Podcasts
  • About
    • Our Team
    • Contact
    • Client Login

Disclaimer: Asset Allocation & Management Company, LLC (AAM) is an investment adviser registered with the Securities and Exchange Commission, specializing in fixed-income asset management services for insurance companies. Registration does not imply a certain level of skill or training. This information was developed using publicly available information, internally developed data and outside sources believed to be reliable. While all reasonable care has been taken to ensure that the facts stated and the opinions given are accurate, complete and reasonable, liability is expressly disclaimed by AAM and any affiliates (collectively known as “AAM”), and their representative officers and employees. This report has been prepared for informational purposes only and does not purport to represent a complete analysis of any security, company or industry discussed. Any opinions and/or recommendations expressed are subject to change without notice and should be considered only as part of a diversified portfolio. A complete list of investment recommendations made during the past year is available upon request. Past performance is not an indication of future returns. This information is distributed to recipients including AAM, any of which may have acted on the basis of the information, or may have an ownership interest in securities to which the information relates. It may also be distributed to clients of AAM, as well as to other recipients with whom no such client relationship exists. Providing this information does not, in and of itself, constitute a recommendation by AAM, nor does it imply that the purchase or sale of any security is suitable for the recipient. Investing in the bond market is subject to certain risks including market, interest-rate, issuer, credit, inflation, liquidity, valuation, volatility, prepayment and extension. No part of this material may be reproduced in any form, or referred to in any other publication, without express written permission. *All figures shown are approximate and subject to change from quarter to quarter. **The accolades and awards highlighted herein are not statements of any advisory client and do not describe any experience with or endorsement of AAM as an investment adviser by any such client.

Copyright © 2024 AAM | Privacy and Disclosures

  • LinkedIn
  • YouTube